Geospatial Data
Teaching European Colonialism
by Georgia Brown
This summer the AGSL K-12 Fellowship went virtual! Our Public Services Librarian worked with four awesome teachers in the Milwaukee area as they developed curriculum for their upcoming school years. To see the projects and lesson plans, check out the AGSL’s Resources for Educators.
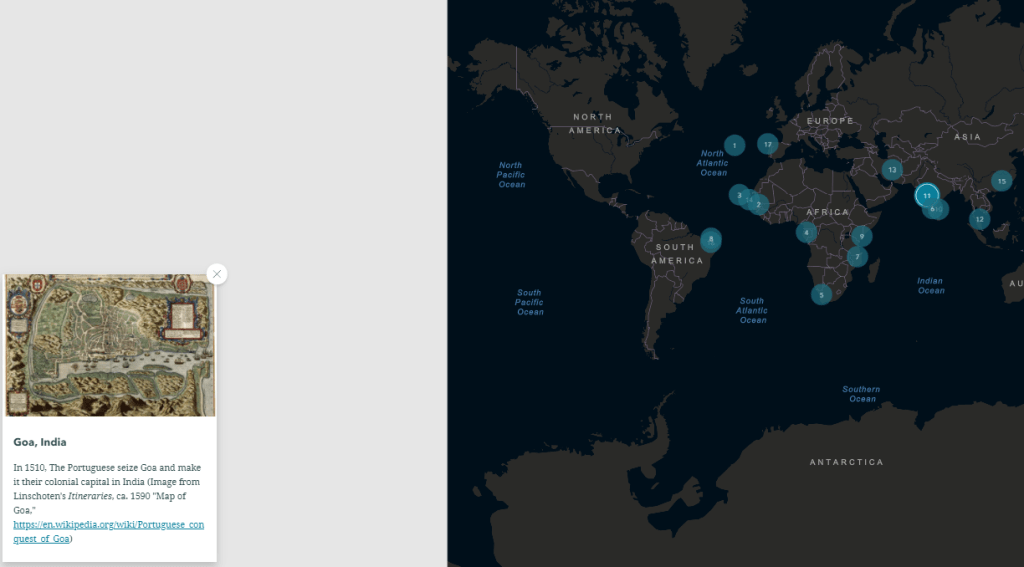
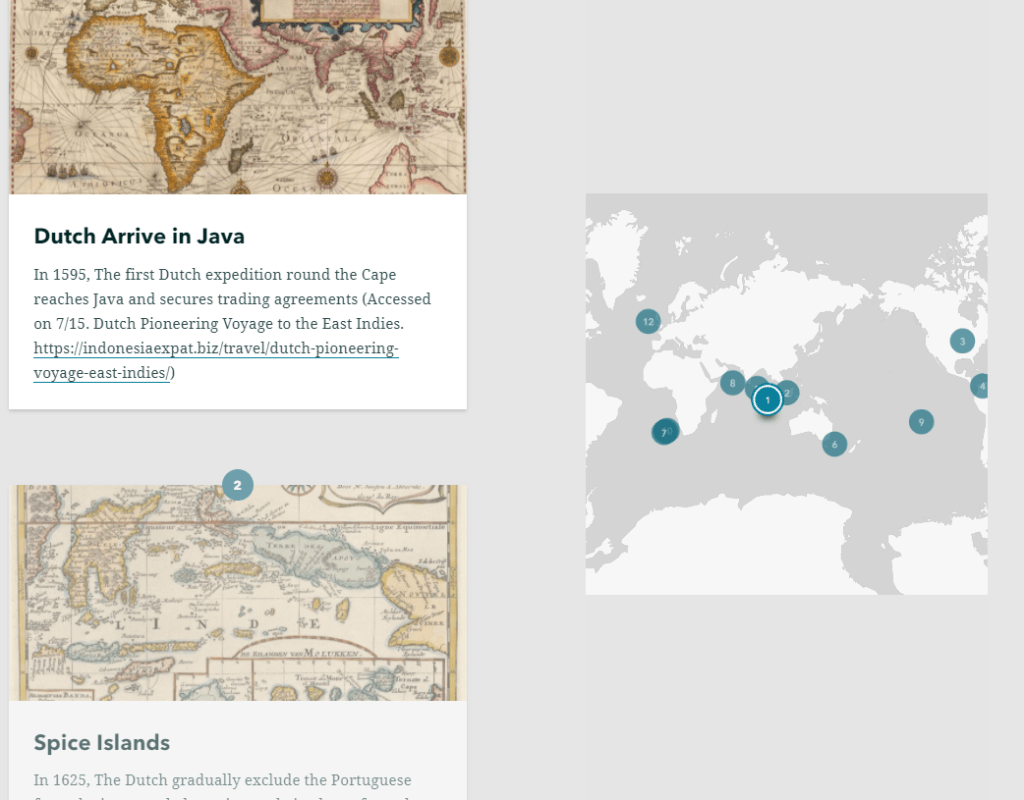
My name is Lukas Wierer, and I am a culturally responsive teacher leader in the Milwaukee Public Schools. I currently teach Ethnic Studies, Restorative Practices and Justice and You at Barack Obama School of Career and Technical Education. Obama is a K-12, but I teach in the high school, which is about 400 students, of which 98% are Black. The unit that I created will be used in my two sections of Ethnic Studies and was focused on European colonialism, specifically the impact that European colonization has had on formerly colonized nations. Throughout this unit, AGSL materials were used primarily as a way to show understanding. For example, I created an ArcGIS StoryMap (European Colonialism) that tracked colonial timelines for six European countries: Portugal, Spain, Great Britain, the Dutch (Netherlands), France, and Germany. Students were asked to examine the timelines, watch accompanying video clips, then, using the AGSL maps, they were asked to connect that content with the given map. I did identify a couple of images of statues/monuments that honor explorers whose “discoveries” were responsible for the resulting colonization of indigenous peoples. I also found a student article from the Black student newspaper, Invictus, entitled “Distortions of Colonization” which will be a good way to show a different perspective on colonialism, specifically the connection to exploitation that has emerged out of global capitalism.
In terms of how I view this unit helping my students, it is part of a sequence. We begin the year by learning about Africa before European arrival, specifically how advanced Africa was economically and politically. This unit will follow immediately and give students a better understanding of how Africa came to be exploited not only for its human resources (through the slave trade), but also for its land and the natural resources that would enrich the colonizers. With these two units as a foundation, we will be able to further examine the role that colonization and global capitalism played in the formation of racist ideas that stick with us today. Although the transition to a virtual classroom will present challenges, I have taught Telepresence for the last two years, so I am not totally unfamiliar with some strategies, but I imagine for this unit, we will spend a lot of our class time really diving deep into the AGSL maps. Because map skills are not typically real strong with my students, this is an area that I will want to explore as a group. The StoryMap and videos should be a little more straightforward for my students. I look forward to using this unit with my students and continuing to blog about how it went.
GIS Day 2019
By Lauren Maddox
It’s that time of year again– happy GIS Day 2019! Well, actually, GIS Day will be tomorrow, Wednesday November 20th. UWM will be celebrating the global event with their own GIS Day program. GIS Day is an opportunity for those of us who are interested in learning about geography and GIS technology to come together with a community of other GIS learners and explore GIS. Anyone interested is encouraged to register for the day’s program and the workshops they would like to attend for GIS Day 2019! Workshops and tours of the AGSL will be offered throughout the day from 9 a.m.-4 p.m. Keynote speaker Dr. Ryan Covington will be giving a talk about “Navigating Geospatial Technology in 2020 and Beyond” over lunch. A complete program of events is available at GIS Day’s UWM webpage. We hope you will join us in celebrating GIS Day this year!
Open Milwaukee County Topographic and Planimetric Data
By Stephen Appel
Open data in Milwaukee has made a huge leap forward this year with the new download capabilities from the Milwaukee County Automated Mapping and Land Information Service (MCAMLIS) out of the Milwaukee County Land Information Office (MCLIO). The MCAMLIS viewer is a feature-full web mapping application that can be found at http://lio.milwaukeecounty.org/mcamlis/. The current web viewer is in its second generation and we expect a third generation web map soon!
In the past, the American Geographical Society Library has entered into a license agreement with the MCLIO which allowed us to distribute the raw data from the MCAMLIS system to UWM users for classroom use only. The data has been available in geodatabase, AutoCAD, and Microstation formats and has been most popular with Urban Planning, Geography, and Architecture students and researchers. Library patrons requesting the data had been required to sign a special MCAMLIS request form and agree to the conditions of the license. The library was also restricted from providing the full county dataset and instead distributed tiles to cover a patron’s area of interest.
As of this year, the MCLIO has made MCAMLIS base map data available for download from their website: http://county.milwaukee.gov/mclio/geodata/imagery/Data-Download-Form.htm. They have also implemented a data download application which is especially helpful if you are only interested in a limited area of the county. The application allows for download of Geodatabase and AutoCAD Drawing formats. The data download application can be found in the online application gallery: http://county.milwaukee.gov/mclio/applications/appgallery.html.
The MCAMLIS topo/planimetric dataset is one of the best collections of high resolution planning data available for Milwaukee County. The features include environmental, hydrologic, park, planimetric, survey control, topographic, transportation, and utility objects. Within each of these categories, there are three feature classes representing 1) text annotations, 2) point features, and 3) line features. In the new File Geodatabase, some of the line features are also available as polygons.
Some of the more useful features that can be extracted from the geodatabase include utility poles, elevation bench marks, topographic contours, tree points, paved roads, driveways, trails, sidewalks, railroads, airport runways, water bodies, structures (buildings), dams, bridges, walls, and text annotation features.
If you think that the MCAMLIS topographic and planimetric features would be useful for your project, but you’re unsure about the data, the AGS library GIS services staff can help. We have been users and distributers of this dataset for almost two decades and have extensive metadata and feature description information that are not included with the download from the MCLIO website. We also have a guide available for extracting individual features from the larger dataset. Contact gisdata@uwm.edu or visit our GIS staff at the AGS library if you would like more information about the MCAMLIS datasets.
