Angie’s Blog
Hubbard Park was once an outdoor beer garden and amusement park
by Angie Cope
” … Ravenna Park was a private amusement emporium and was the last in a series of predecessors to Hubbard Park, a retreat on the east bank of the Milwaukee River in Shorewood. It started when F.A. Lueddemann opened his farm to the public in 1872. Otto Zwietusch, a soda-water maker and inventor, bought Lueddemann’s-on-the-River the next year fir $9,000 and turned it into his Mineral Springs Park. In 1900 it was sold again, to become Coney Island, an amusement park complete with a roller coaster. But Coney Island lasted only three years. It was revived in 1905 as Wonderland, and its owners added a Ferris wheel and a tower covered with electric lights. In 1909, R.W. Hopkins changed Wonderland into Ravenna, adding movies, a miniature railroad and a “laughing gallery.” Milwaukeeans reached the amusement park via the suburban railroad and later on streetcars. In 1916 it was divided into three parts: today’s Hubbard Park, a residential neighborhood adjacent to it and Electric Co. streetcar yards off Edgewood and Oakland Aves., which now is the site of an apartment complex for the elderly.” – Milwaukee Public Library Digital Collections –
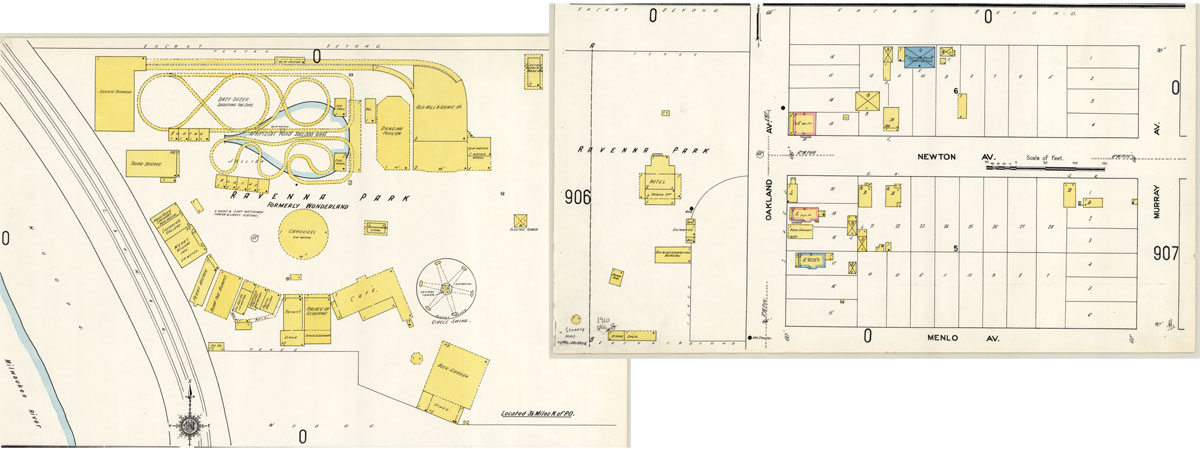
To view this Sanborn map in more detail at the UWM Libraries Digital Collections.
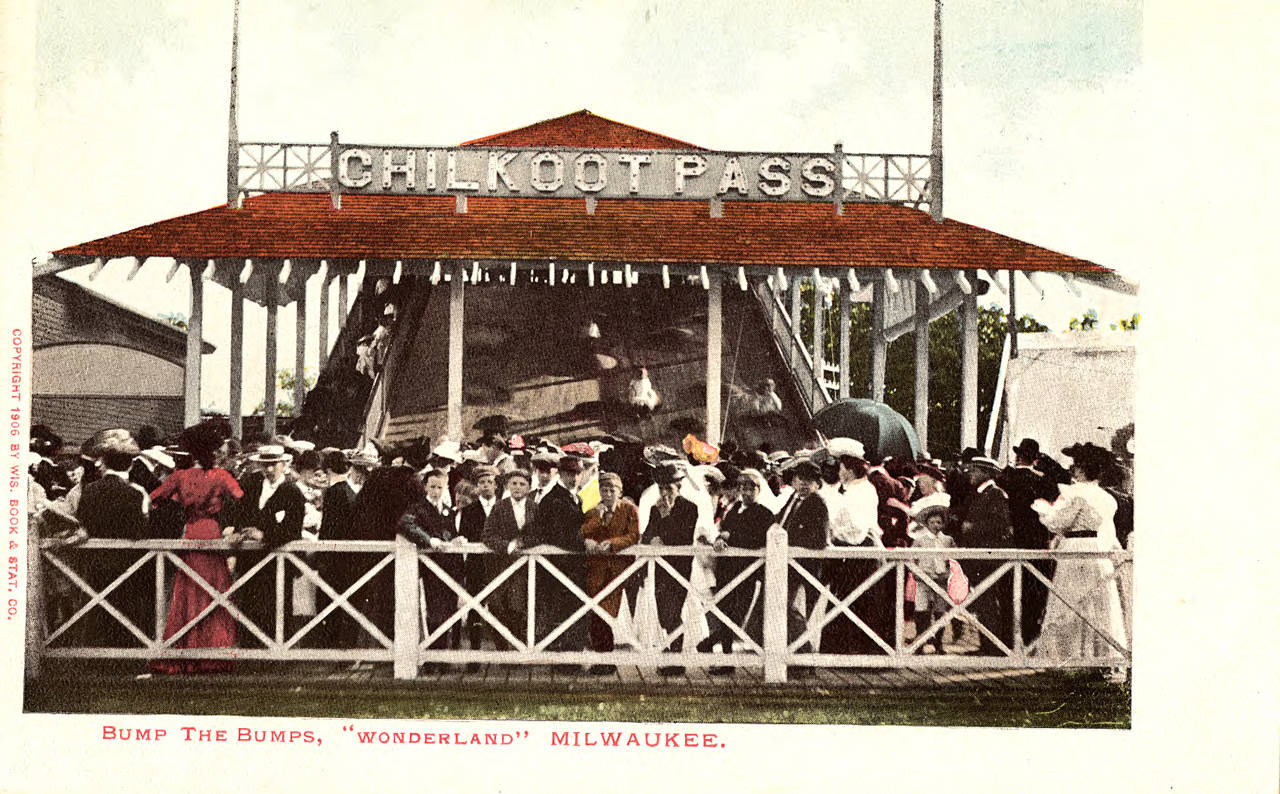
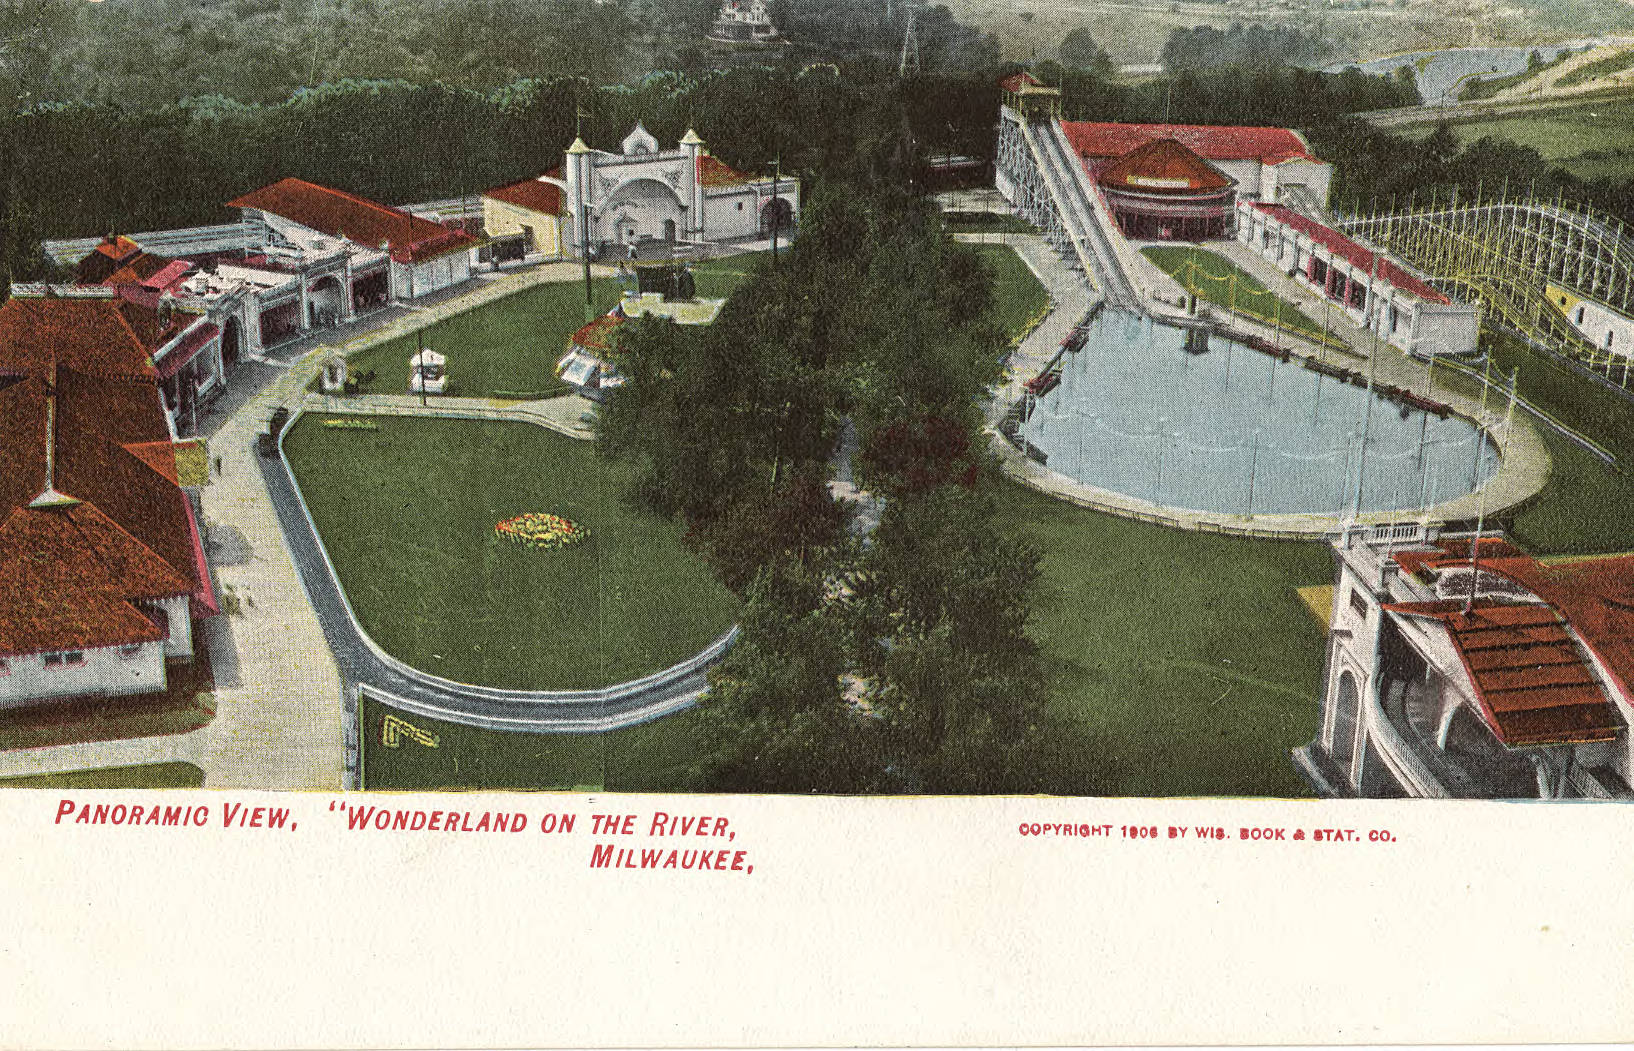
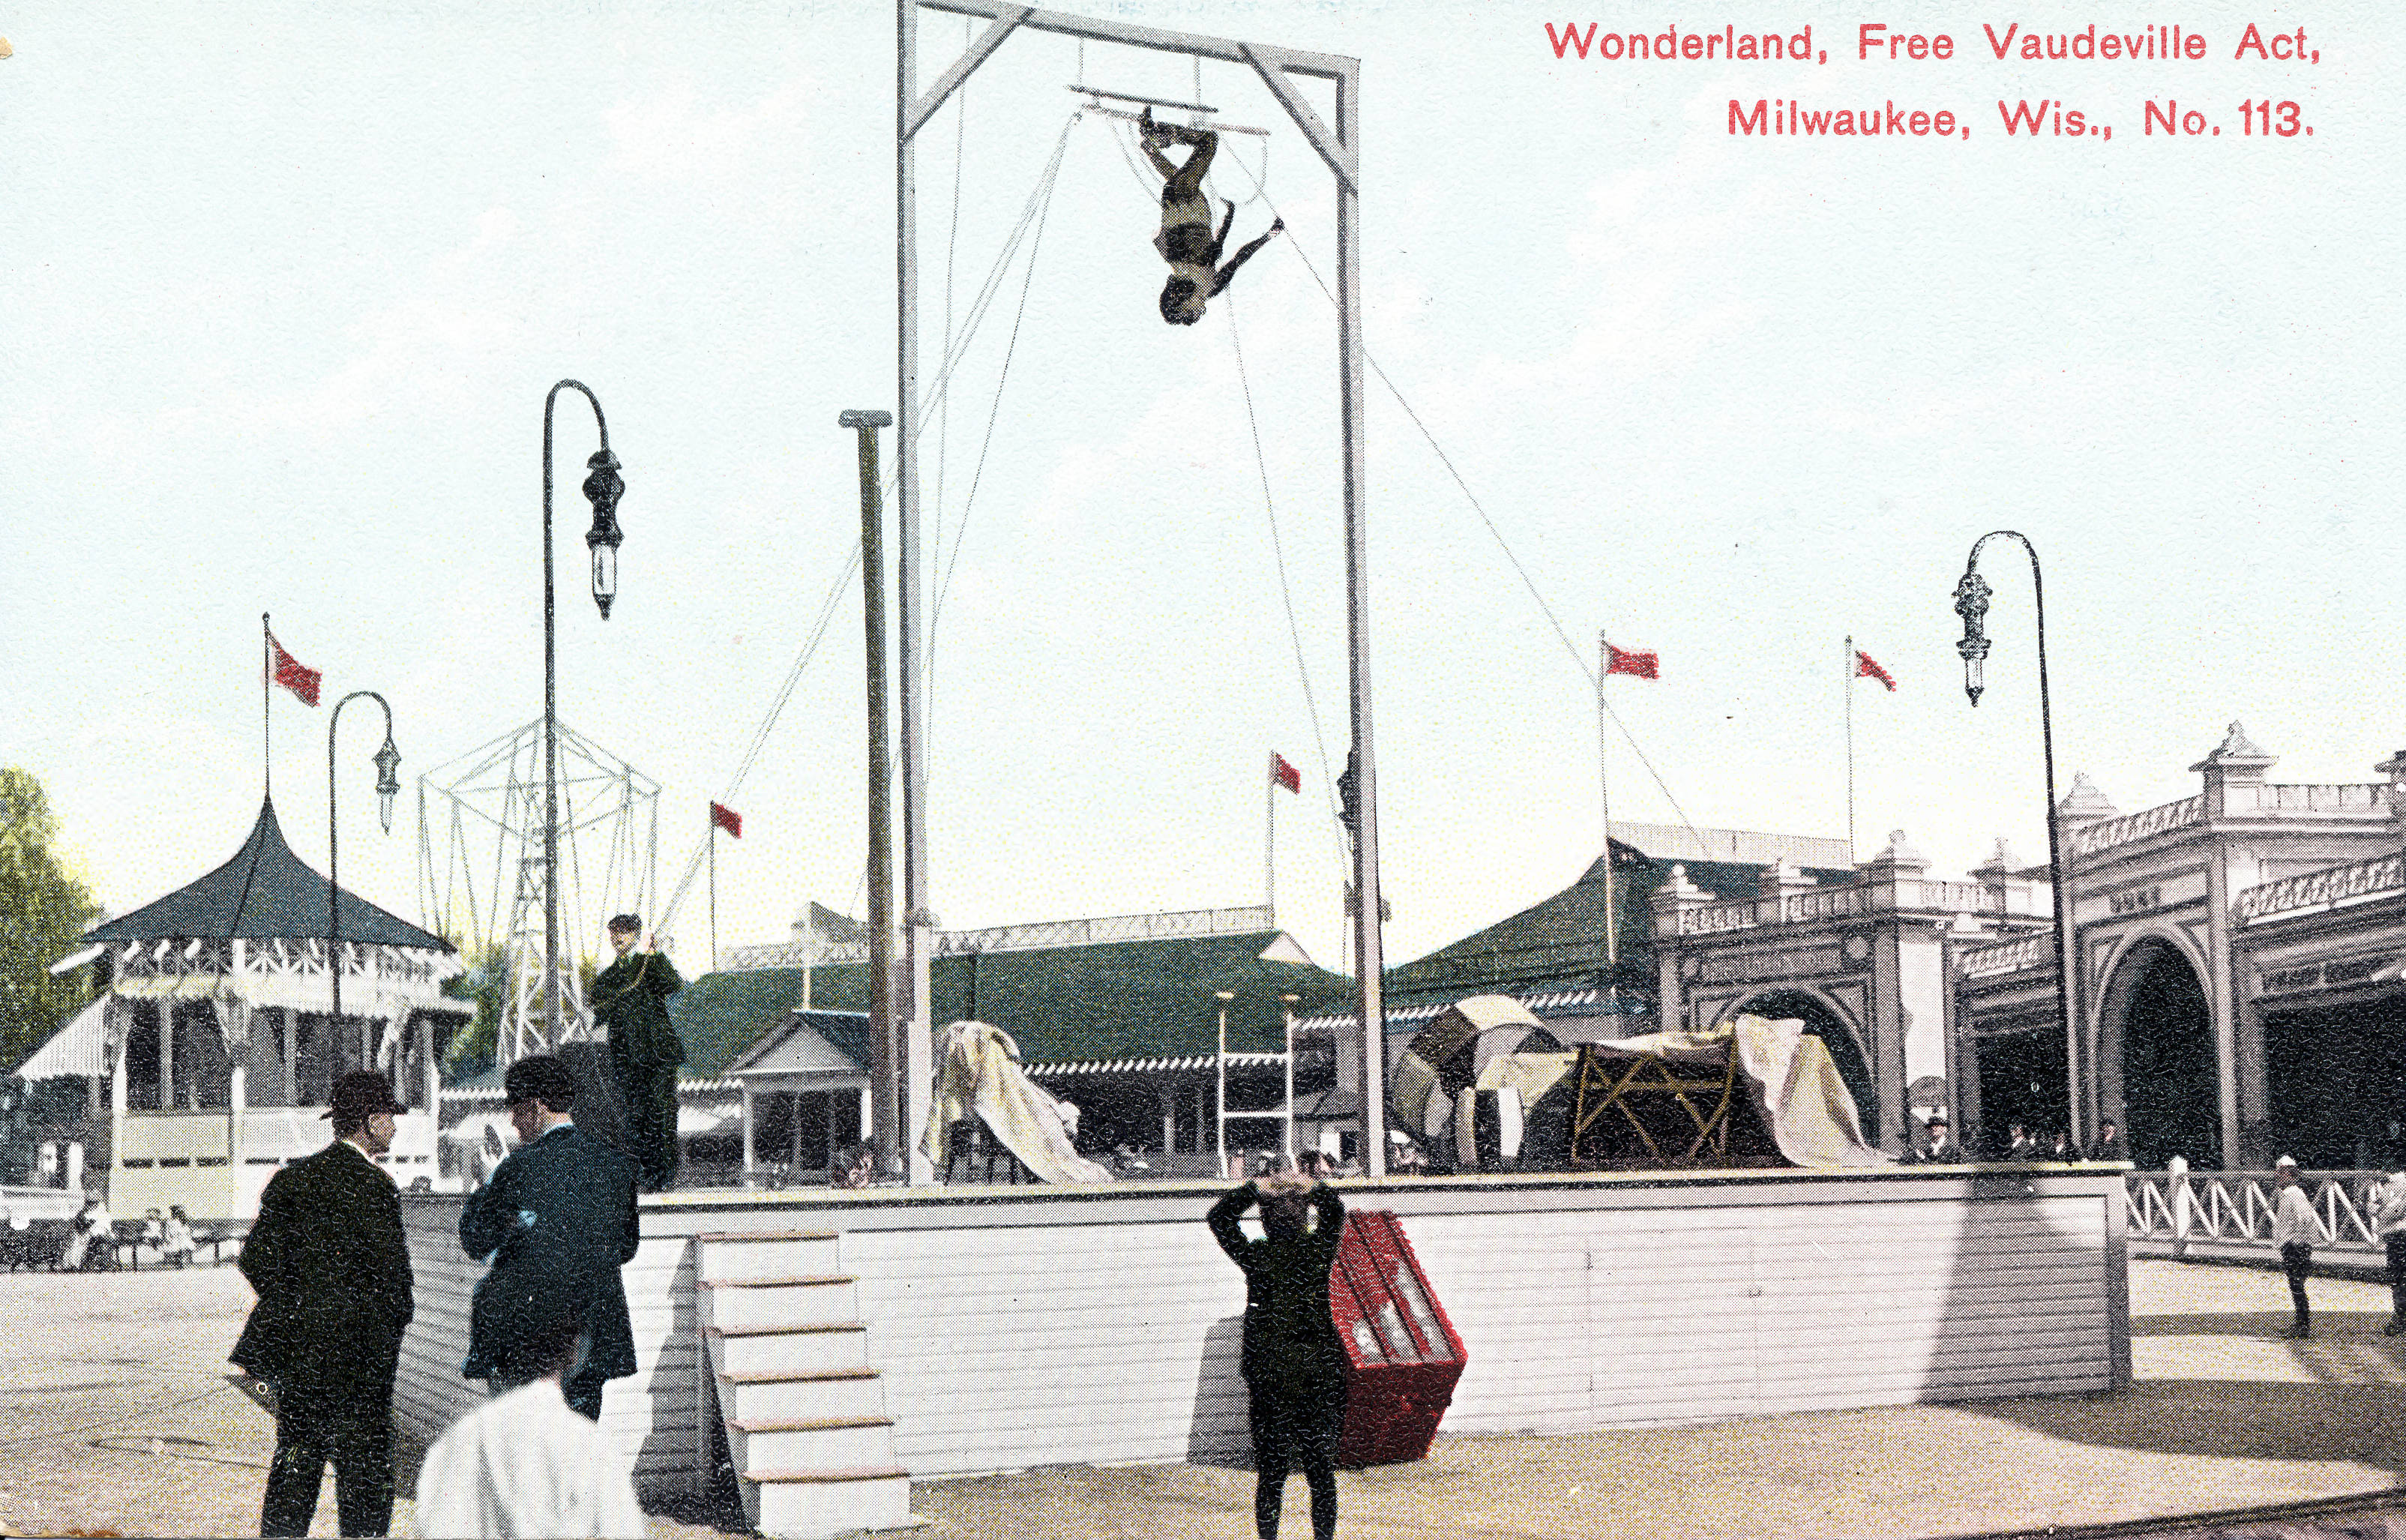
Here are some postcards from the UWM Archives Digital Collections that depict the amusement park as it was …
Native American Mapping of the Belcher Islands
by Angie Cope
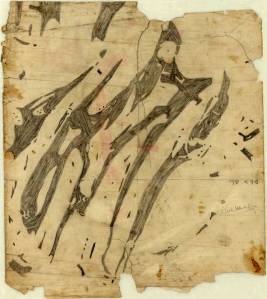
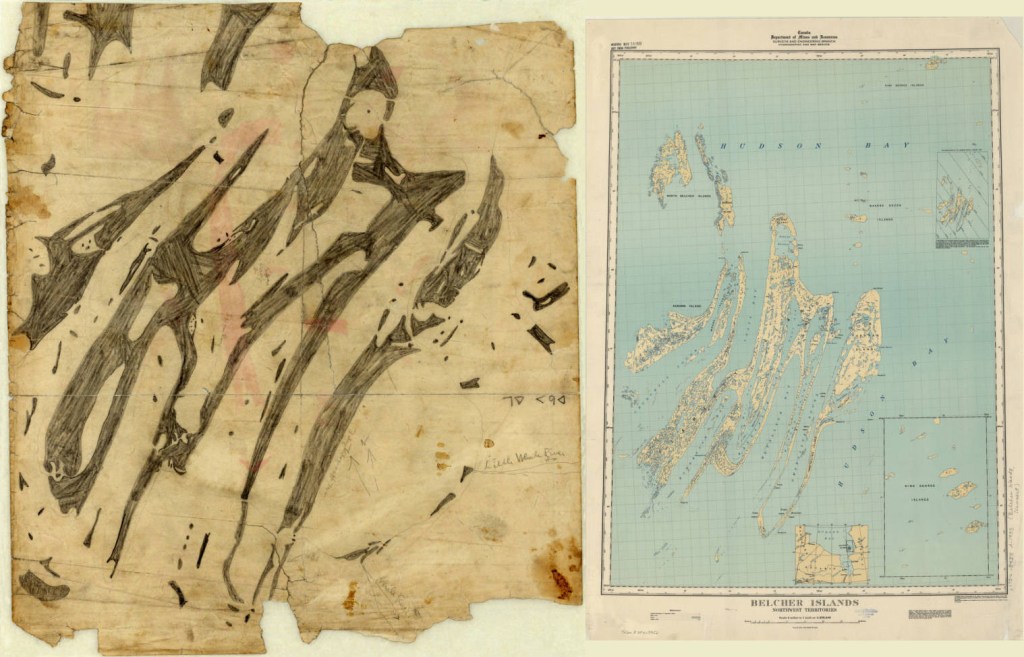
This map is the central object in the story of how geographical knowledge was passed from an Inuk man named Wetalltok to a non-native explorer. In an article in the Geographical Review in 1918, Robert J. Flaherty (1884–1951) recounted the story of how, while he was searching for iron ore deposits on the east coast of Hudson Bay, Canada, Wetallok explained the intricacies of the bay’s island system and shared with him this remarkably accurate Eskimo map, which Flaherty reproduced in the article.
Flaherty later became a director and producer whose first film, Nanook of the North (1922), was one of the best known documentaries of the silent-era. Flaherty also told the story of his encounter with Wetallok in his 1924 book, My Eskimo Friends: “Nanook of the North.” Recent historians of cartography, notably G. Malcolm Lewis in Cartographic Encounters: Perspectives on Native American Mapmaking and Map Use, and Lewis and David Woodward in History of Cartography, also have used the map as an example of indigenous cartography.
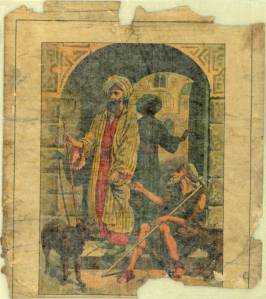
The map is drawn with pencil on the back of a missionary lithograph. Notations are in English and Inuktitut syllabics. Flaherty’s annotations include “Little Whale River” [with arrow], “Whale River” [with arrow], and “3 days = dogs = app. 70 miles.”
Click here to view the map in the AGS Library Digital Map Collection
Creating a school wall map in 1913
This print shows three building views of Justus Perthes’ Geographische Anstalt in Gotha, Germany. The illustrations show the process used in the creation and printing of Justus Perthes school wall maps in 1913.
View this item in the AGS Library Digital Map Collection
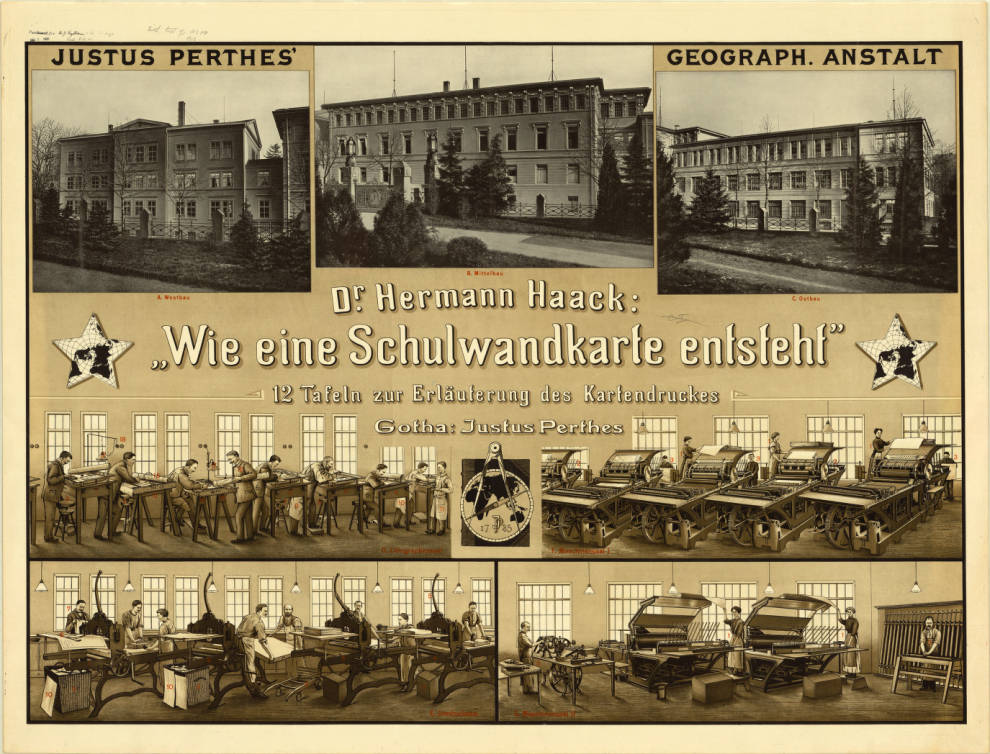
Points identified in red are indexed in: Wie eine Schulwandkarte entsteht : eine Führung durch die lithographischen Werkstätten von Justus Perthes’ Geographischer Anstalt / von Hermann Haack, 1913 (viewable here: http://uwm.edu/libraries/agsl/schulwandkarte/ )
Fordlandia, Brazil
by Angie Cope
I’ve worked at the AGS Library for over a decade and I am still amazed to find materials on nearly every topic. A couple years ago I caught the last 15 minutes of the PBS television special on Henry Ford (available online). Among Ford’s successes and failures was mention of his Utopian community built in the Amazon rainforest. Returning to work, I checked the map drawers to see if I could find any maps of Fordlandia.
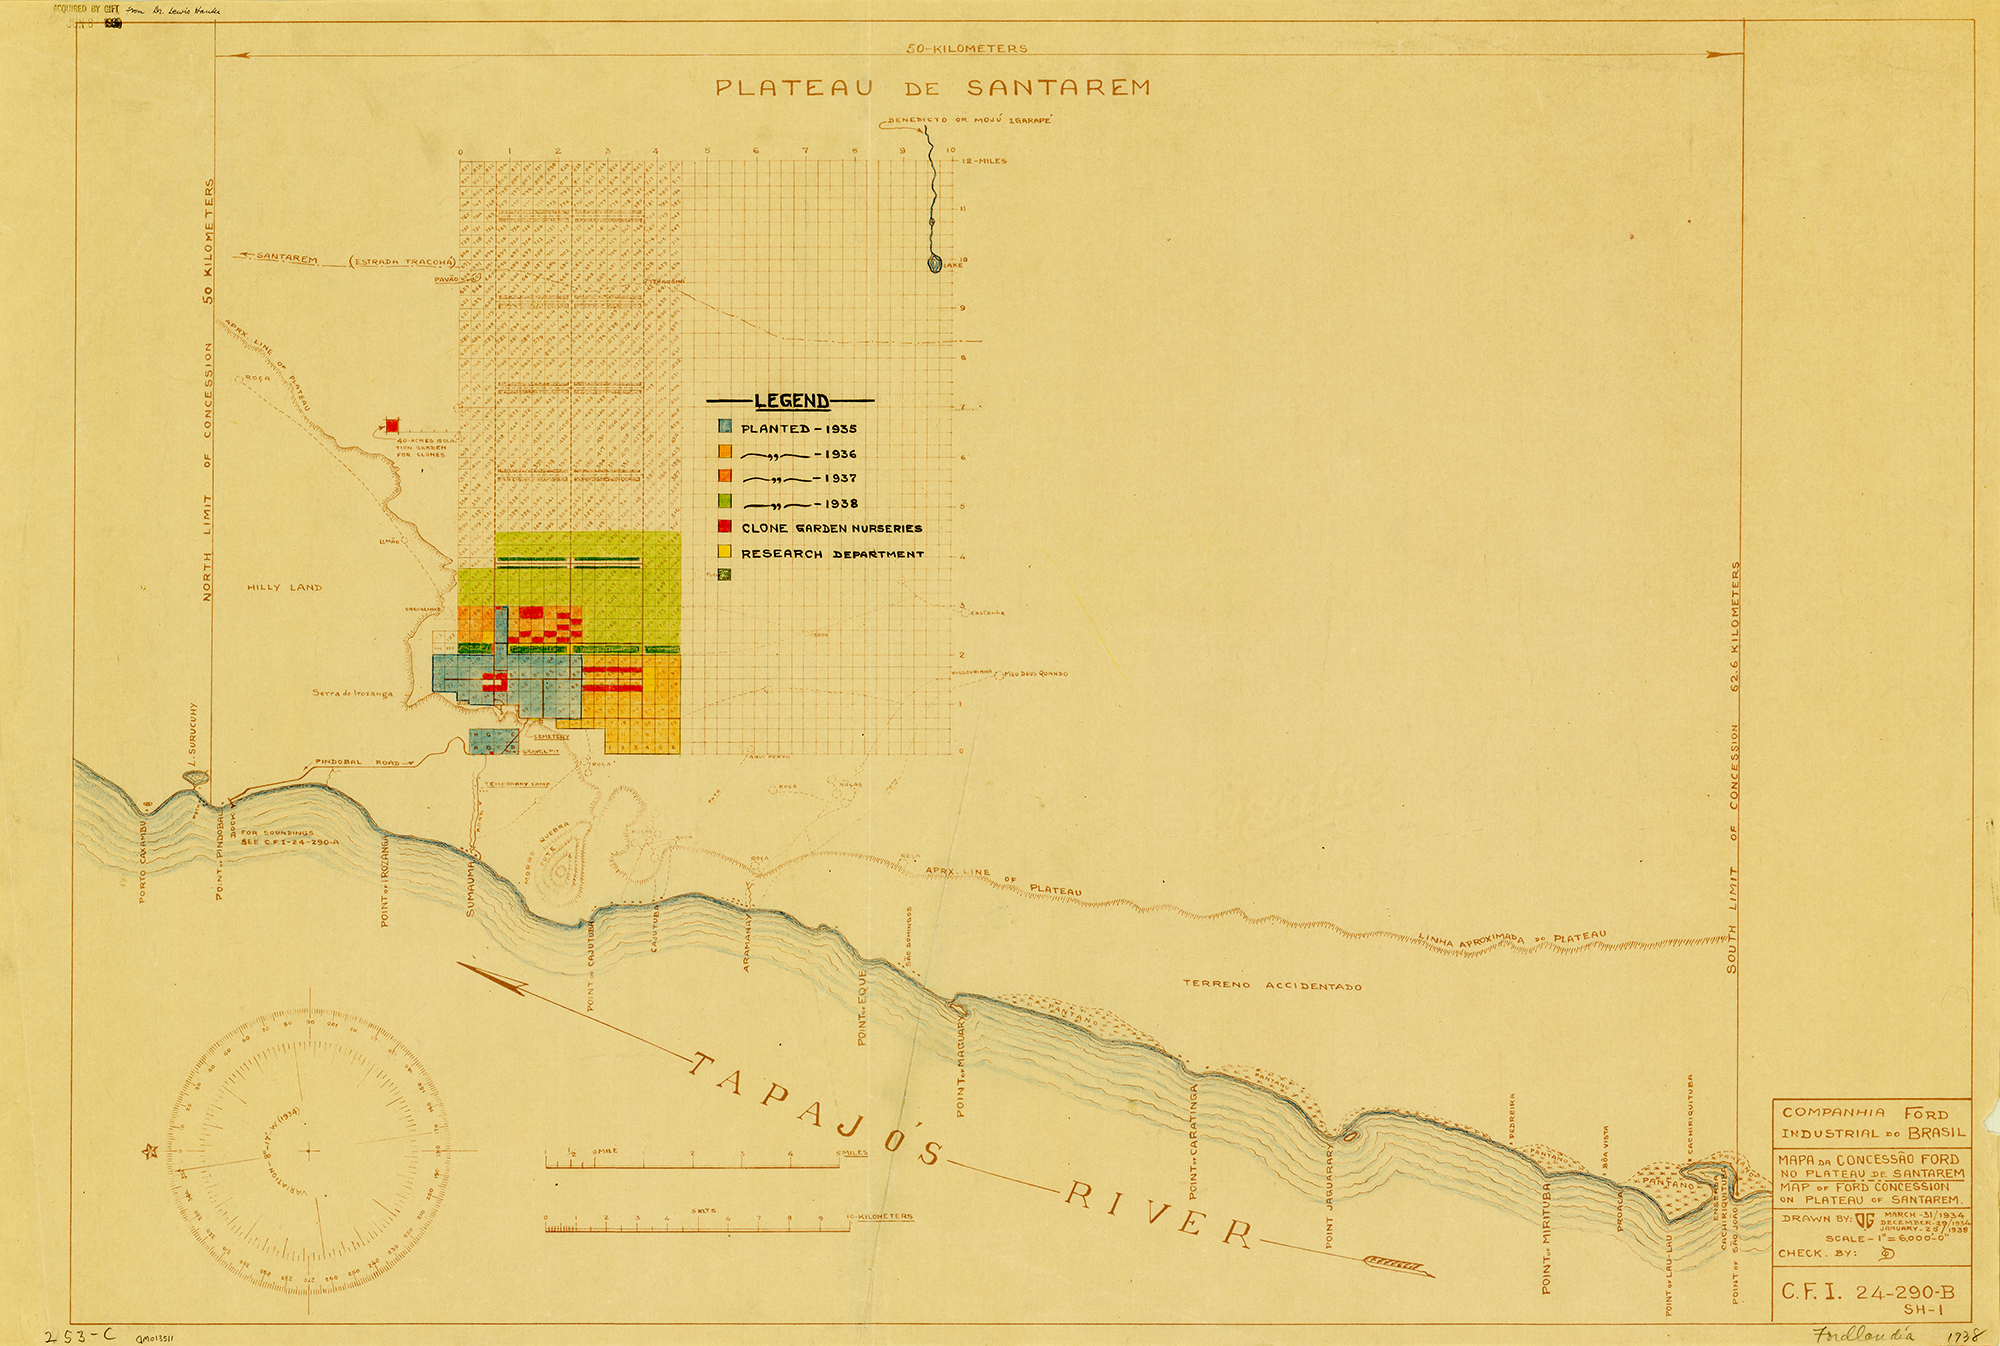
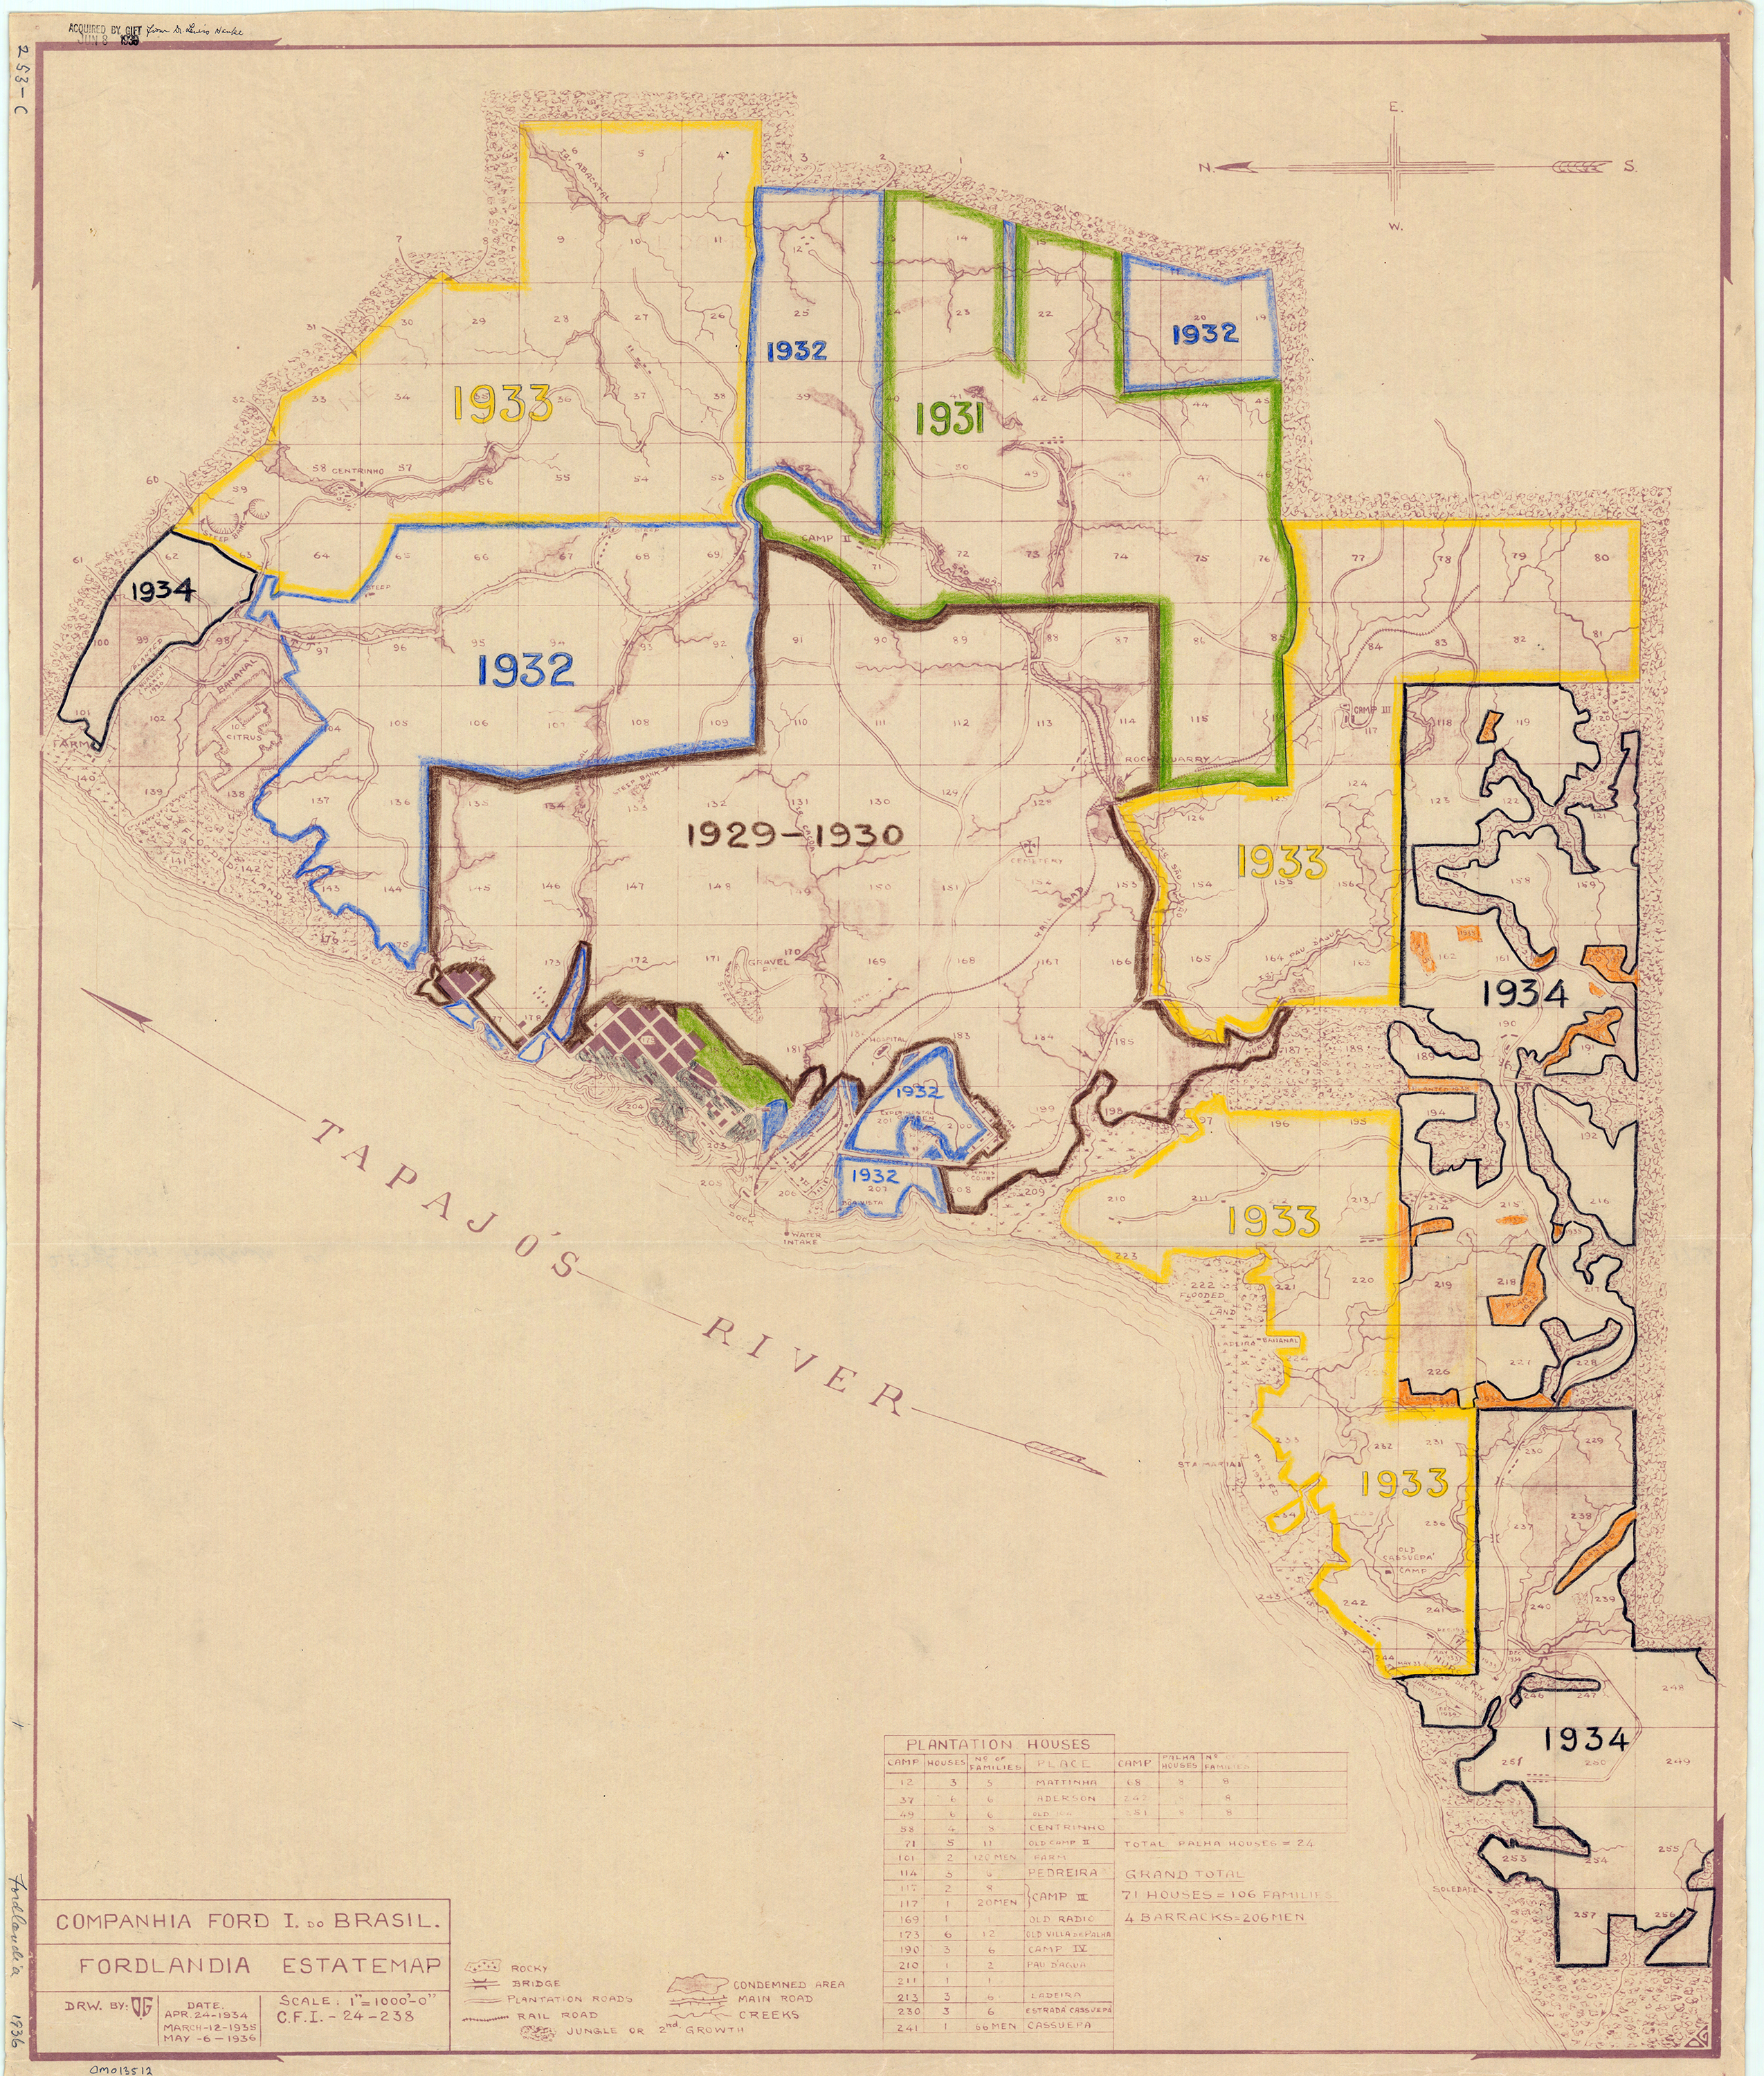
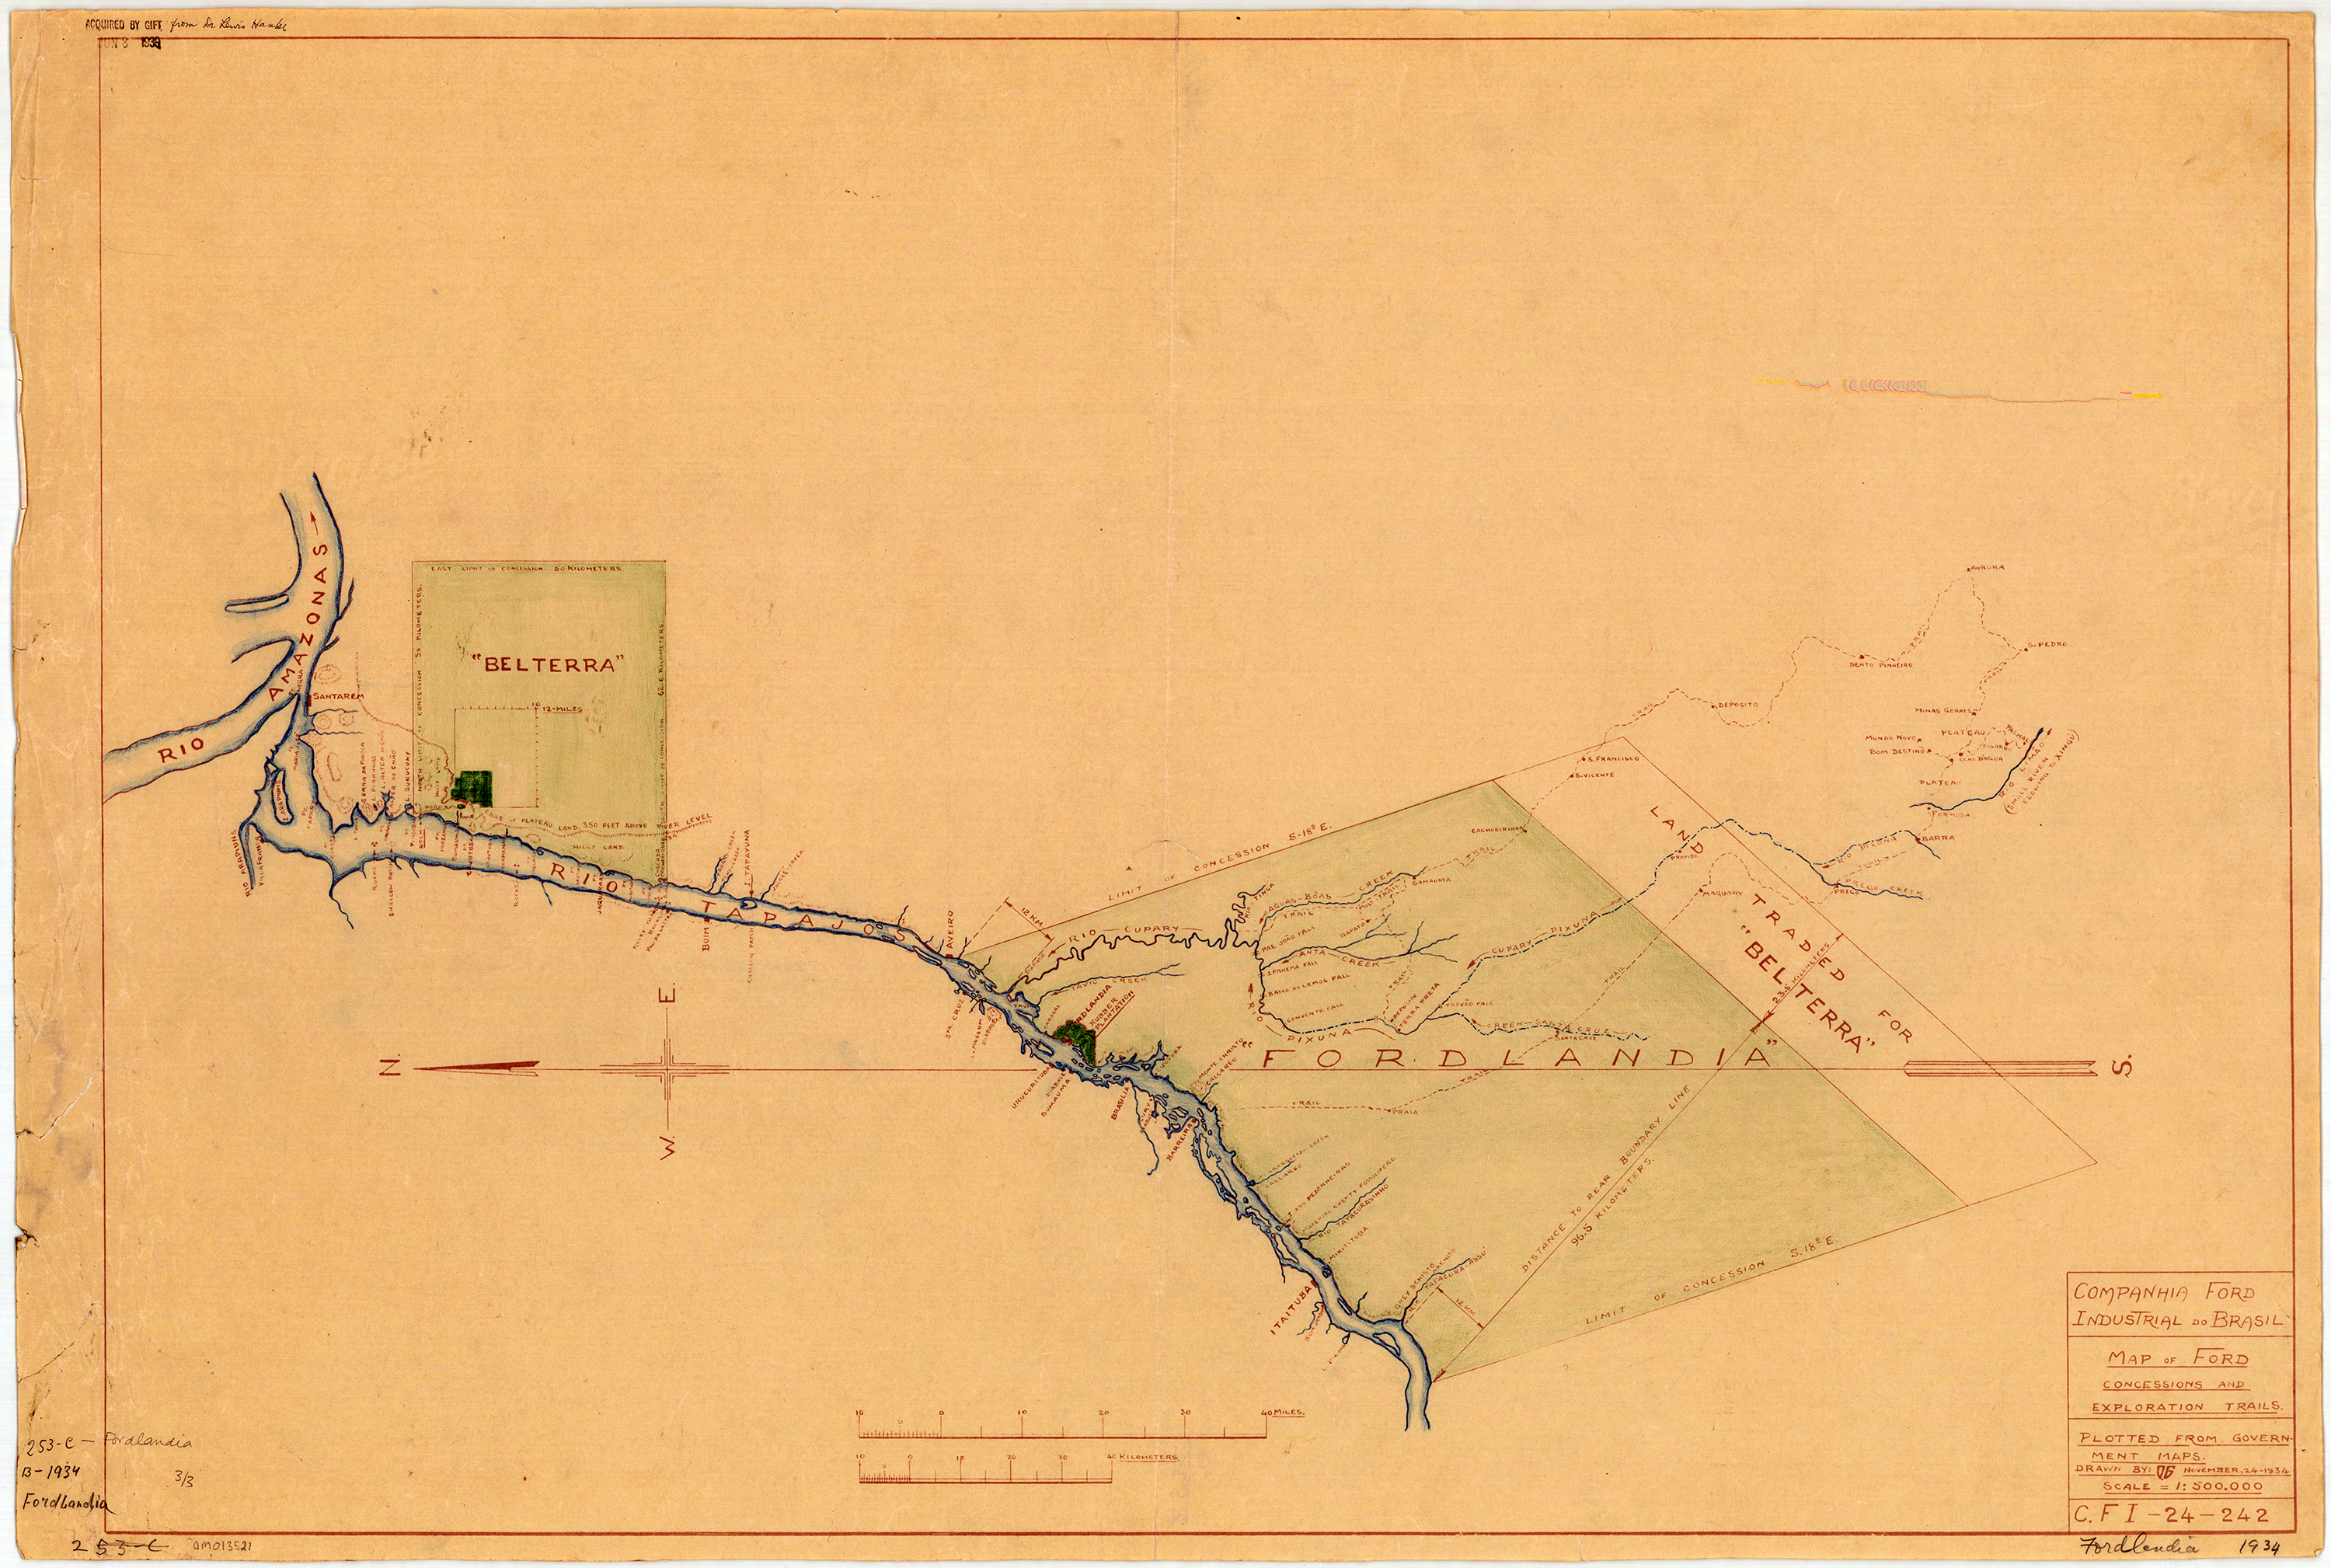
Sure enough, I discovered three annotated, blueline print maps dontated to the AGS in 1939 from Dr. Lewis Hanke. Hanke was a preeminent Latin American historian who corresponded with the AGS while researching his Handbook of Latin American studies.
The Fordlandia story generally goes like this …
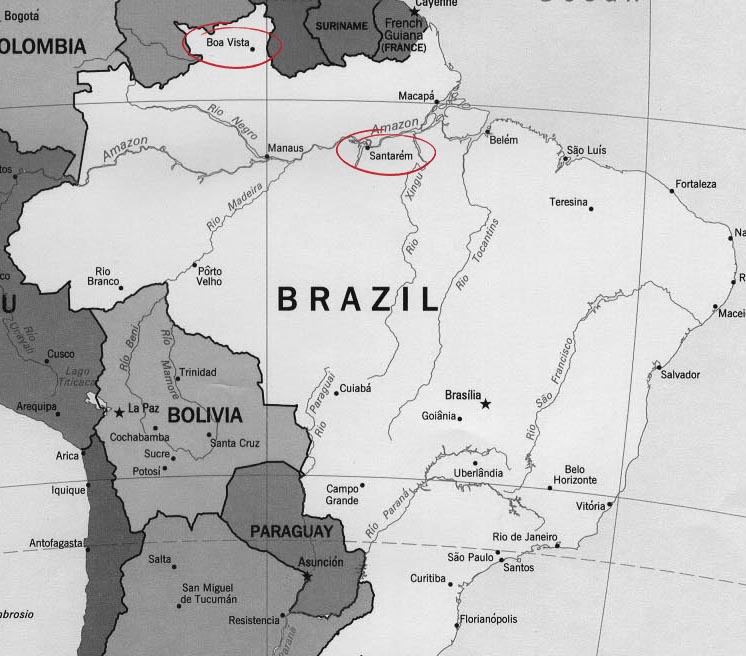
In 1927 Henry Ford purchased 2,471,000 acres of land in the Amazon rainforest from the State of Para, Brazil. Ford ambitiously hoped to free his company’s dependence on foreign rubber by starting a rubber plantation. This first concession of land was in the north of Brazil at Boa Vista.
Clearing of the land began in 1929 and production problems ensued almost immediately. Ford had relocated employees from the U.S. to run the plantation and hired local workers as labor. Personnel issues ranged from illness and homesickness to rebellion. The city was modeled after Dearborn, Michigan and had a power plant, library, golf course, barber, hospital, and housing for employees. Ford expected residents would enjoy leading a wholesome American lifestyle, eating hamburgers and living in homes similar to those in Dearborn. Quickly, local workers protested working conditions. Among their grievances was working 8 hours during the heat of the day when they were accustomed to working early-morning and late-evening shifts. Conditions became so bad that workers rioted.
________________________________________________
In addition to personnel issues, Ford’s engineers lacked knowledge of growing rubber trees. Seeds were planted too closely together making them easy prey for tree disease and pests. Before long, most of the trees died.
By 1934, the State of Para exchanged 695,586 of the original acres for an equal-sized waterfront area 30 miles south of Santarem. The original area, named Boa Vista, was never used as a plantation again but was used as a research station and laboratory for many years.
The new site of Belterra, with flatter topography, offered better conditions for producing rubber and allowed the use of machinery. However, a drop in demand for rubber and high costs of production made Belterra economically unfeasable for Ford. Eventually the plantation was sold to the Brazilian government.
Returning to my observation that the AGS Library has items on nearly every topic, I also enjoy how any map in the collection can distract the user in a dozen different directions. Whether writing about Lewis Hanke, the donor of the 3 Fordlandia maps, or simply researching the annotations – there is so much of interest to consider. Who annotated the maps? Who gave them to Hanke and why? What was Hanke’s relationship to the AGS of NY? Who is the O.G. cited as the draftsman of the maps?
There are many other great internet sites and books if you’d like to find out more about Fordlandia.
Historic images from the Benson Ford Research Center can be seen here.

The Ruins of Fordlandia (from “Damn Interesting” blog) by Alan Bellows is quite good
Fordlandia : the rise and fall of Henry Ford’s forgotten jungle city (2009) by Greg Grandin is a great read. (Description and review: http://www.popmatters.com/review/126045-fordlandia-by-greg-grandin/)
July 28, 2016 Update
Susan Dykes, the AGSL Metadata Specialist, recently discovered 43 photographs held at the AGS Library from Robert S. Platt in Fordlandia.
You may view them here:
http://collections.lib.uwm.edu/cdm/search/searchterm/fordlandia/field/all/mode/all/conn/and/order/title/page/1
Click here for information on the Robert S. Platt collection
USGS Copper Plates
by Angie Cope
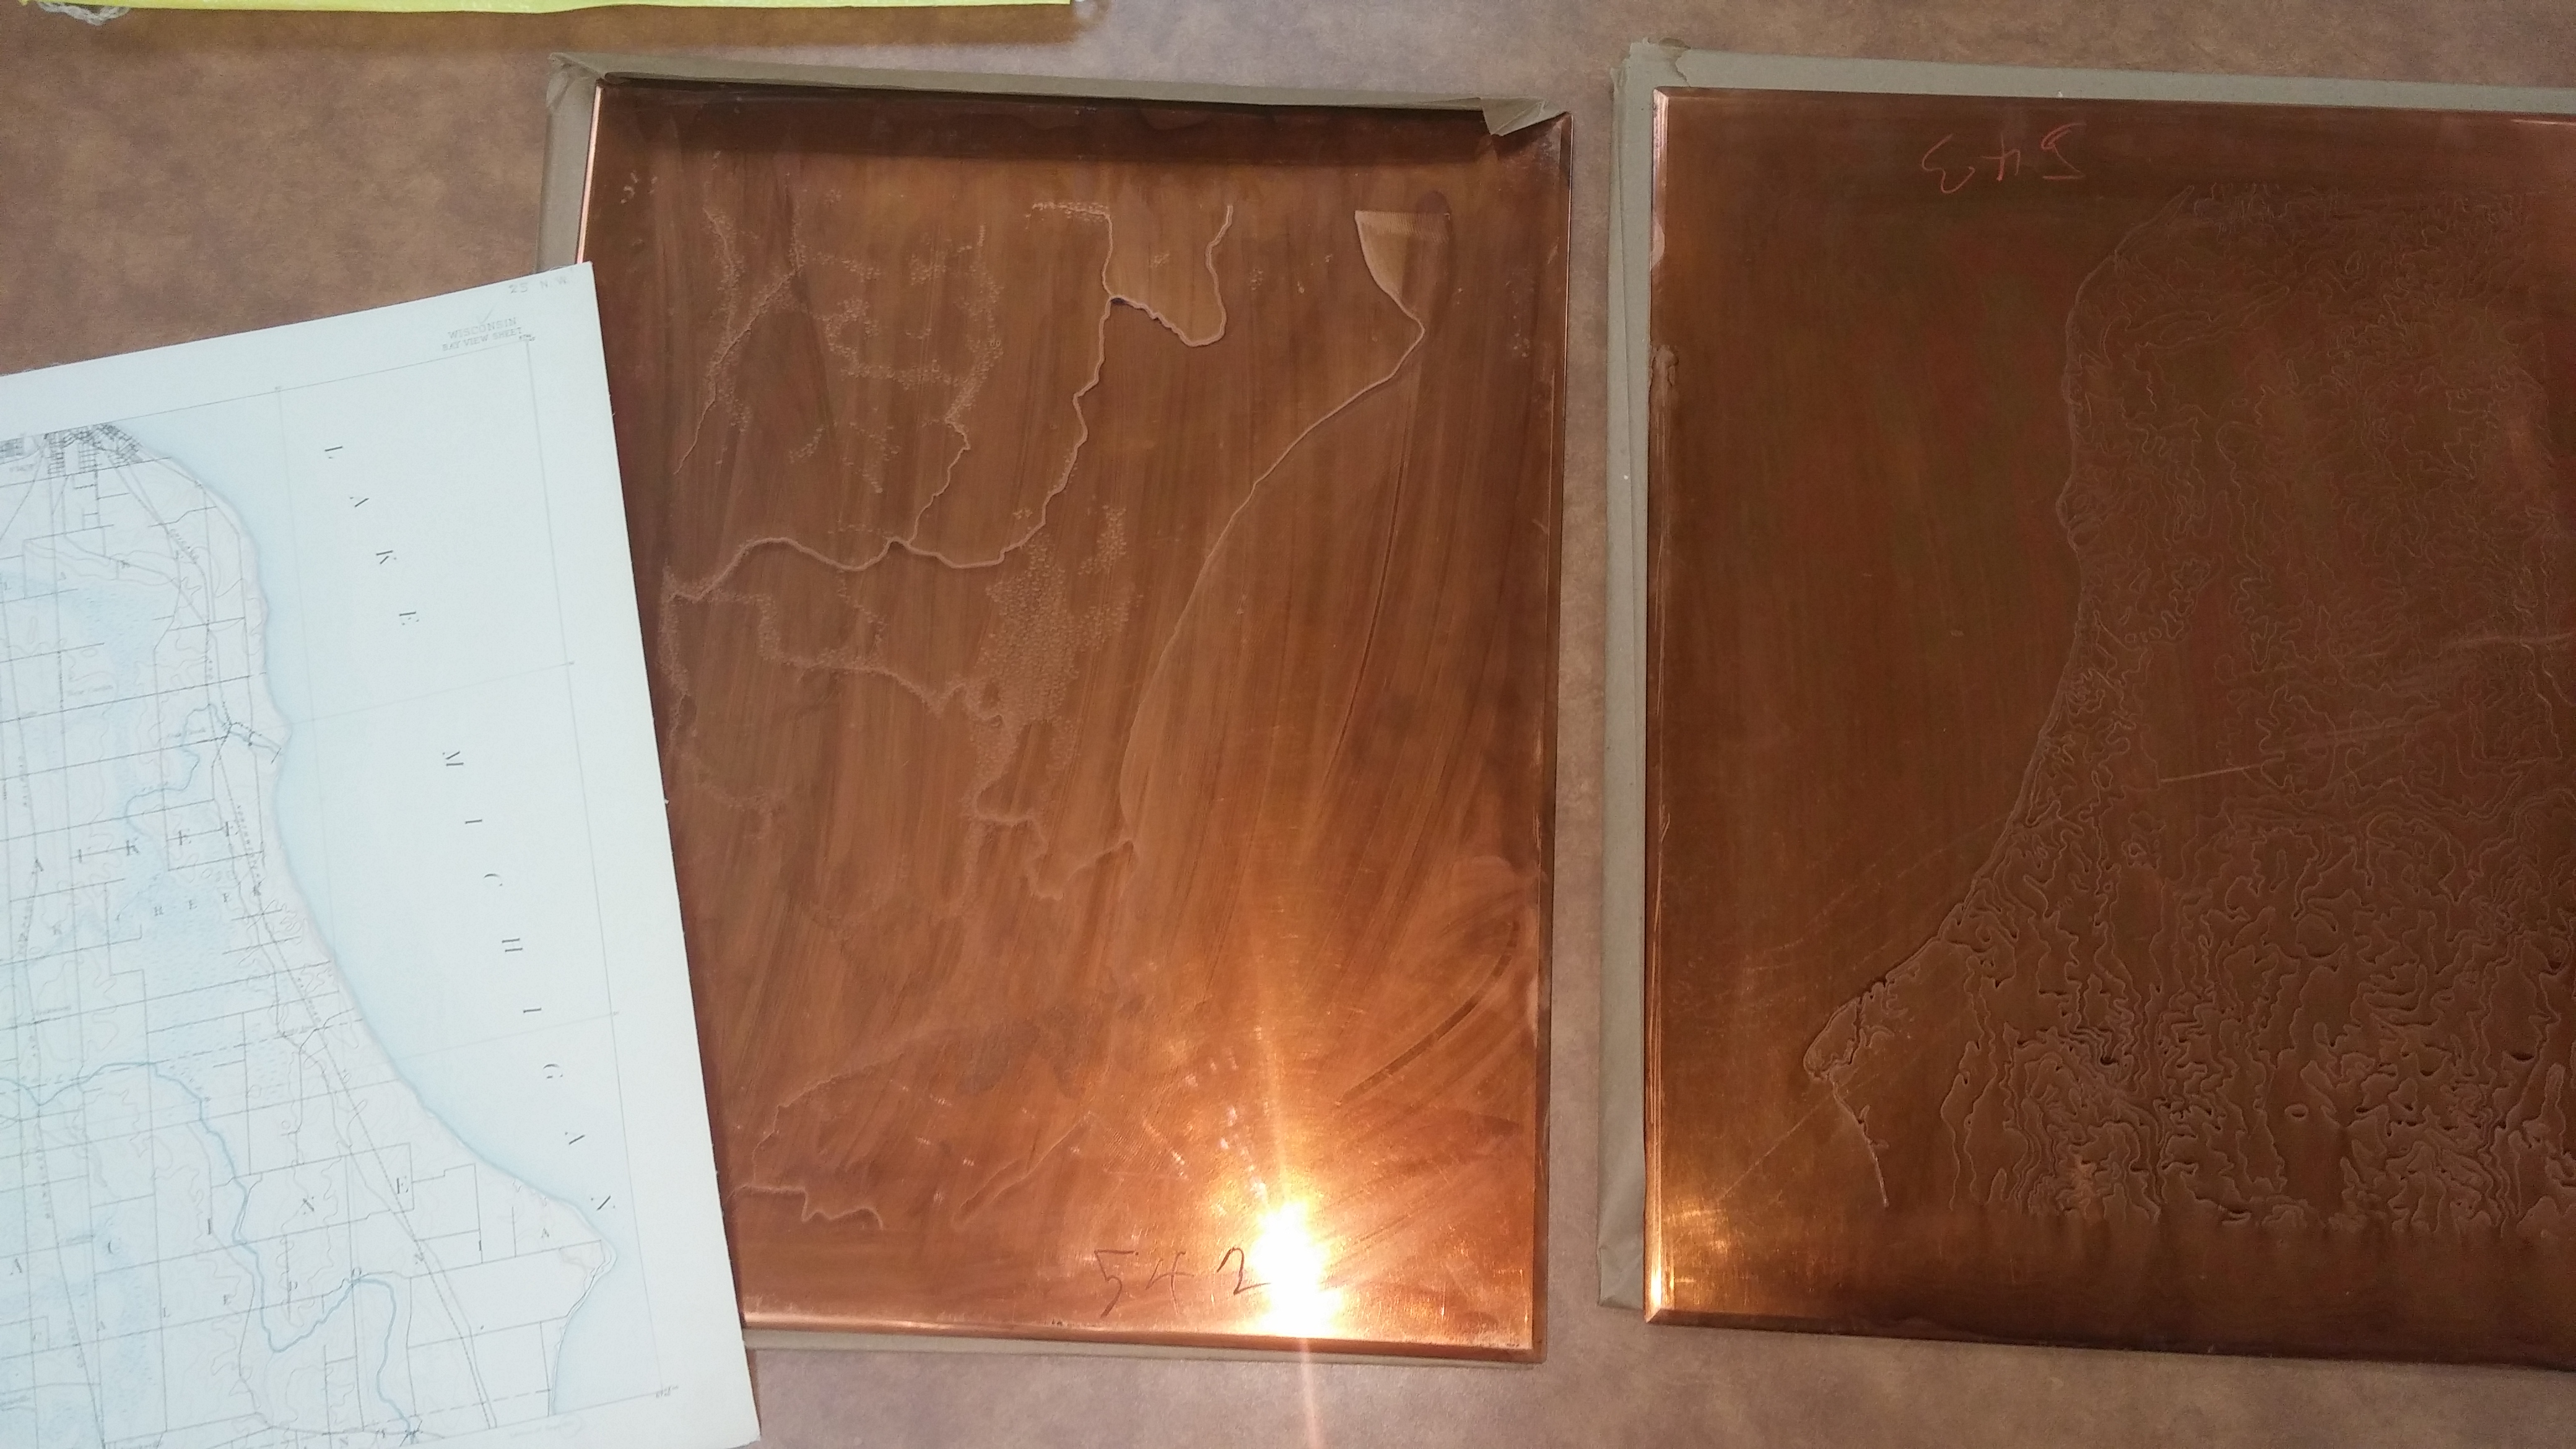
The technology of making maps has changed radically over the years and at the AGS Library, we endeavor to preserve the tools used in that process. In the summer of 2014, the United States Geological Survey made hand engraved copper plates available to libraries and universities via the Federal Surplus system. The plates were used in the engraving of maps and diagrams between 1880s to the 1950s. Three copper plates were used in the construction of each topographic map. Civil divisions and public works were represented in black, water features in blue, and contours and miscellaneous features in brown.
AGSL already owned a Milwaukee 1:62,500 set of plates and now is fortunate enough to add three additional sets to their holdings. The plates acquired this year are for Bayview, Whitewater and Waukesha topographic maps dating from the early 1900s. These will help AGSL, Special Collections and various UWM departments in teaching about history of earth science data collection and compilation, maps and mapping techniques, and engraving and printing techniques.
More pictures of the plates can be seen at the AGS Library Flickr photograph page.
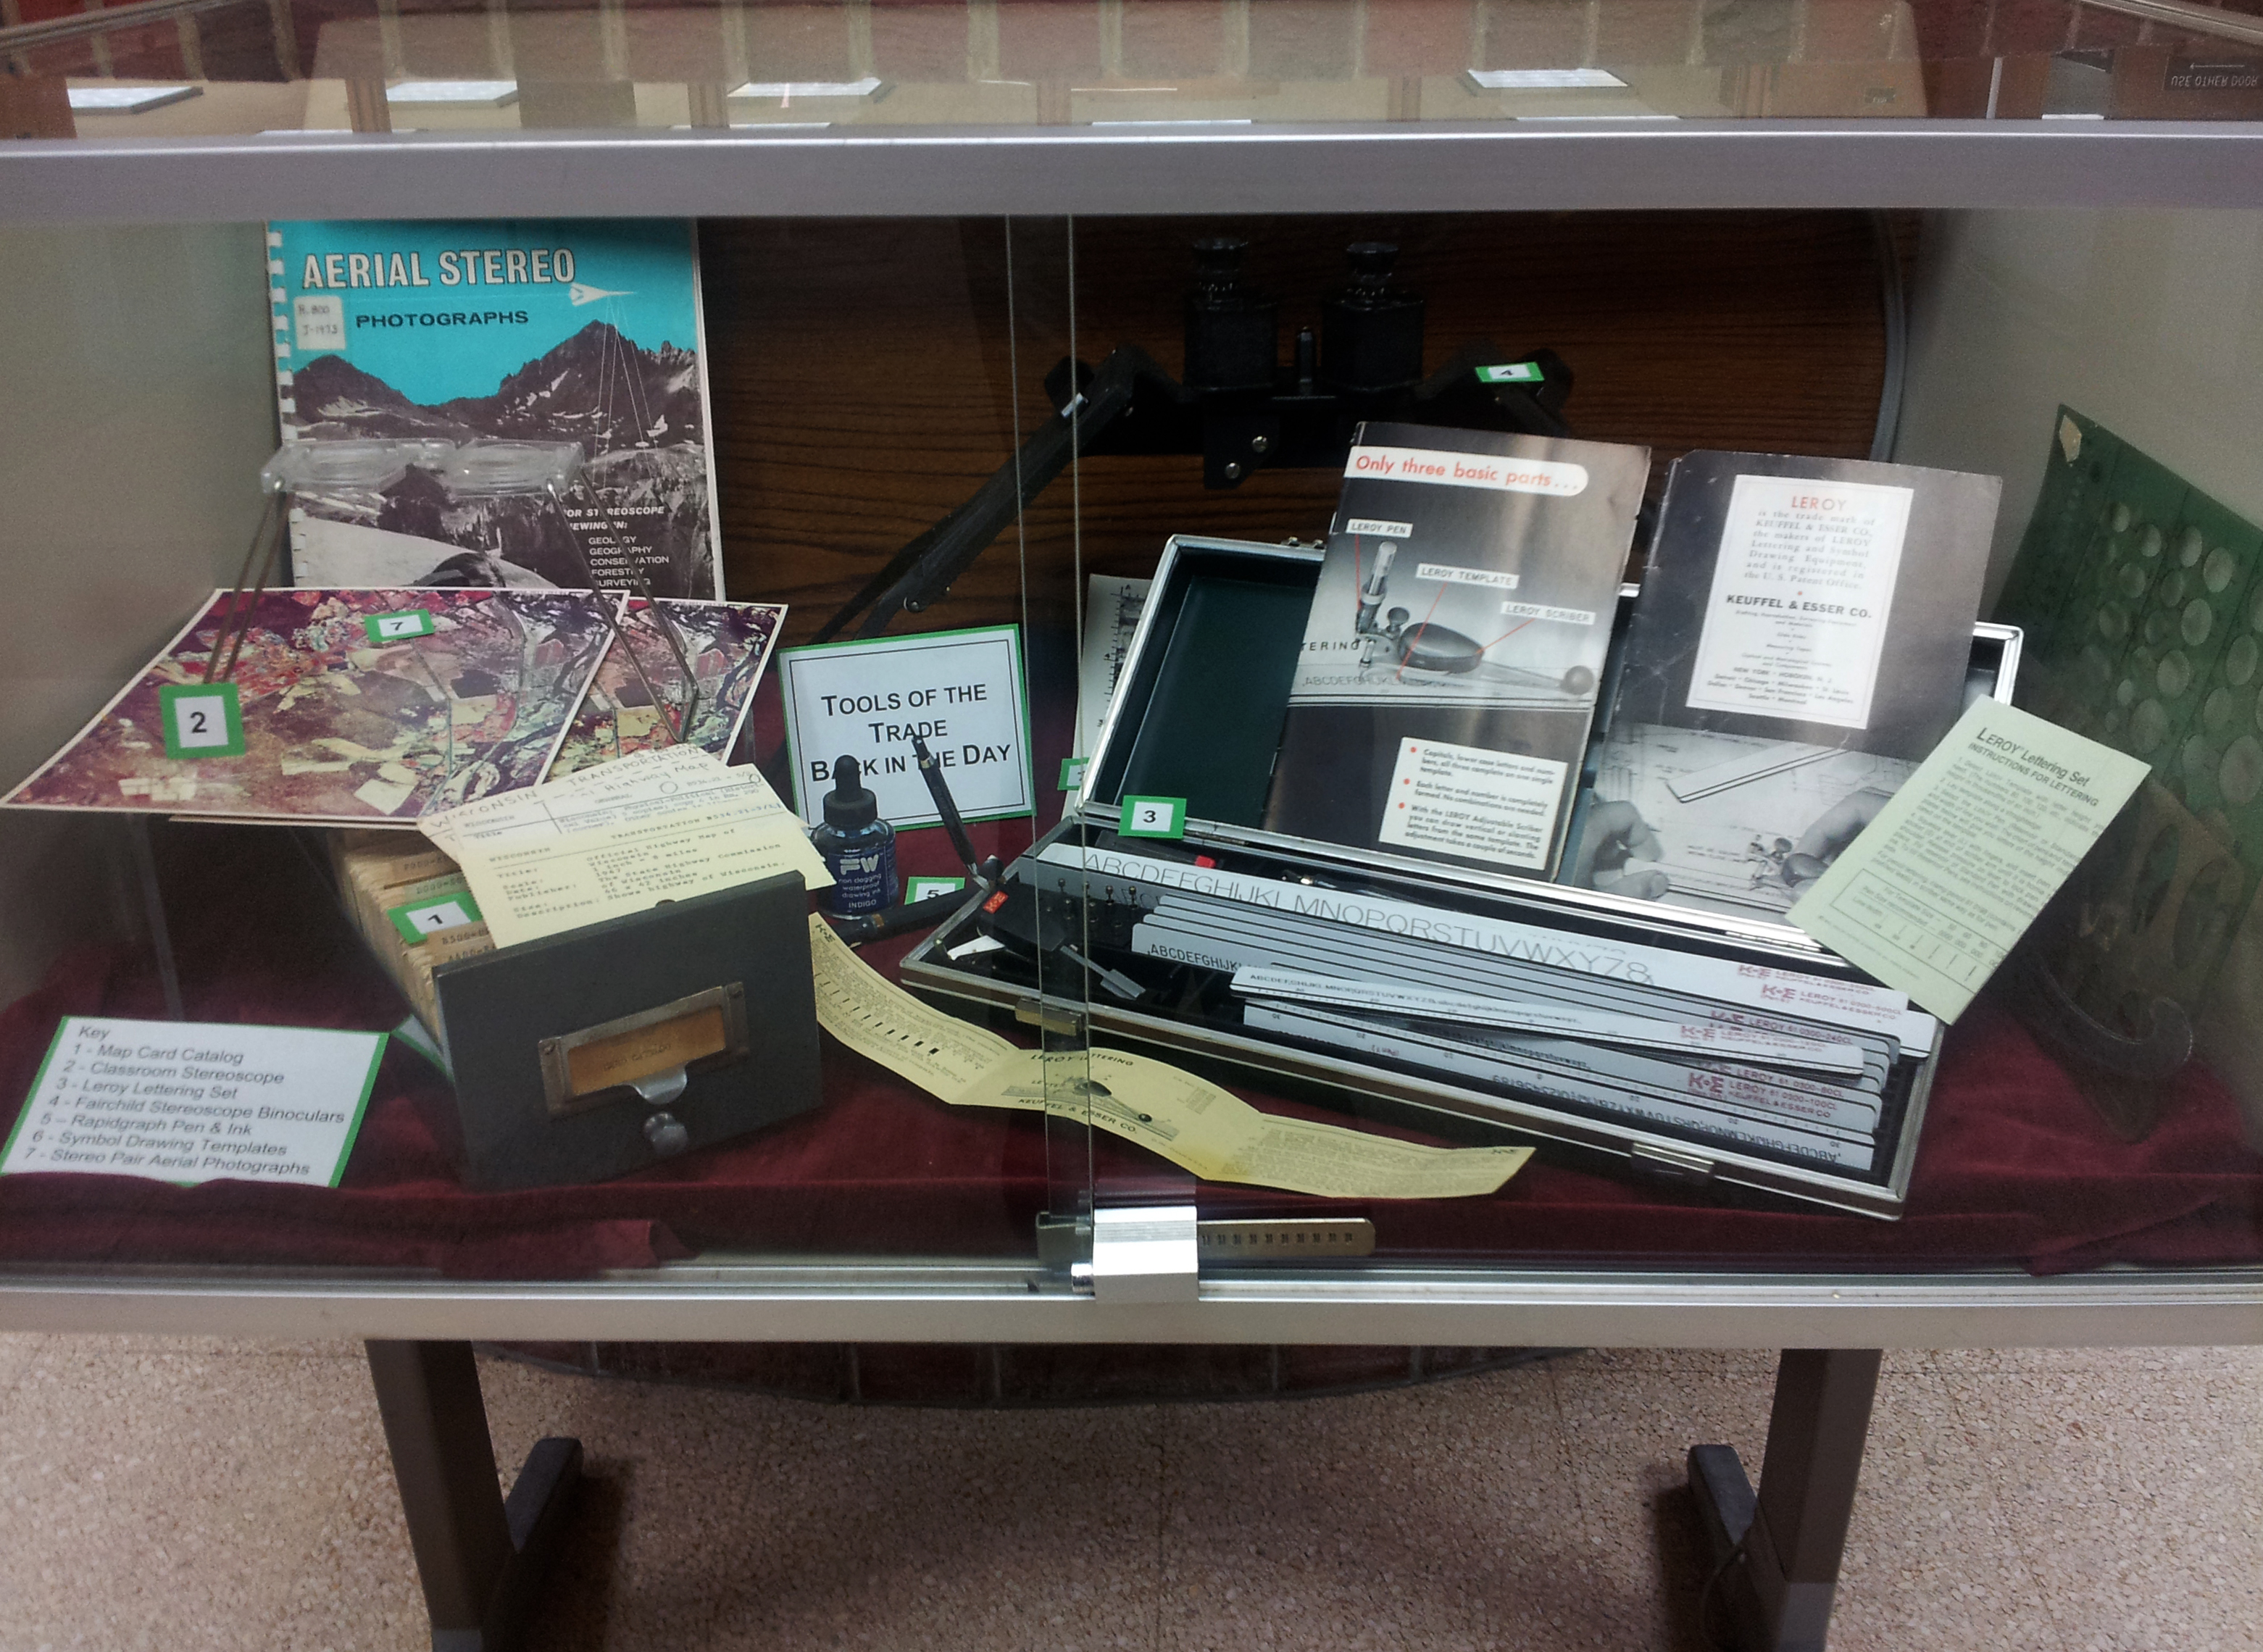
The AGS Library also has a nice exhibit of mid to late 20th century tools used to make a map. Can you identify the Rapidgraph Pen & Ink set, the Leroy Lettering set, the classroom Stereoscope, and the Symbol Drawing Templates?
The most boring map in the world
By Angie Cope
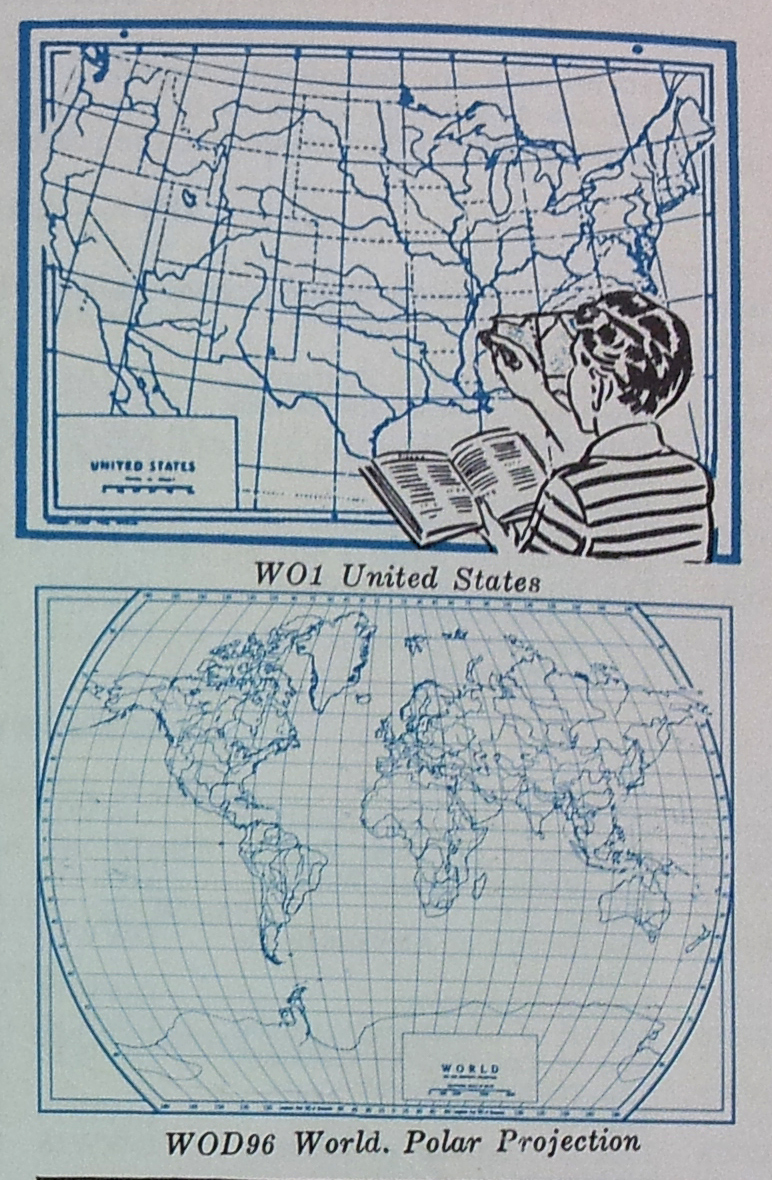
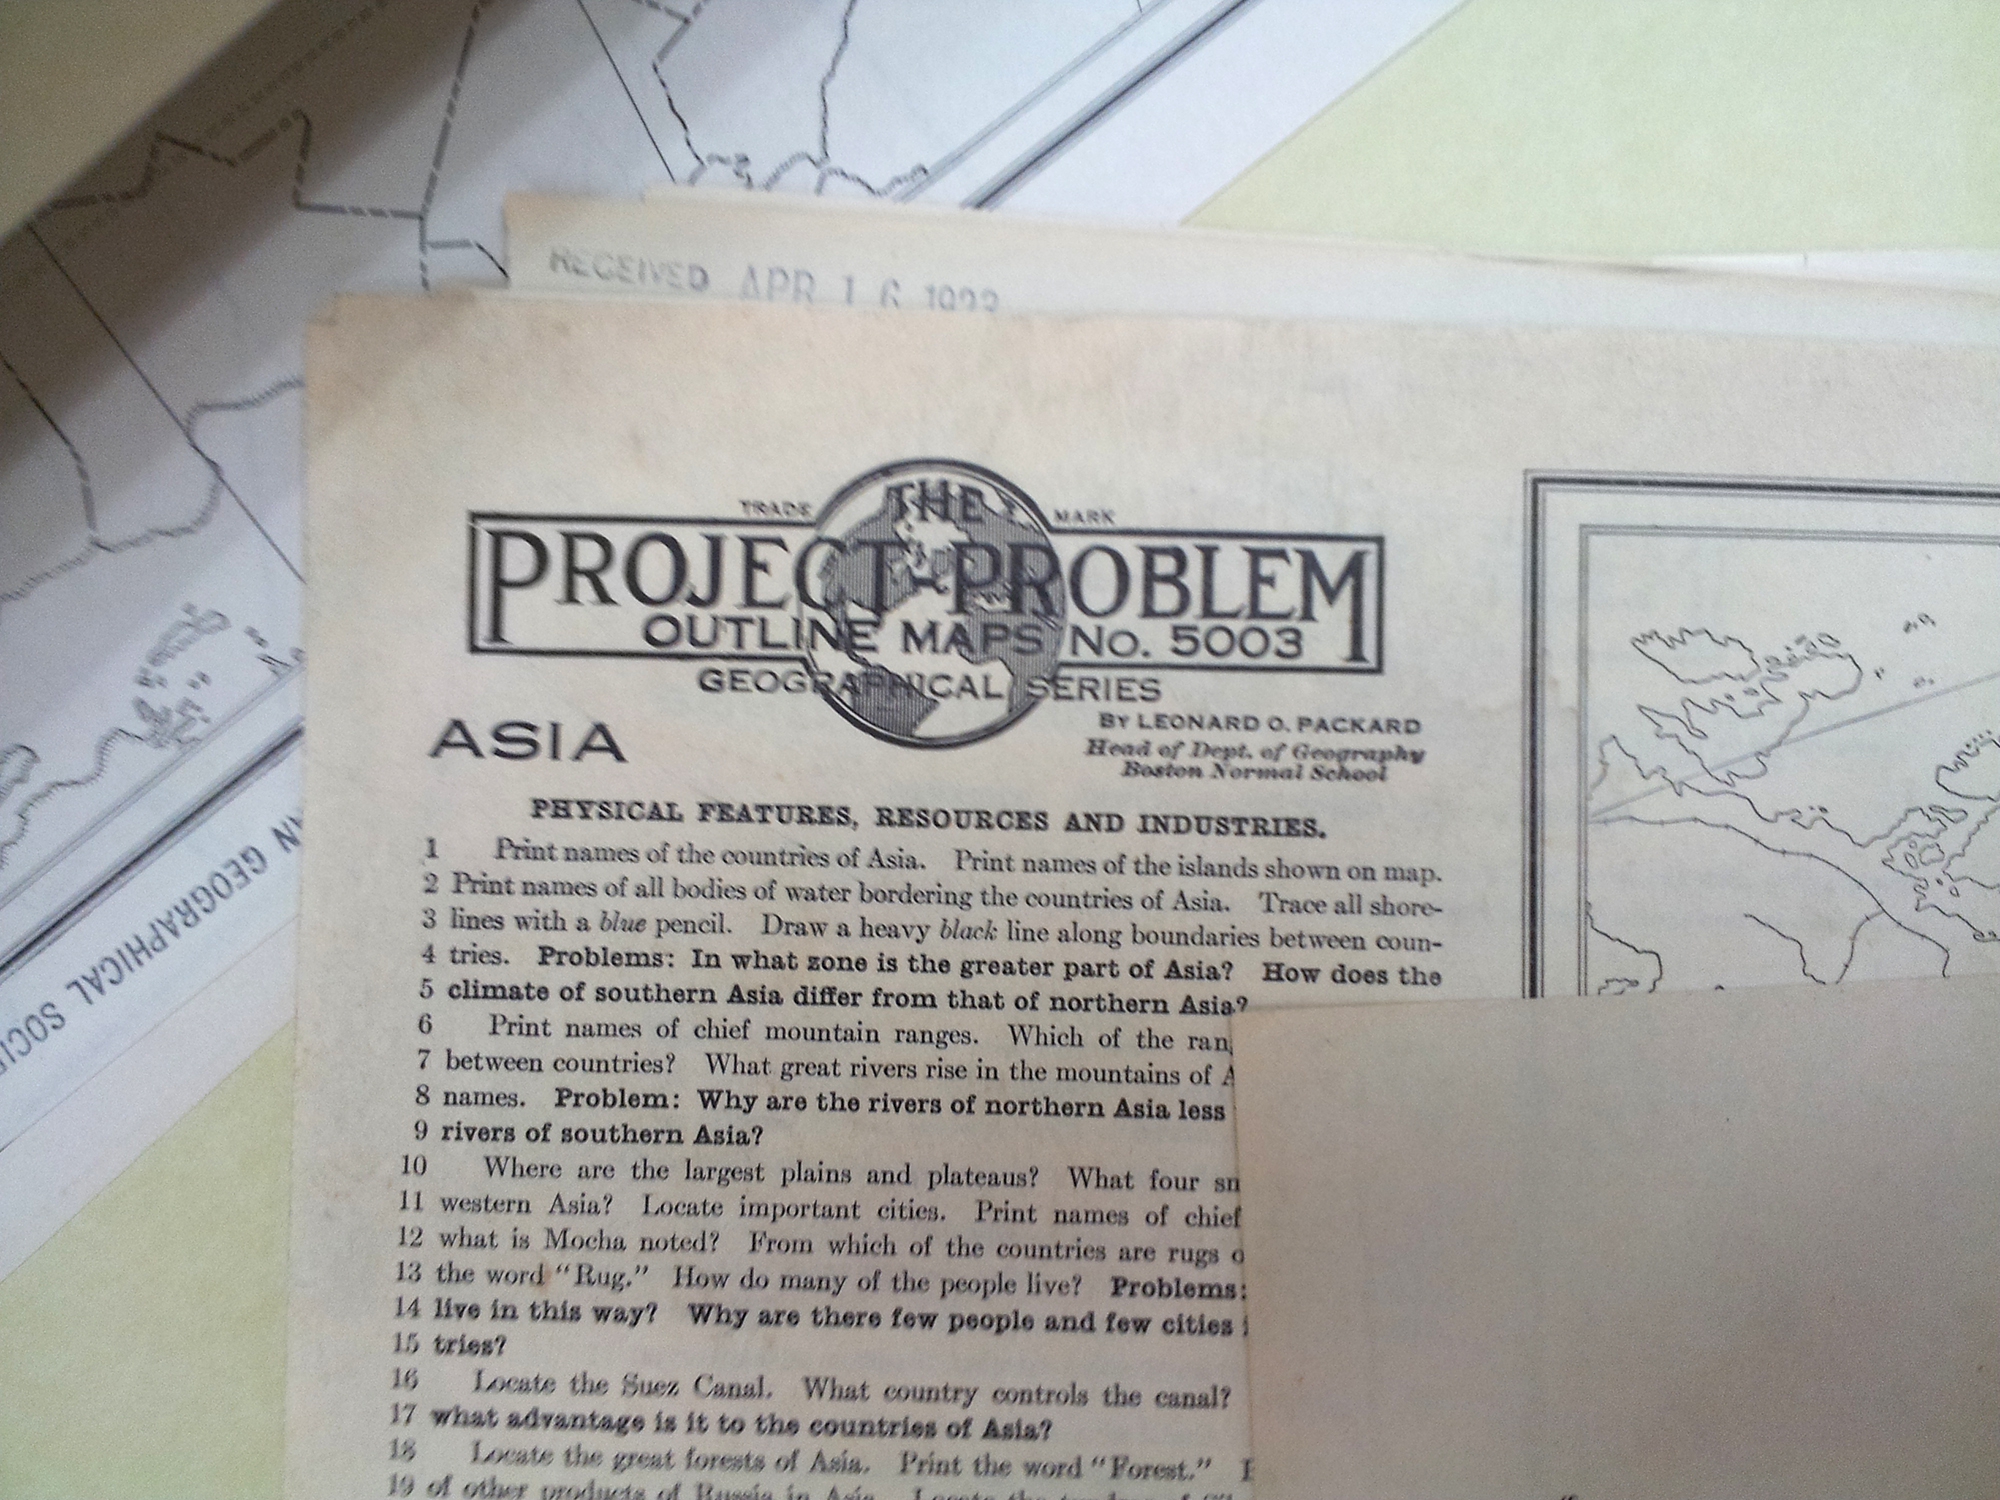
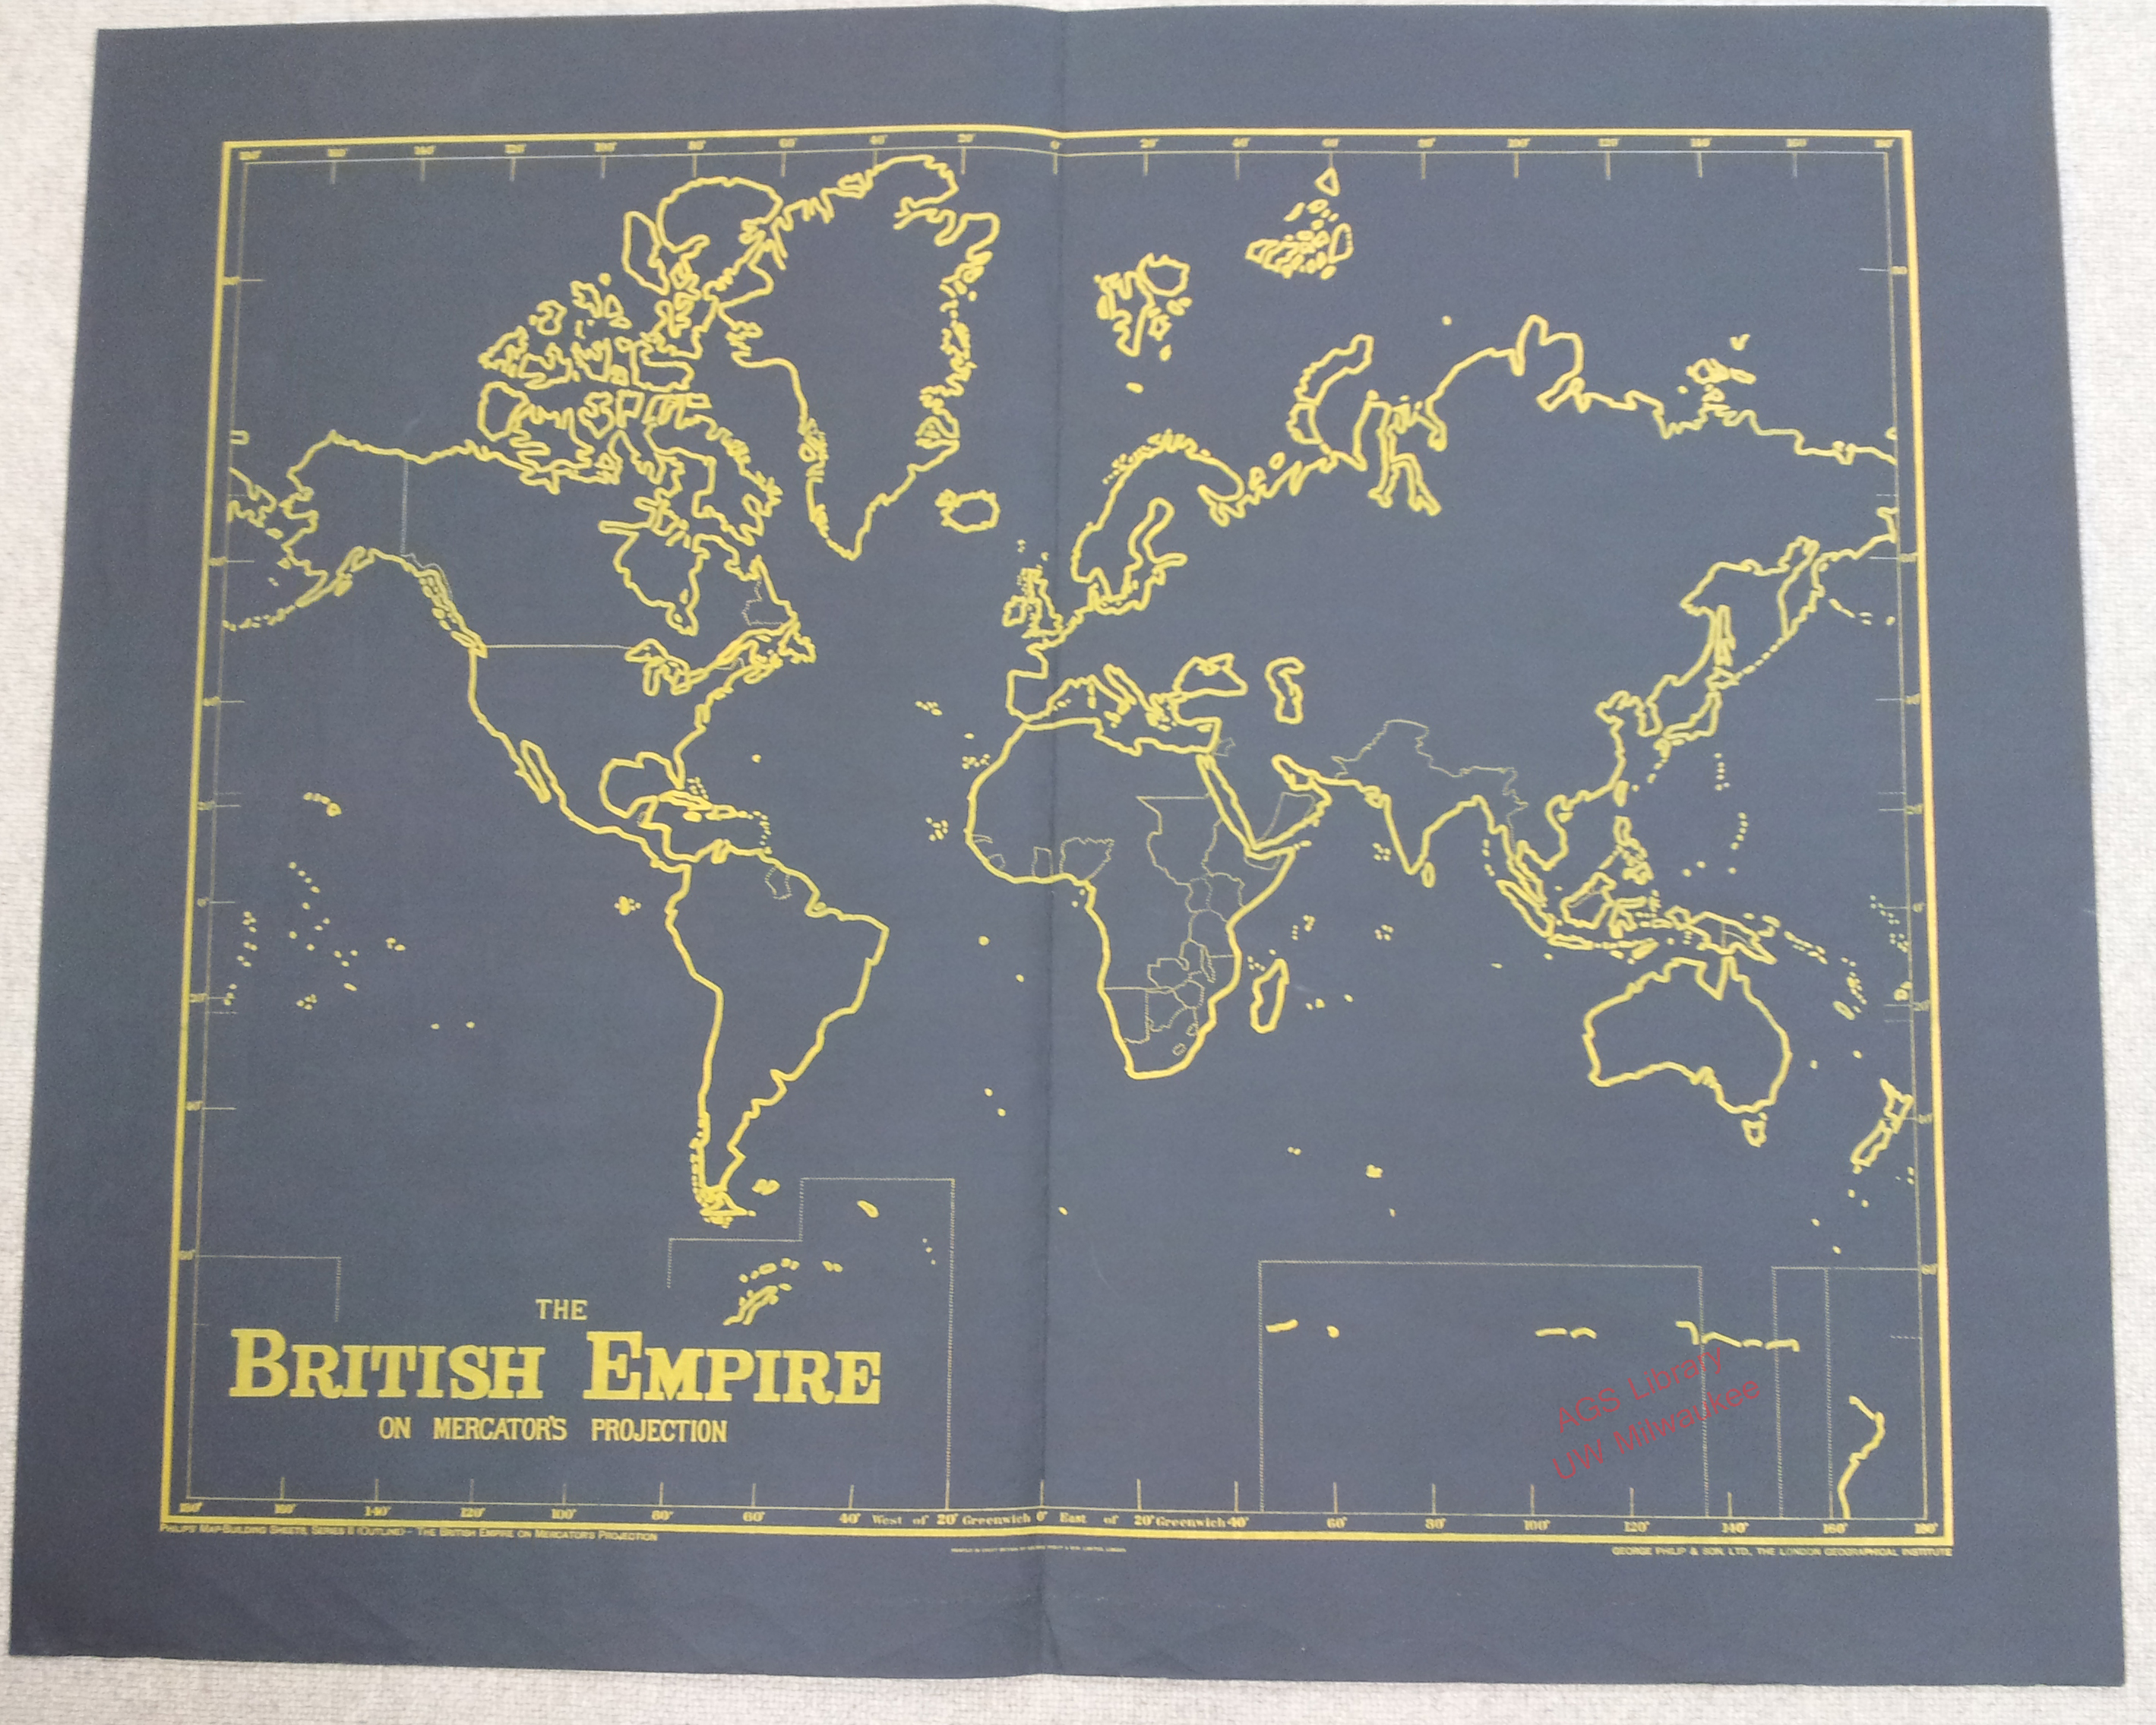
By far, the most boring map in the world has got to be the outline map. Think about it … No pictures to look at, no text to read, no tables of data to substantiate the map. Just lines on a piece of paper.
The outline map is so boring that there is nothing written about it. I spent 15 minutes looking through geographic dictionaries, encyclopedias, cartography books, books on maps and map history and not one book gave a definition of an outline map or even a small mention.
What is there to say about the most boring maps in the world? Well, I have often said it that even the most boring map has an interesting story to tell and this is true even of the outline map.
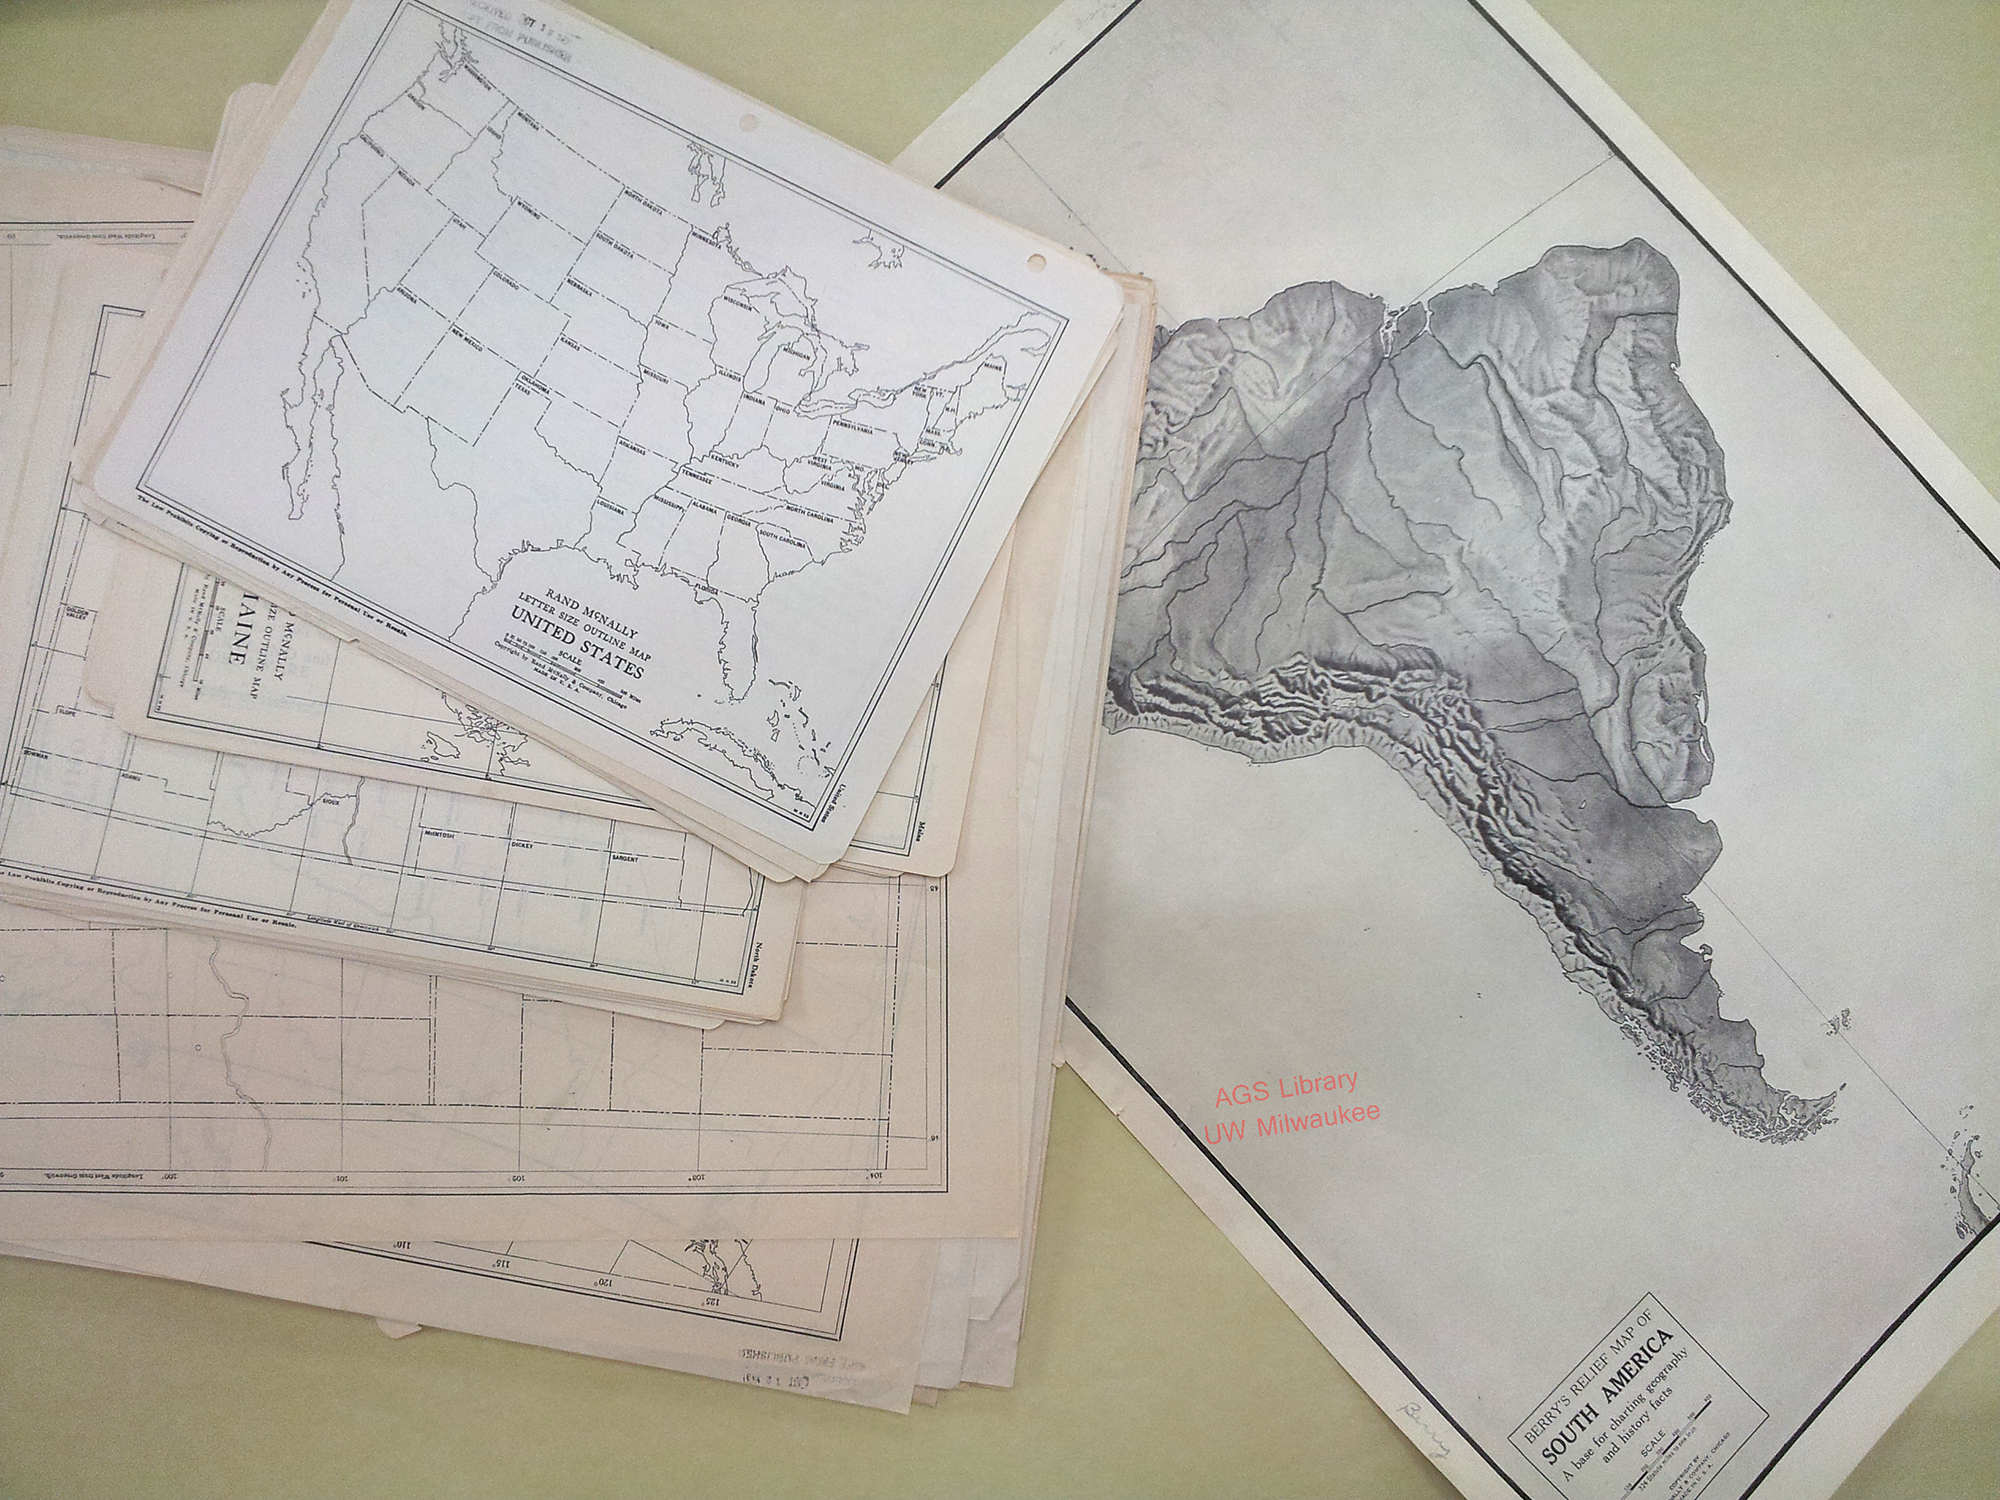
The outline map has been and continues to be the main stay of geographic education. Every student in the United States has been given many outline maps and told to identify boundaries, rivers, capitals and more. Do a search online and there are hundreds and thousands of outline maps available. But still, very little written about them.
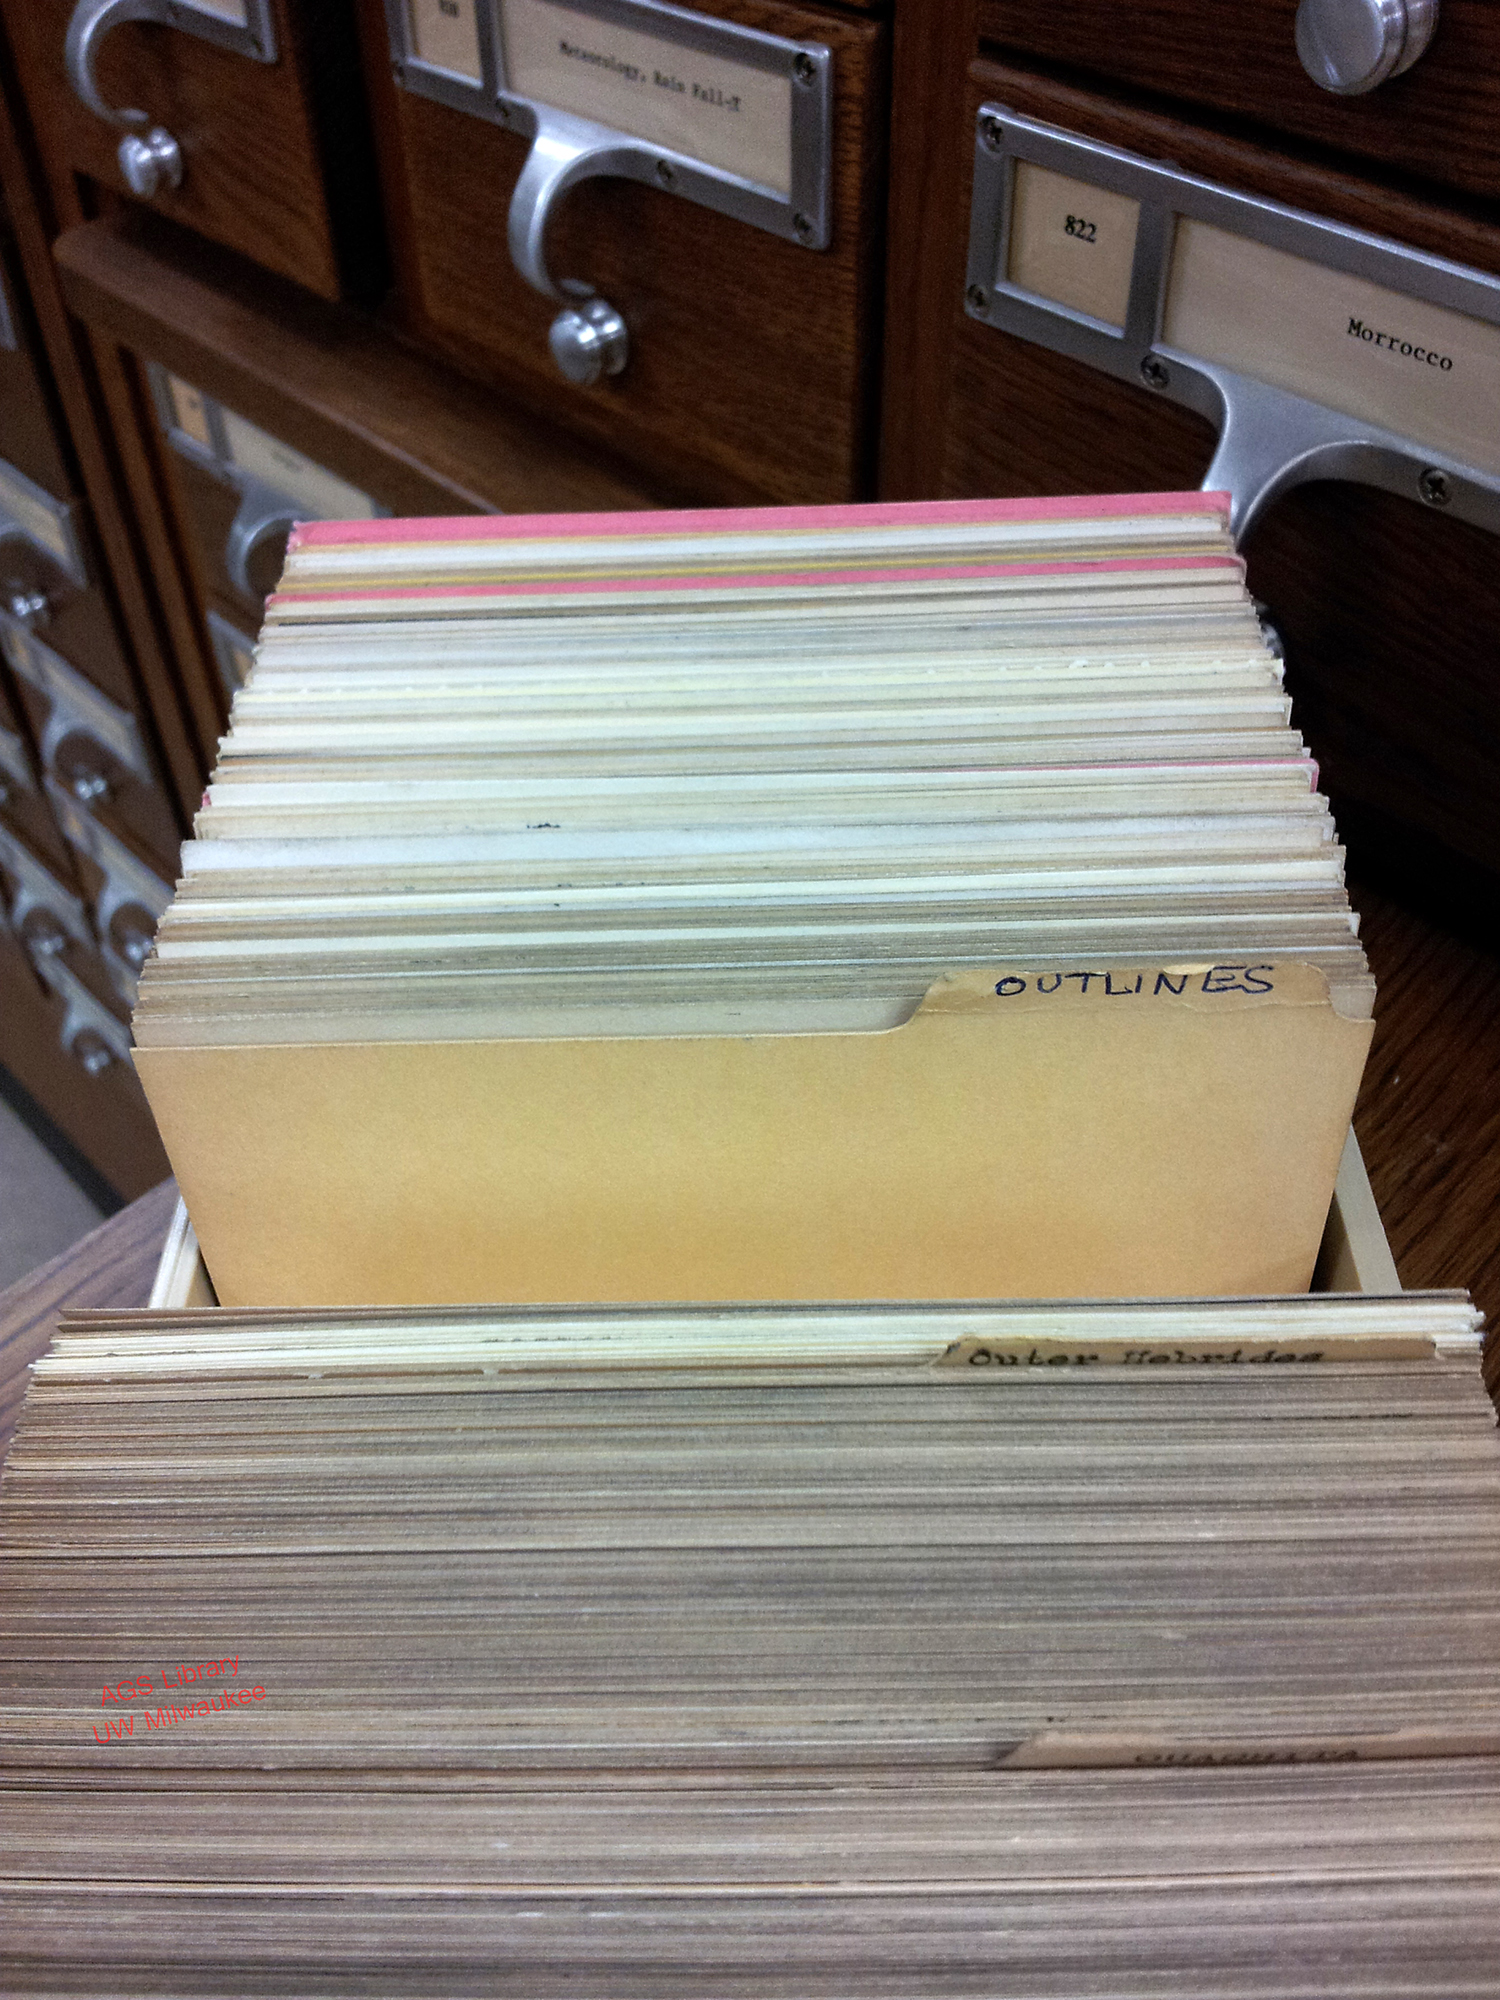
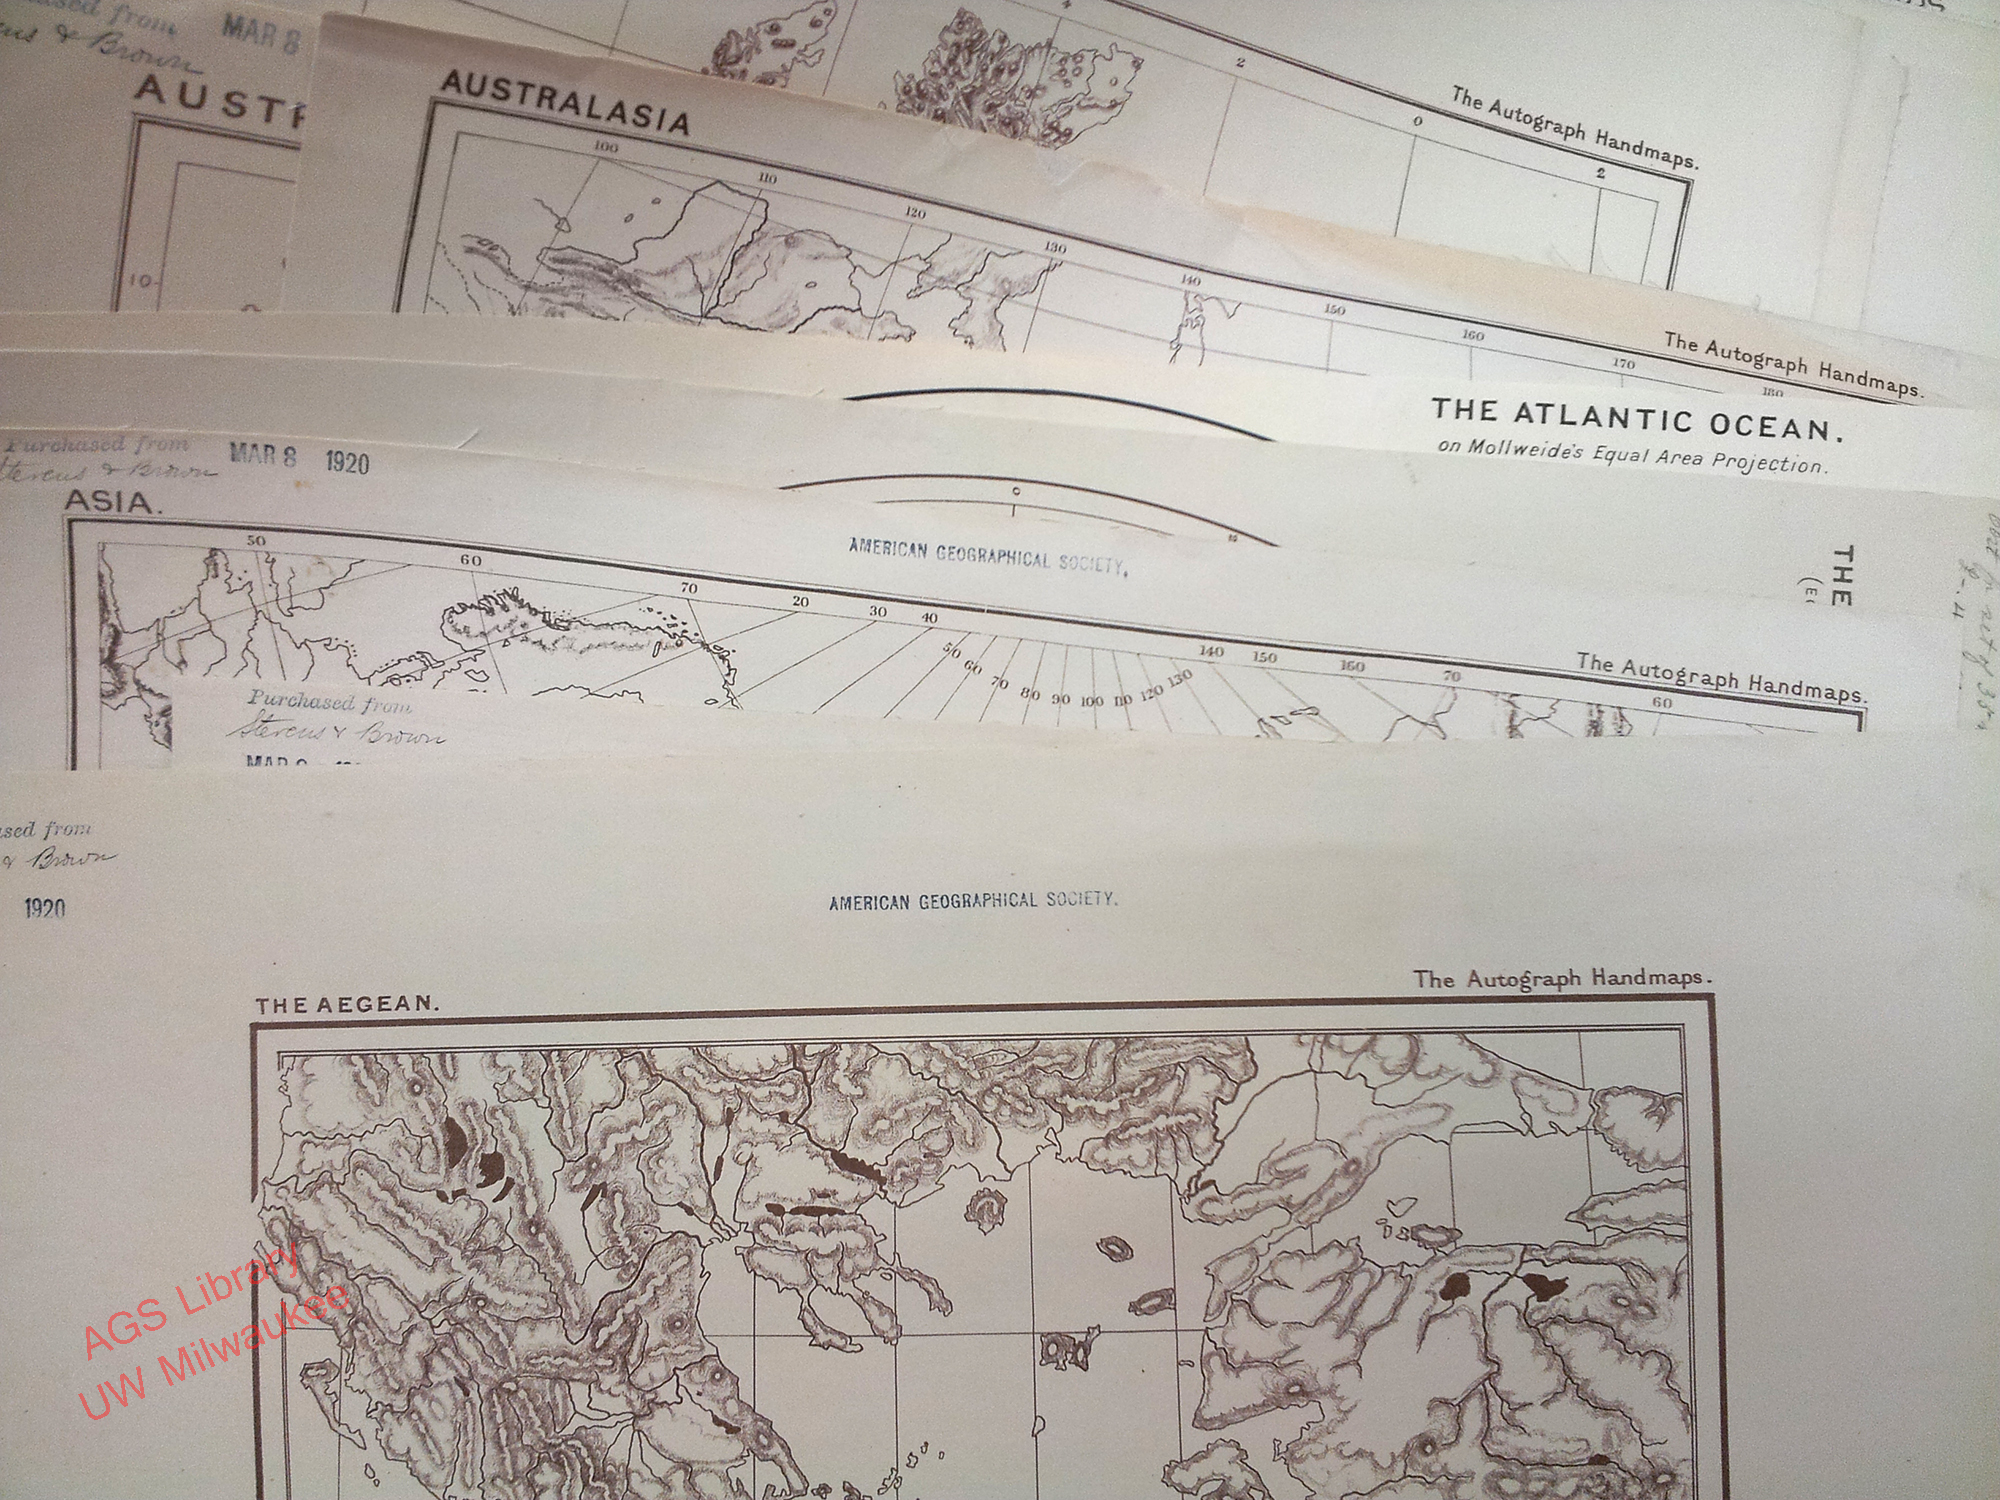
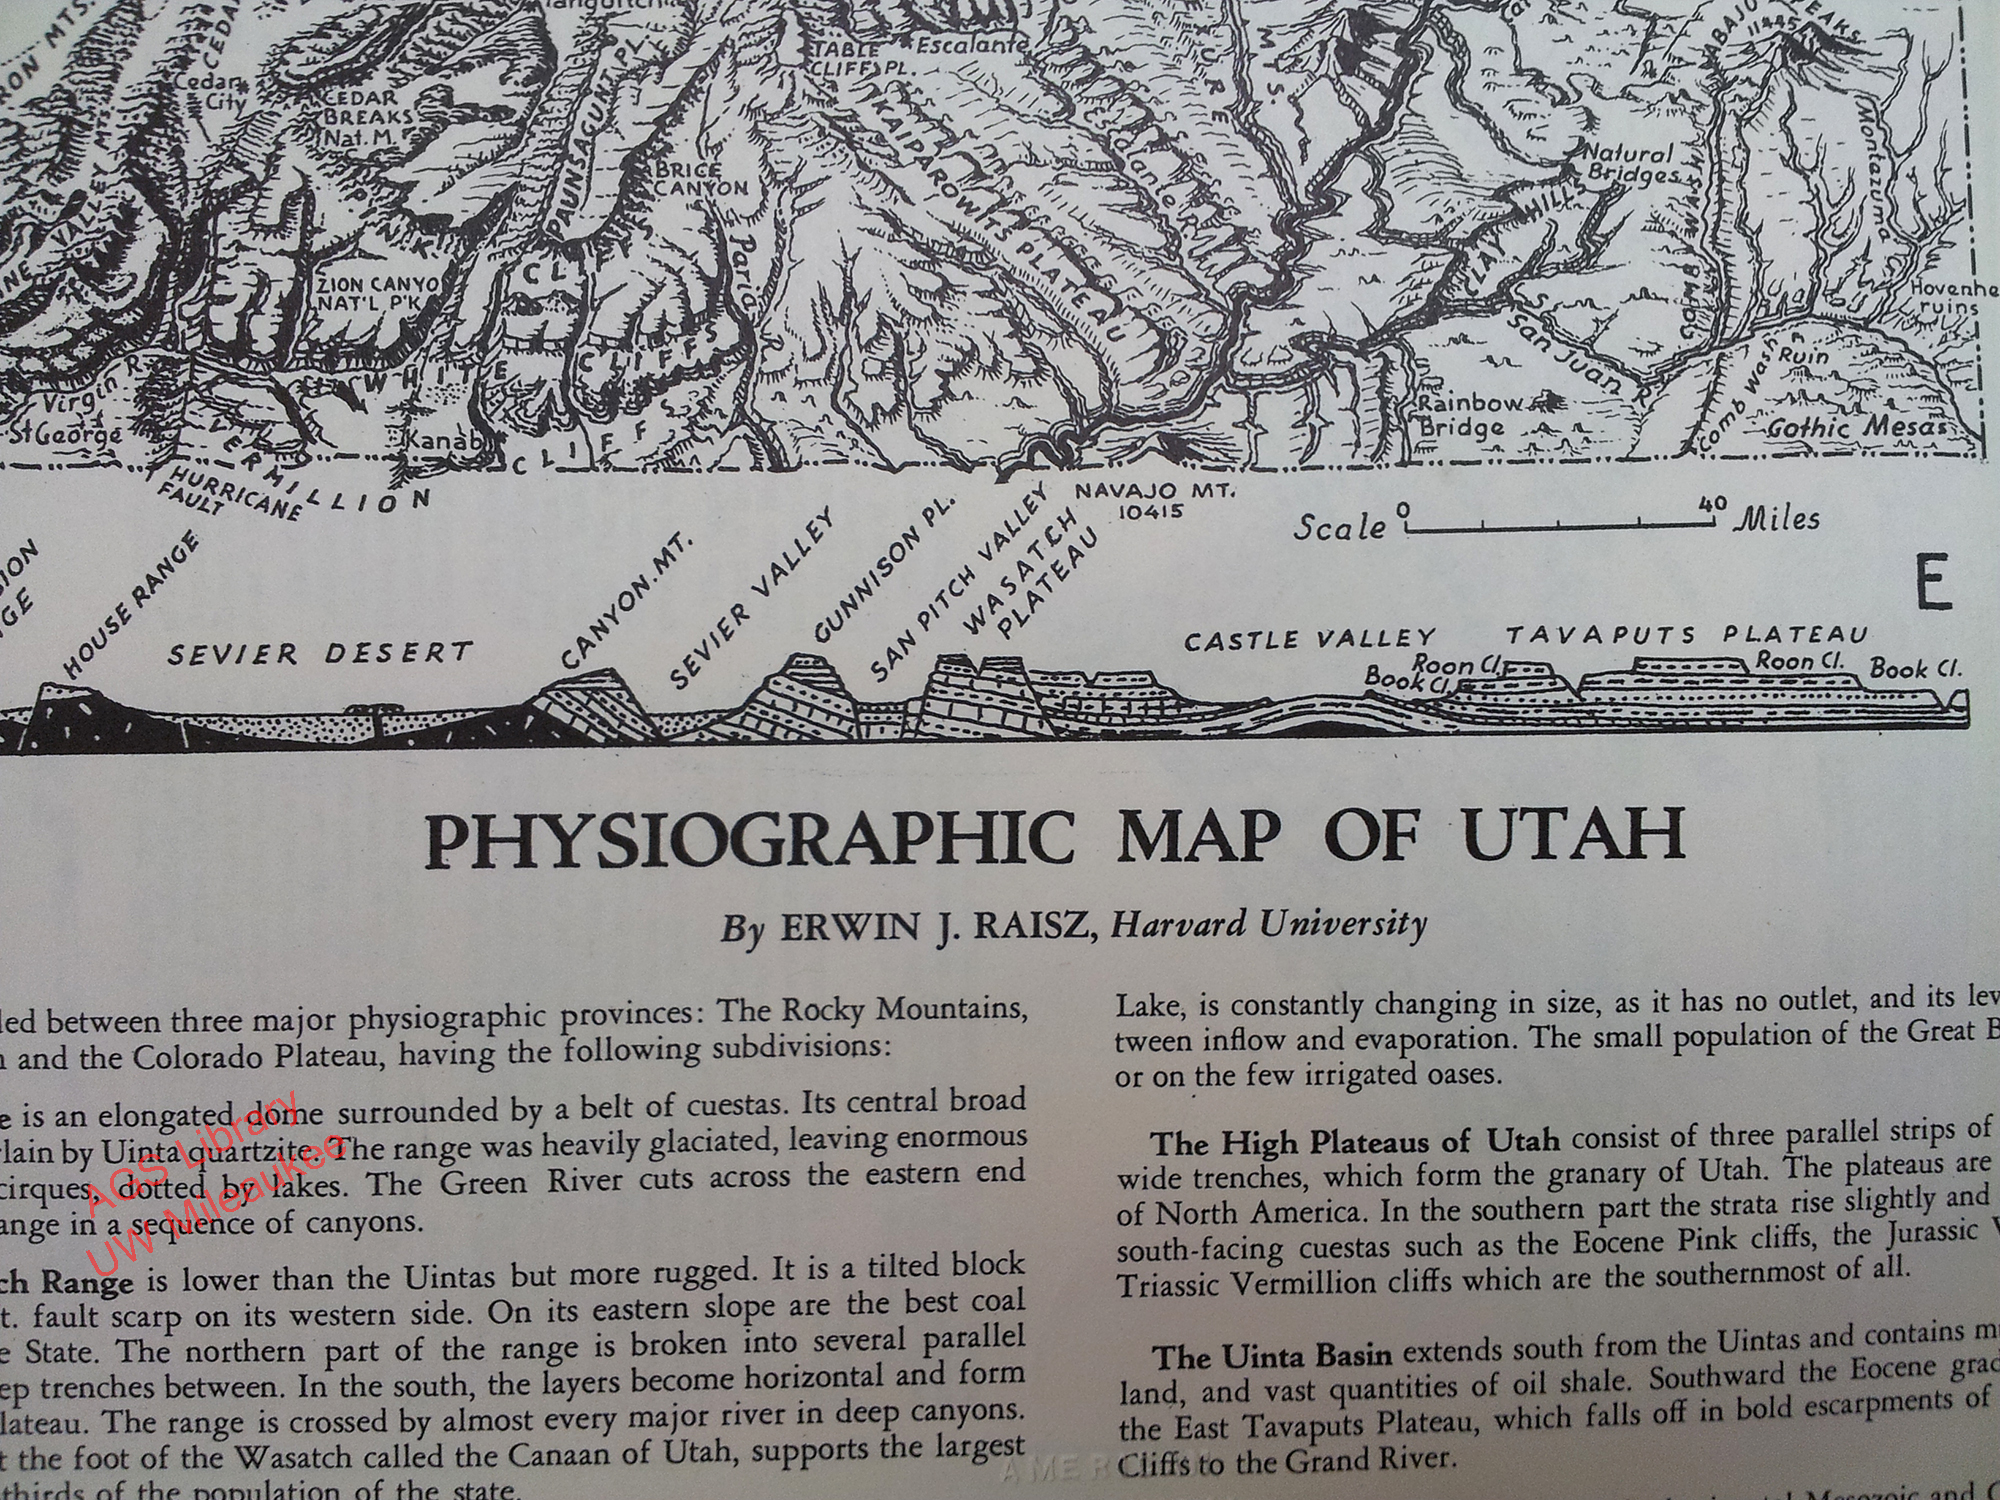
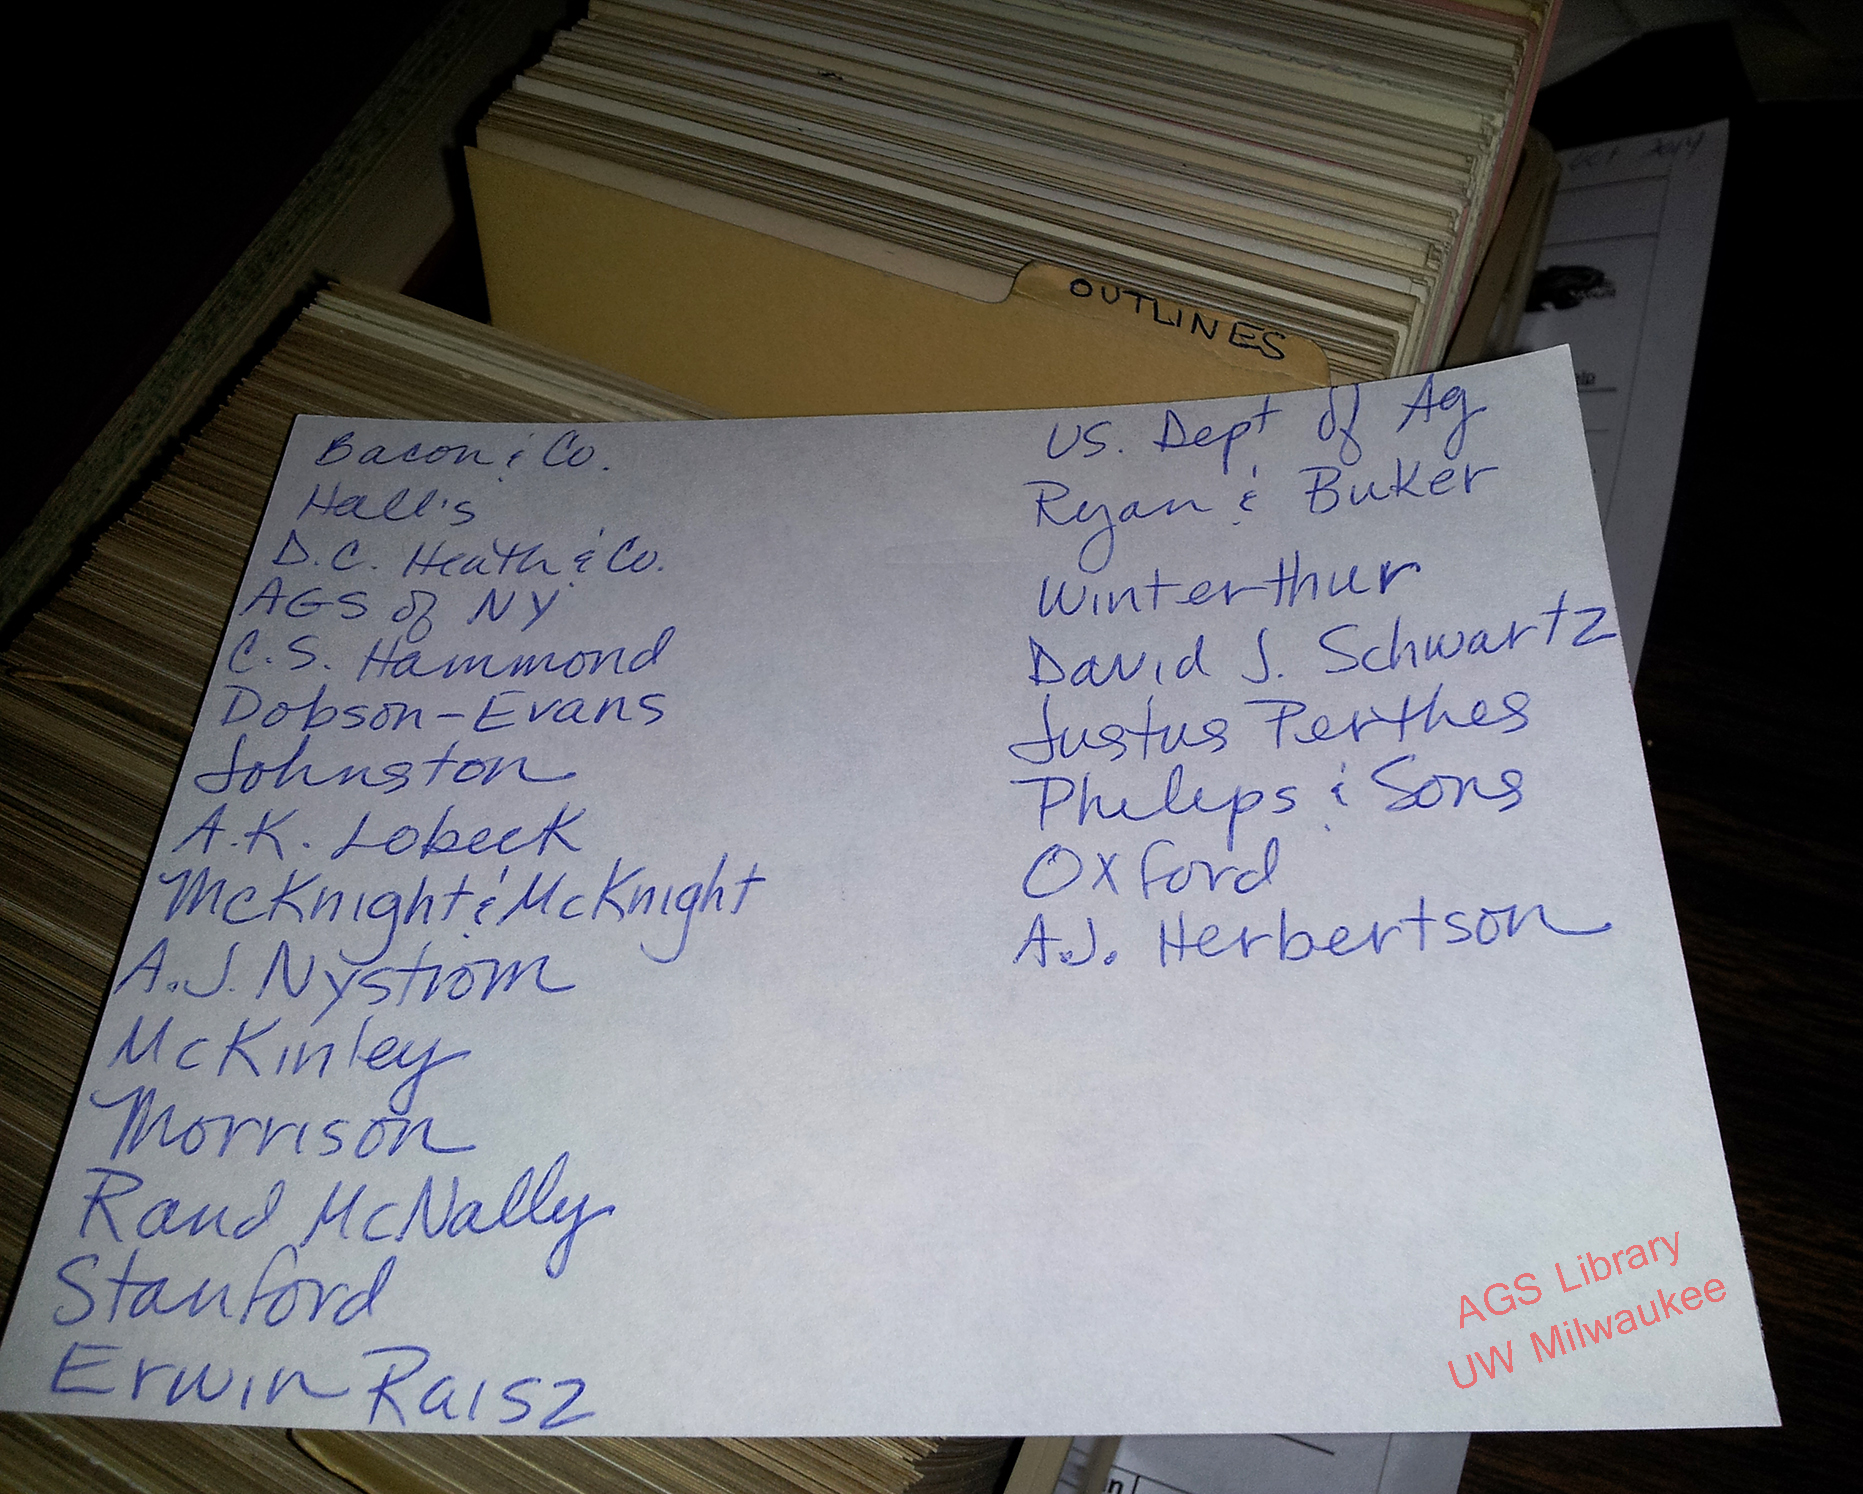
At the AGS Library, we have 9 drawers full of outline maps by publishers such as C.S. Hammond, Justus Perthes, George Philip & Sons, A.J. Nystrom, U.S. Army Map Service, the American Geographical Society of New York, Erwin Raisz and Edward Stanford to name a few.
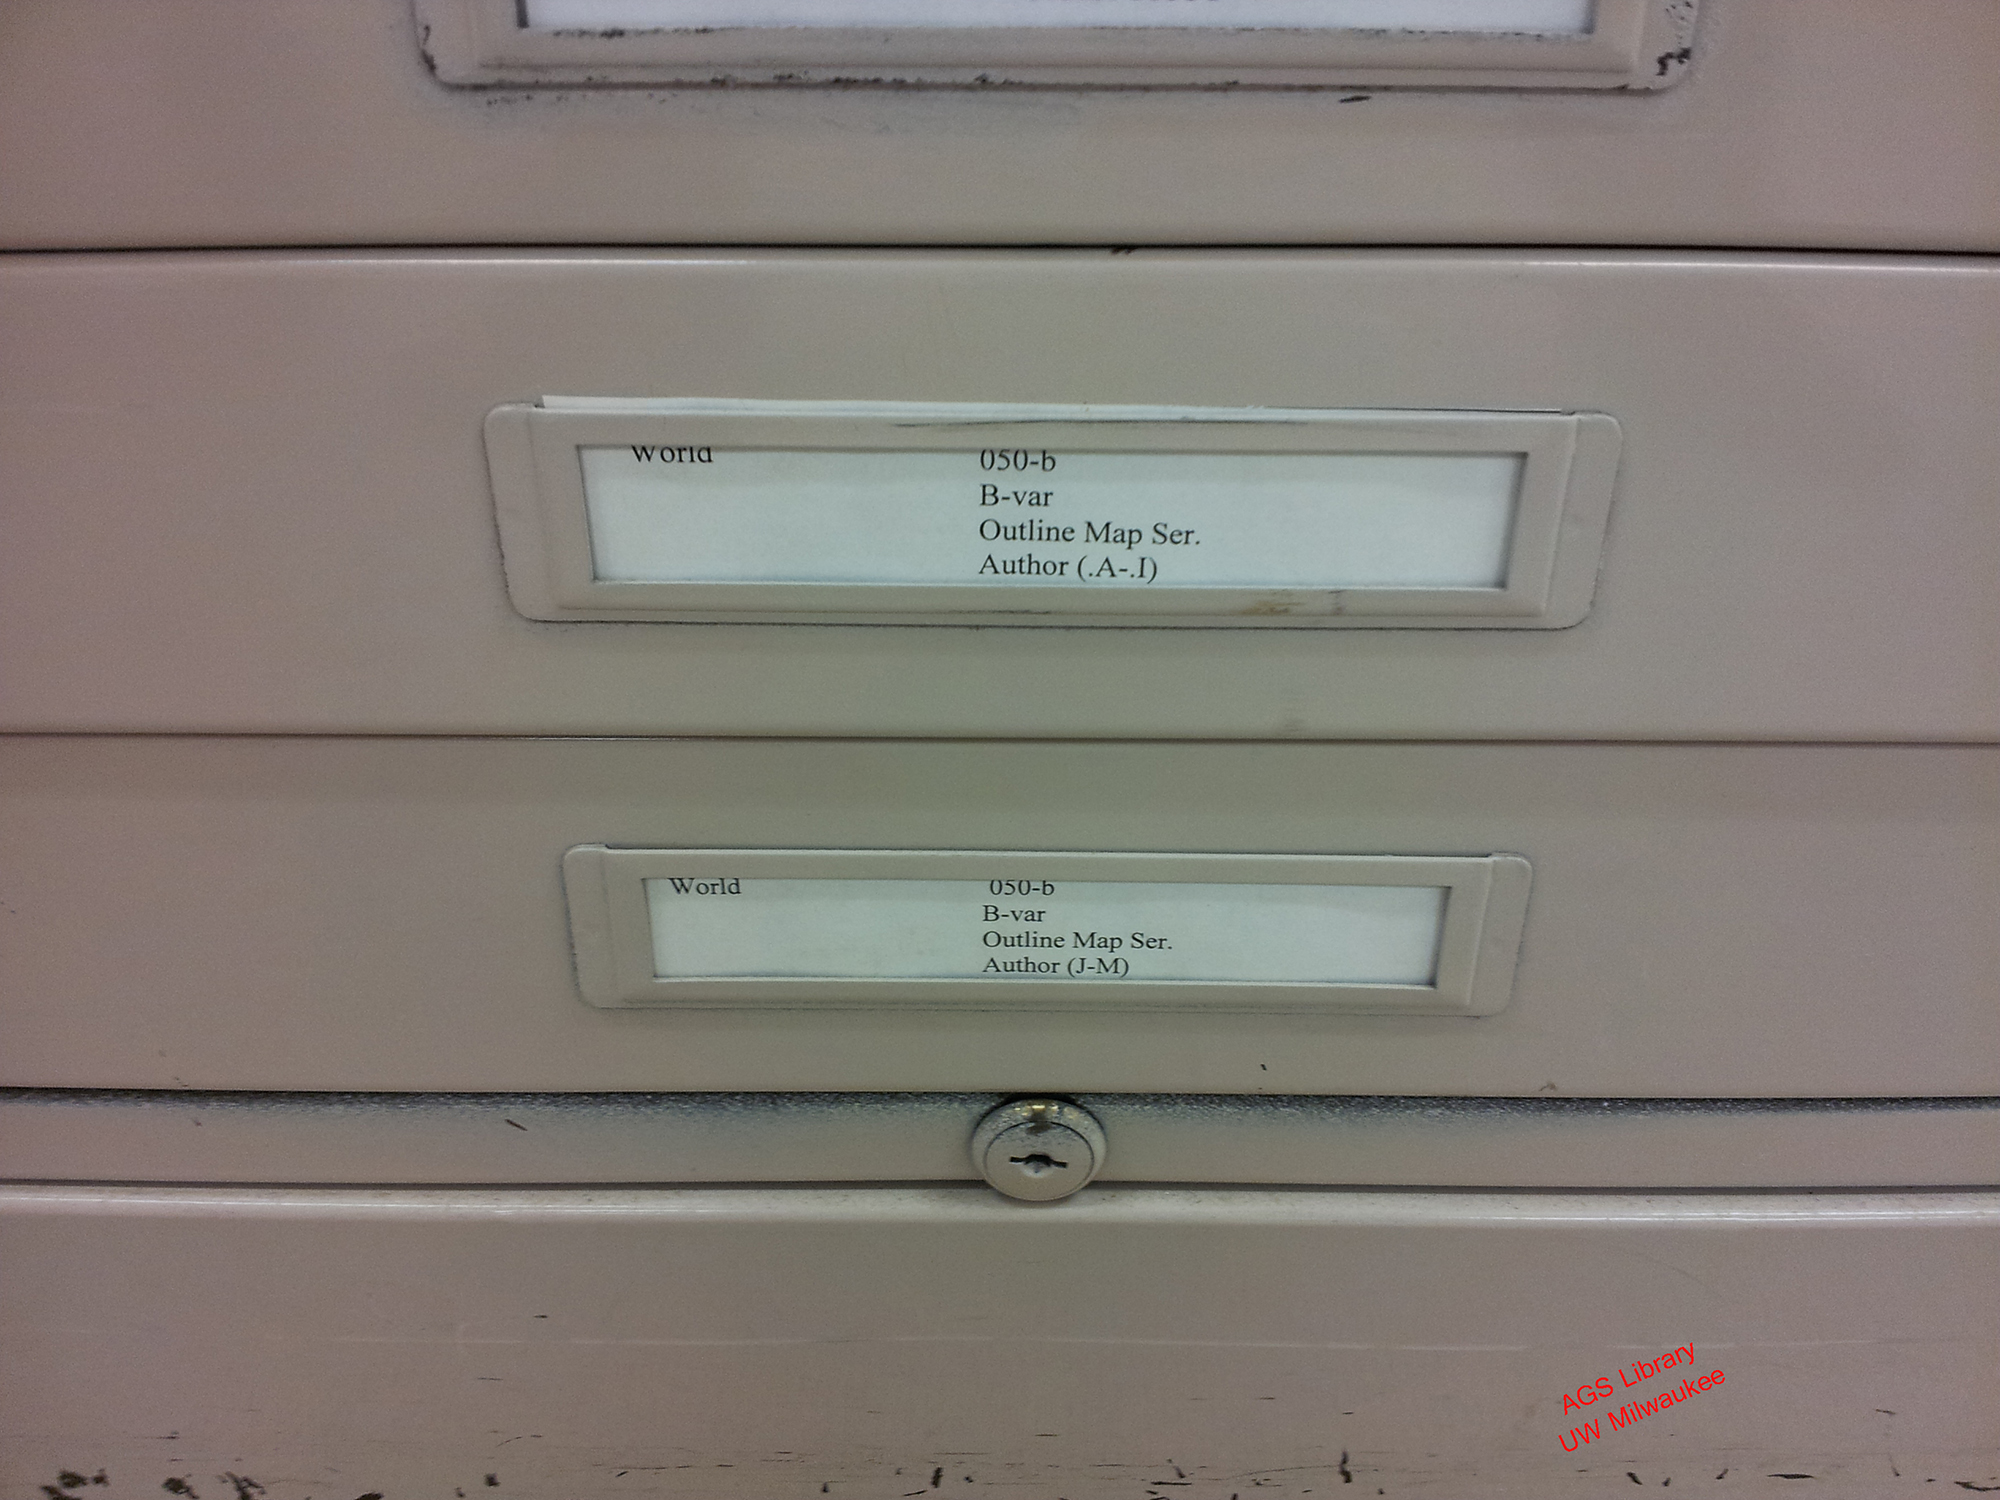
The AGS of New York had a strong tradition of supporting geographic education in the United States and the library reflects that tradition. There are 3 1/2 inches of card catalog cards devoted to the outline map …
______________________________________________________________________
As the inaugural blog for the AGS Library blog, I hope you haven’t been bored to death by boring maps. Every map holds a story – even the boring outline map. Check back for more blogs from the AGSL staff – hopefully less boring.
- ← Previous
- 1
- …
- 4
- 5
