Brendan Dooley
Maps at the Bottom of the Ocean
By Brendan Dooley
As March marks International Women’s History Month, it seems an appropriate time to reflect on the contributions of AGS member Marie Tharp (1920-2006). Before Tharp’s research and attention to detail in plotting soundings from colleagues, we might still be in the dark regarding the topography of the ocean floor, plate tectonics and a formalized idea of Pangea.
Tharp was a multi-talented researcher and true renaissance learner who had multiple minors, majors and graduate degree paths under her belt, including being an accomplished drafter which led to her work in mapping the oceans’ floors.
This barely scratches the surface of her accomplishments though, and you can learn much more about her here at a “Washington Post” story about her life, through books at every level in the AGSL circulating collection (like Theater of the World: The Maps That Made History, Ocean Speaks, and Women in American Cartography), some of her maps digitized in the AGSL collection here and more.
The AGSL is open Monday-Friday, 9 a.m. to 4:30 p.m., on the third floor of the Golda Meir Library at UWM’s campus.
Re-discovering Seneca Village
By Brendan Dooley
It was almost two centuries ago when New York City’s first Black property owners began purchasing lots in what is now part of Central Park. Starting in 1825, Andrew Young and Epiphany Davis (both Black) and the African Methodist Episcopal Zion Church, bought the initial lots from John and Elizabeth Whitehead that would become Seneca Village (in what is now Central Park West).
The 5-acre area would become an integrated settlement of about 260 Black, Native American, Irish and German immigrant residents, with 2-3 churches, a school and more. Enter eminent domain and wealthier residents’ aspirations for a grand park to rival those of some European capitals. Central Park was an authorized entity by 1853 and land owners were starting to be meagerly compensated and evicted a few years later.
Cartographer Egbert Viele illustrated several maps of NYC, as well as Central Park in its planning stages. You can see where Seneca Village was, though it is not labeled as such. Newspapers of the time belittled residents there as “squatters” and worse in the apparent hopes of moving common will in favor of the “greater good” a park would serve. (The Seneca Village Irish in particular were said to be living in “shanties” with their “goats and hogs.”)
A renewed interest in the nearly lost history of Seneca Village has been ongoing since around the 1990s, including exhibits from the New York Historical Society. Some minor excavations of sites in the early 2000s located some small artifacts indicative of domestic living and foundational stonework of possibly one of the churches. You can check out some of these maps to look at more about Seneca Village, or learn more on the history and development of Central Park and NYC, in the AGSL Monday-Friday, 9 a.m. to 4:30 p.m. or anytime through our digital collections here.
Other links about Seneca Village:
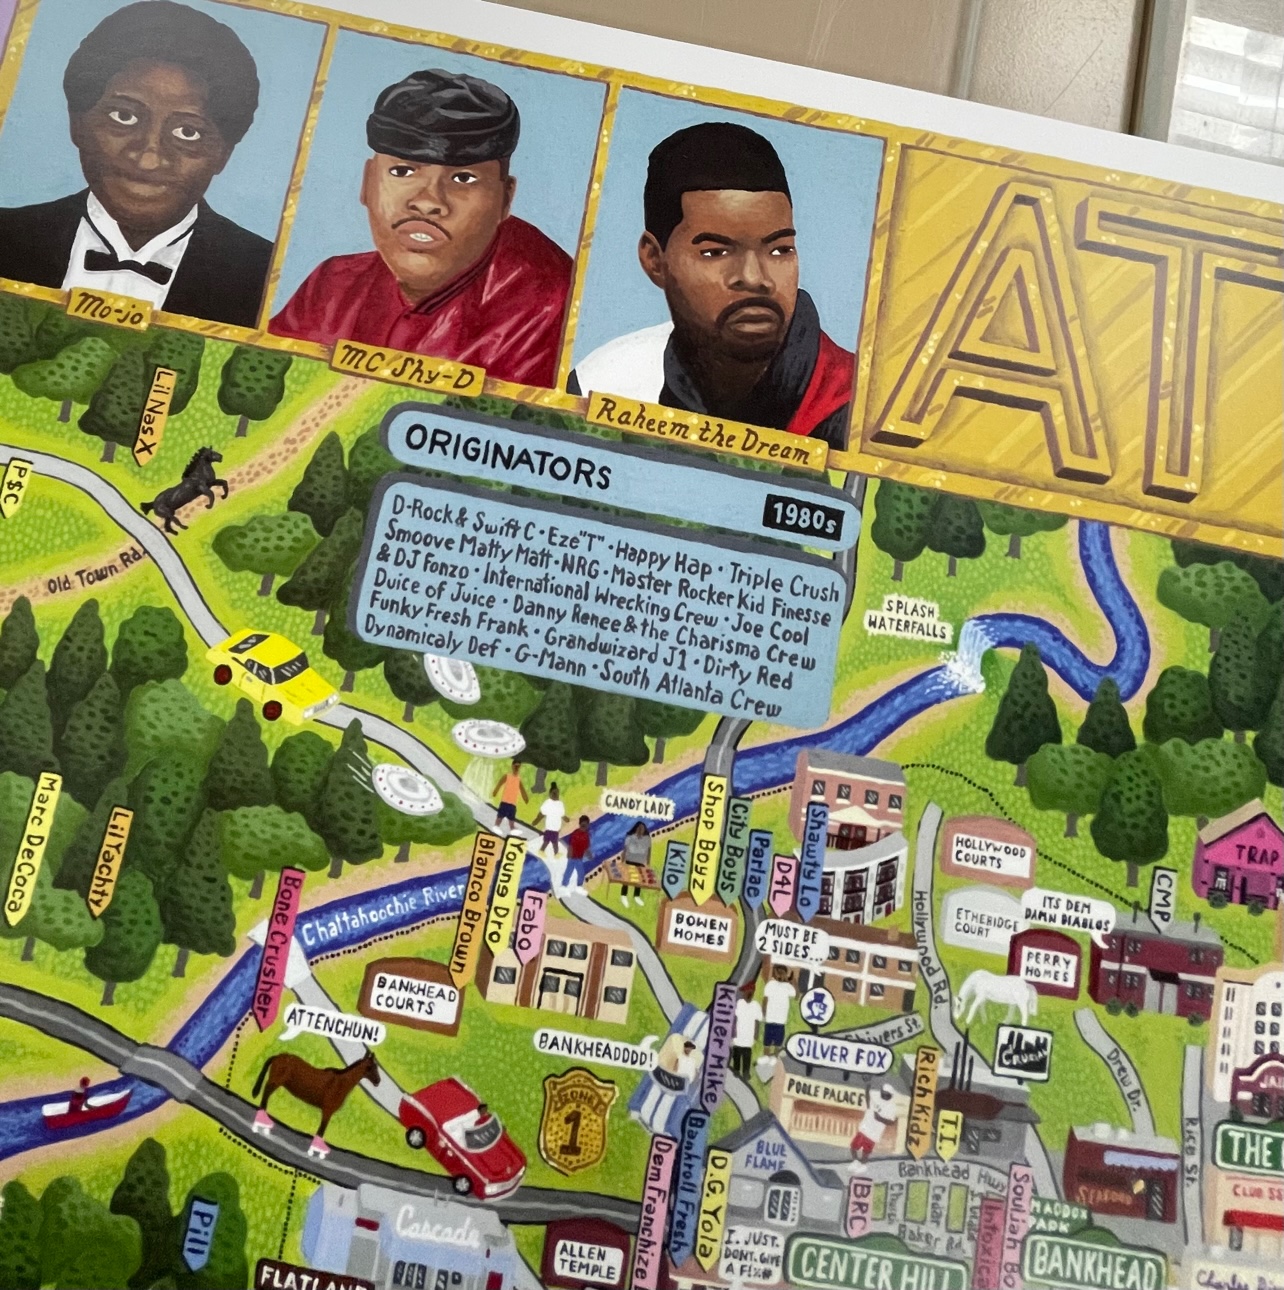
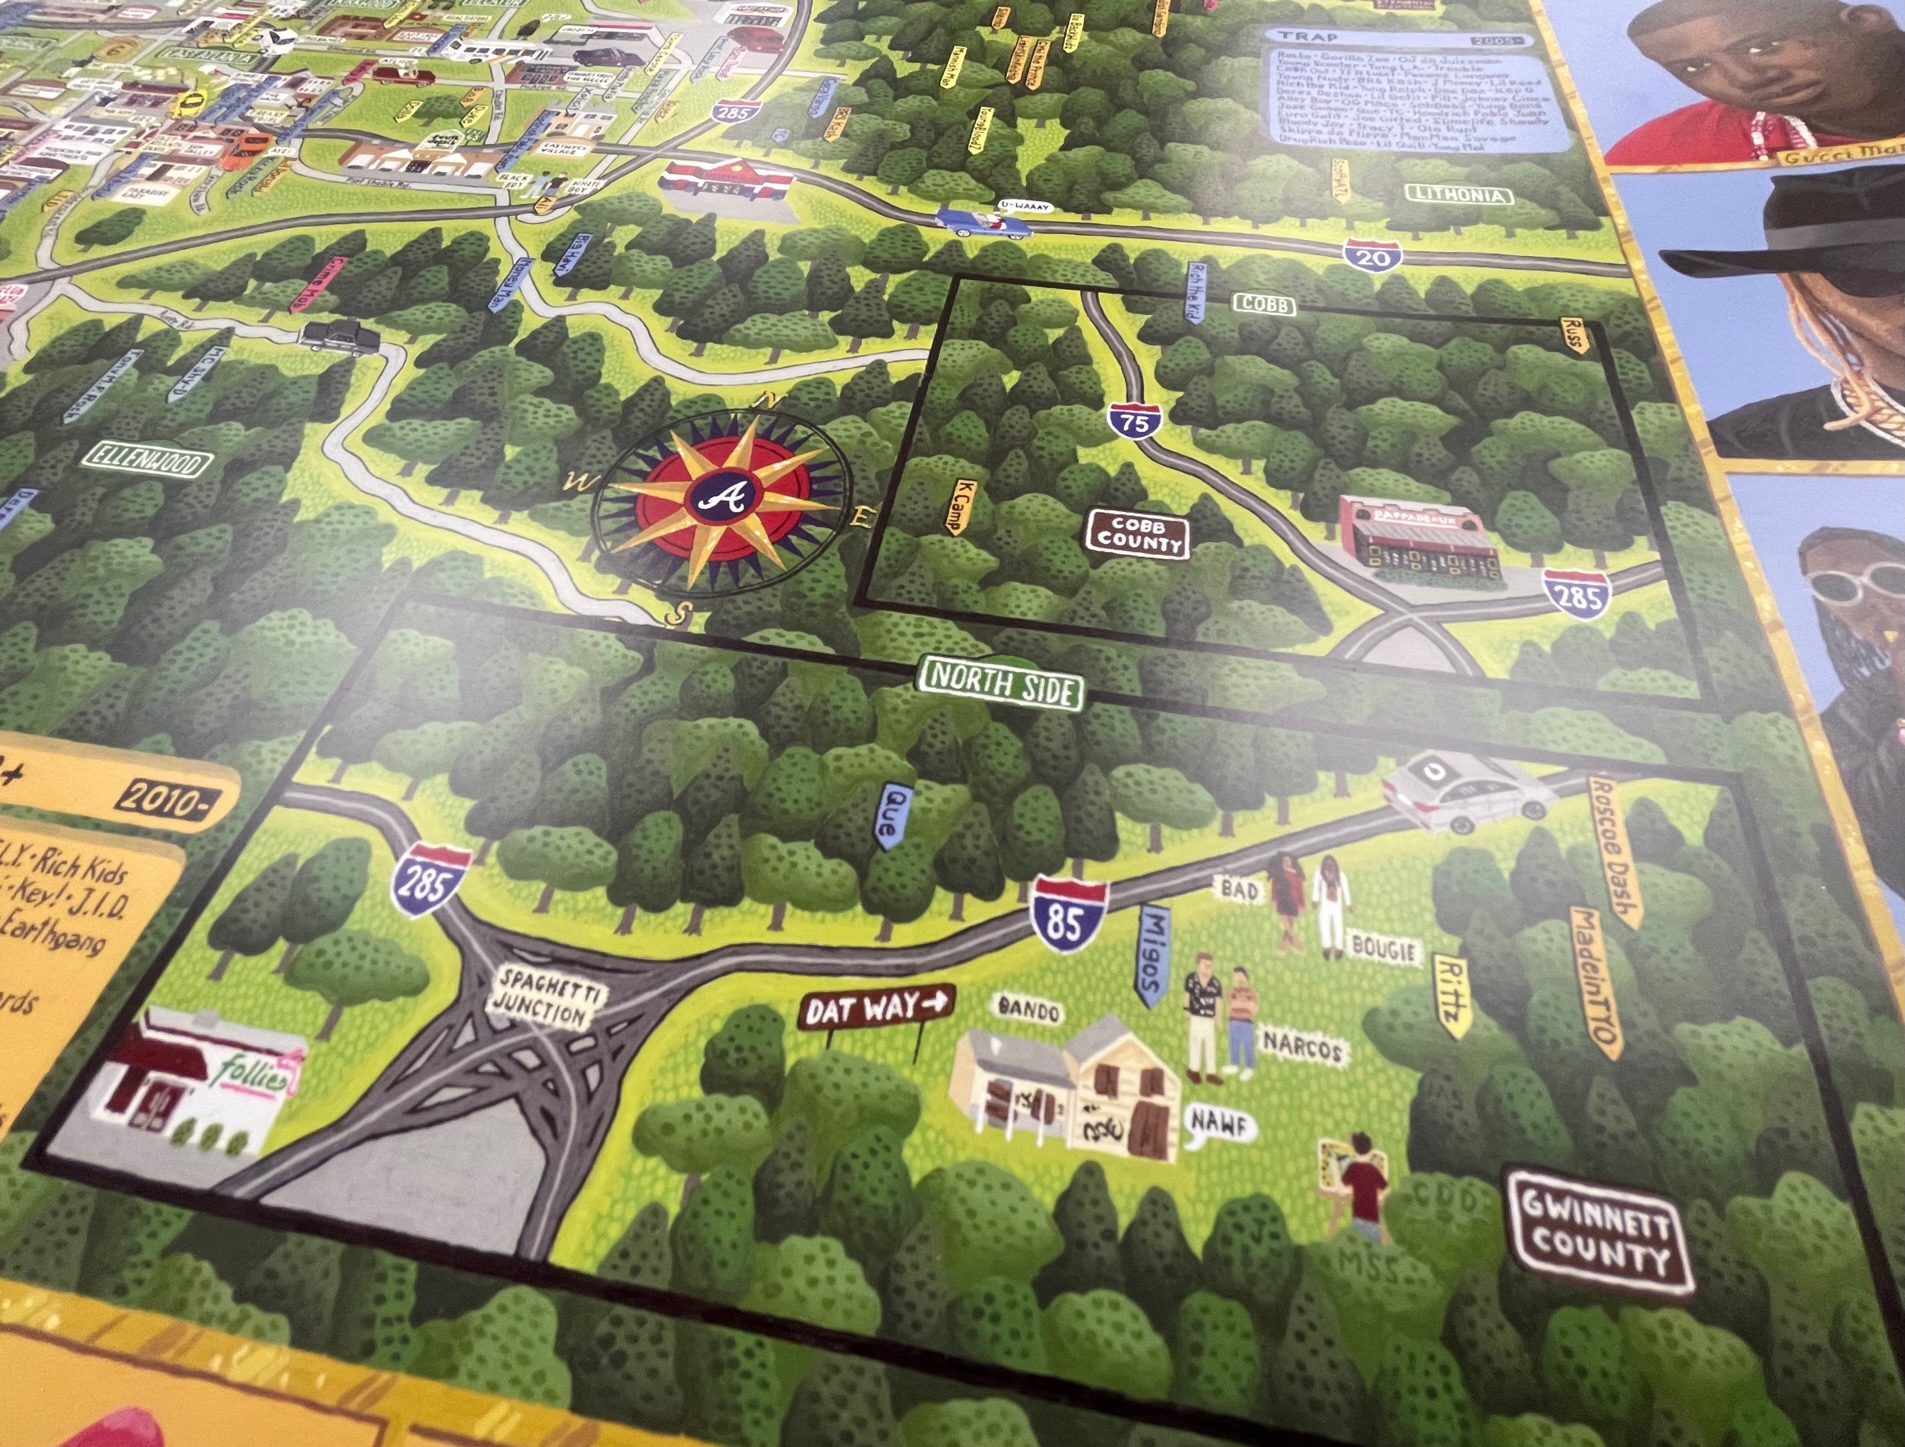
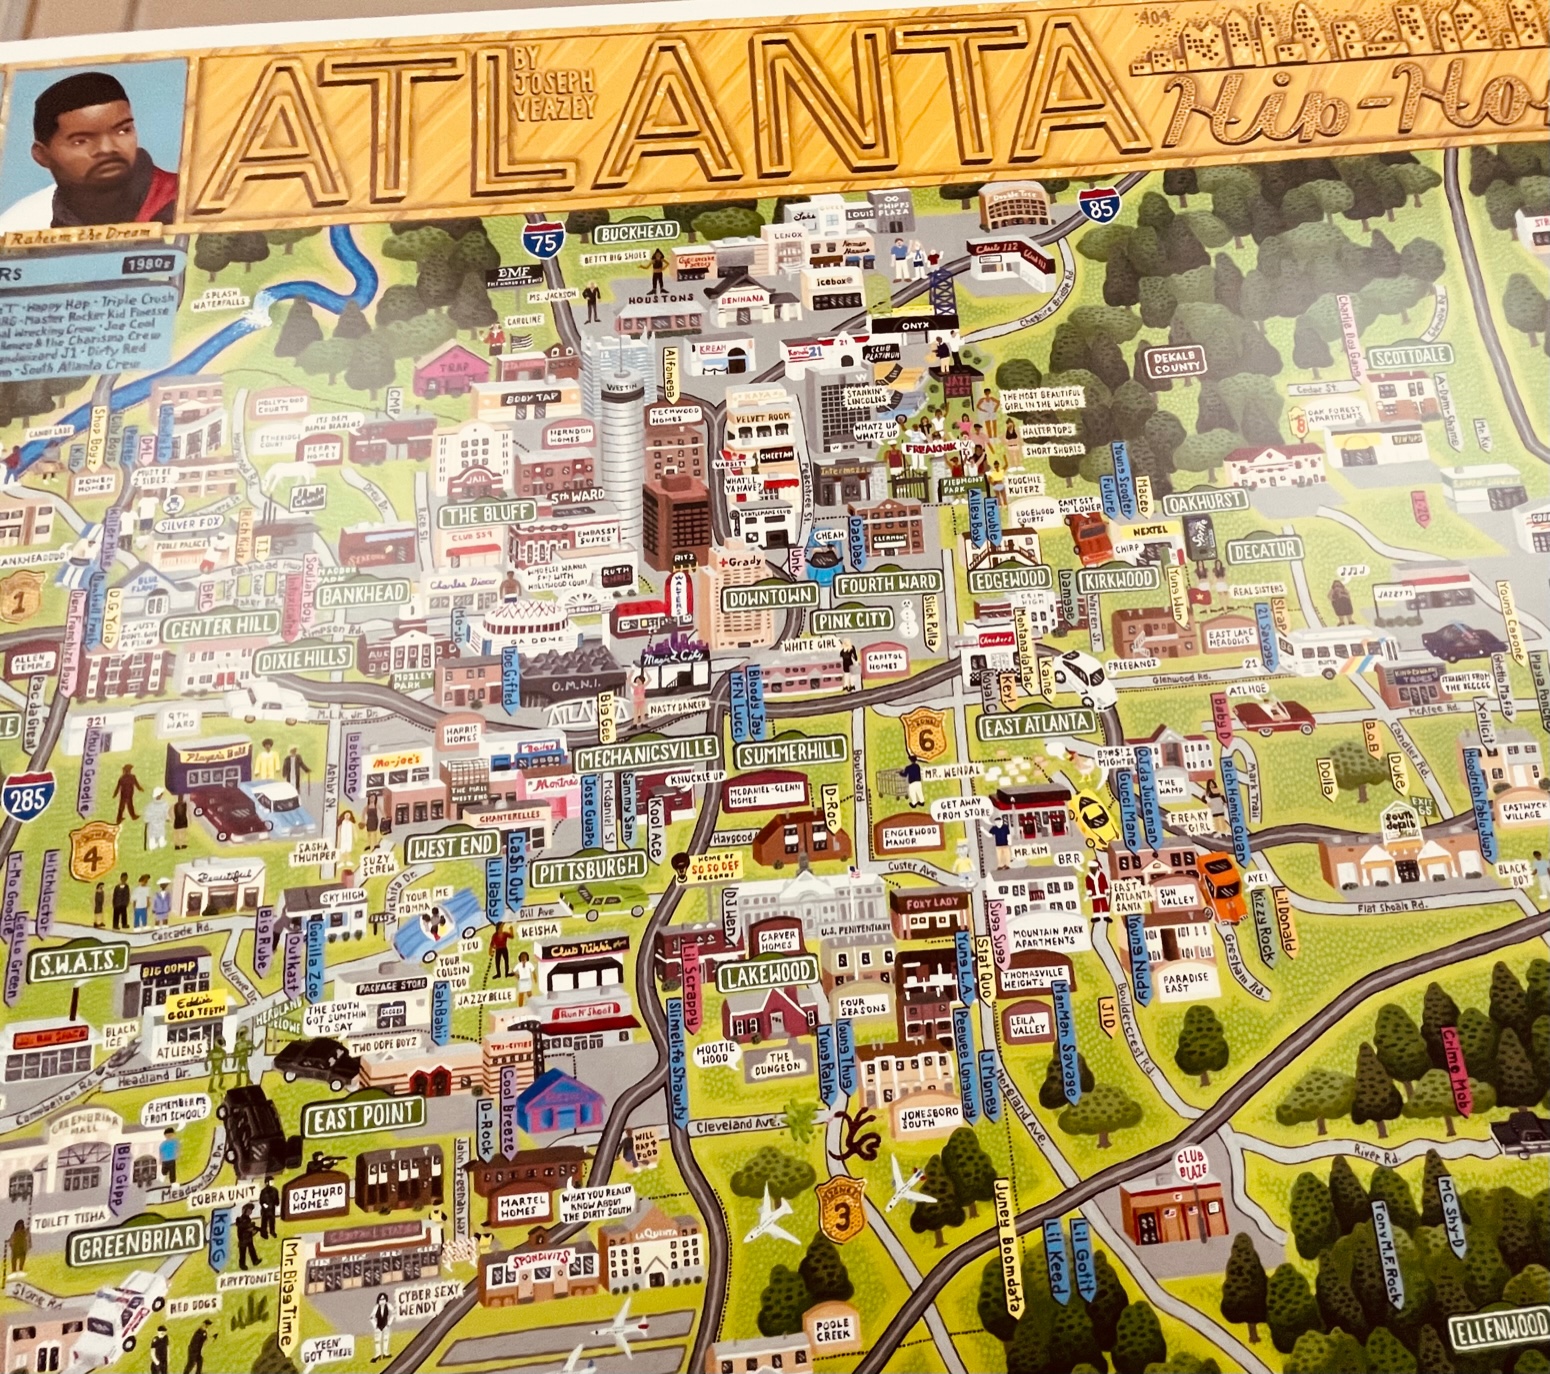
From Hip-Hop to Hope
By Brendan Dooley
Recently arriving in the American Geographical Society Library, the “Atlanta Rap Map” is a tribute to the hip-hop influences of, in and around Atlanta, Ga., that documents the region’s artists and their works. The map shows artist locales as well as lyrical influences within, and lists major and minor performers and their works throughout with a border of painted face images.
Compiled, created and sold by Veazey Studio, the company said the 24” x 36” map was painted by hand in acrylics and includes anything “literally ‘put on the map’ by being mentioned in a hit song (from classic underground staples, to local hits, to worldwide chart toppers) or an influential album. The research took over a year, as older artists were uncovered, and hundreds of albums were listened to in their entirety.” (Now that’s my kind of research …)
Veazey Studio said proceeds from its sales of the Atlanta Rap Map will benefit HOPE Atlanta, a charity striving “to help Georgians avoid homelessness and hunger.”
You can come up to view the Atlanta Rap Map in the AGSL Monday-Friday, 9 a.m. to 4:30 p.m.

All the News that’s Fit to Map
By Brendan Dooley
In order to keep troops around the world up to date on each week’s advances during World War II, the U.S. military developed Newsmaps, poster-sized weekly publications of geographically focused battle updates. This was a time, of course, before emails, Tweets and Instagram posts (let alone personal cellphones in every pocket), so for the sailor at sea or soldier in the woods, jungle or desert, posted Newsmaps (often literally attached to posts) might be the only regular news they would see.
The American Geographical Society Library collection recently added 30-plus Newsmap editions, growing its collection of them to 142.
Most of the Newsmaps featured news briefs on the front, keyed to either large maps or smaller insets and/or photos from the relevant theater of operations, and the backs often featured large instructional or propaganada-ish illustrations or large-scale maps detailing particular battle hot zones.
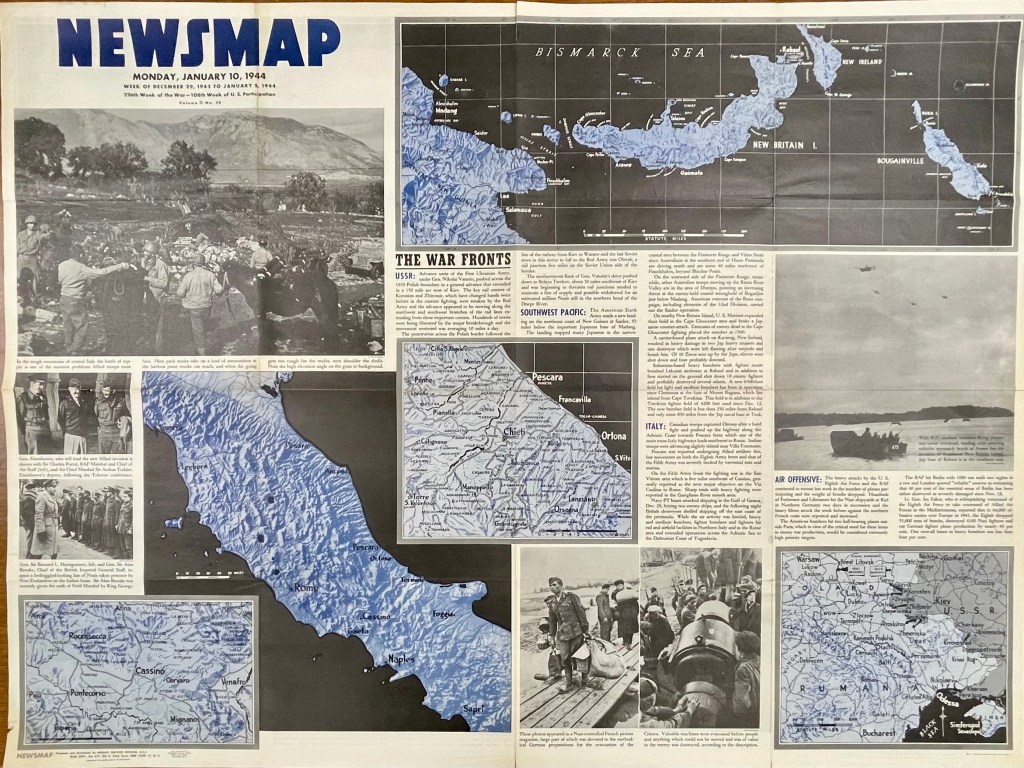
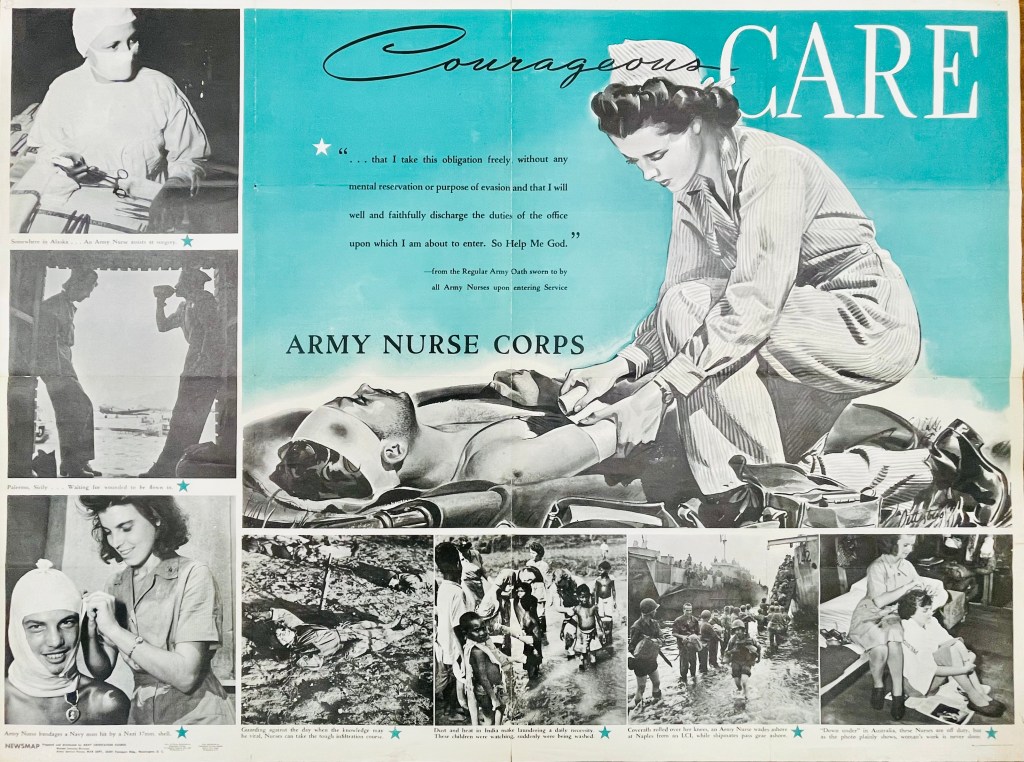

For instance, on the front of the Monday, Jan. 10, 1944, Newsmap (Vol. II, No. 38) are a collection of maps and images to go along with news briefs. The briefs that week covered the Soviet advance against Nazis in Crimea and Poland, U.S. movements against Japan on New Guinea in the Southwest Pacific, U.S. troop gains in central Italy and combined U.S. and R.A.F. bombing raids against Nazi-controlled munitions, plants and materiel in Northern Germany, Berlin and Paris (though no graphics with this last snippet). On the reverse of this Newsmap was a combined illustration and images detailing some ins and outs of the Army Nurse Corps.
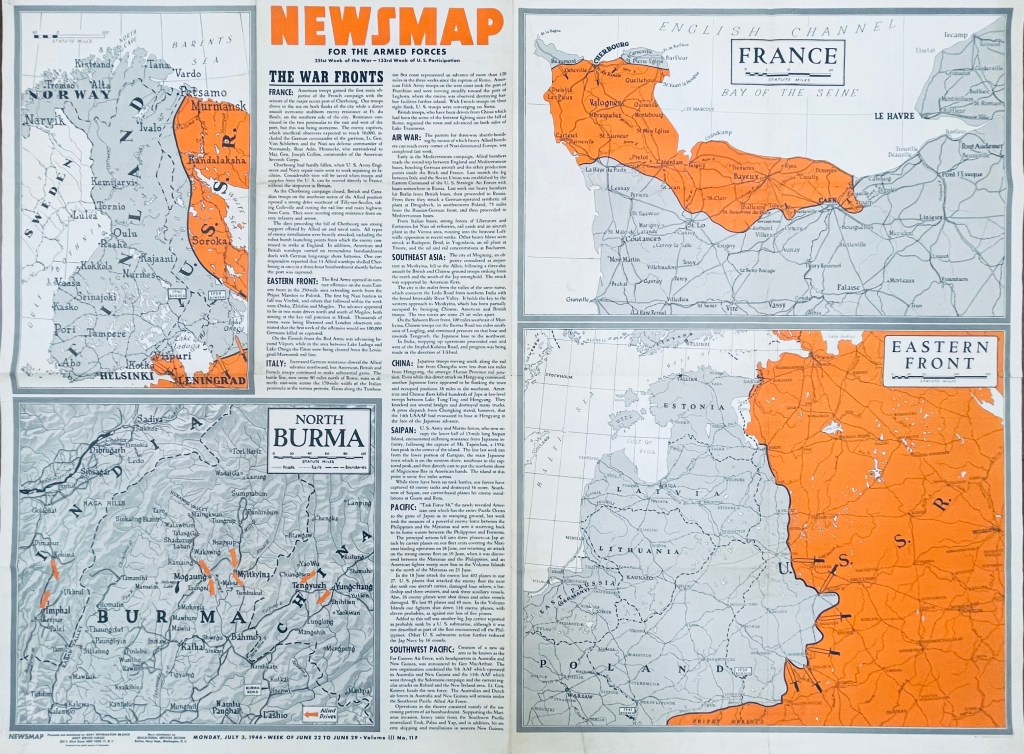
In another example six months later, the front of the Monday, July 3, 1944, Newsmap (Vol. III, No. 11F) includes briefs on the Allied seizure of the port at Cherbourg, France, Soviet advances in Finland, the Allied march north through Italy (now 120-some miles past Rome), bombing raids across Germany, Poland, Italy and Yugoslavia, Chinese and British troops taking Mogaung in Burma, U.S. Marine movements on Saipan, the new “Task Force 58” maneuvers near the Philippines and air operations in the Southwest Pacific. The back of this edition (Vol. III, No. 11B) detailed the importance of Teamwork, whether by army and naval forces in combined attacks or various Allied contingents in joint planning efforts and operations.
While blue was a dominant color of the Jan. 10 Newsmap, July 3 (on the front side) uses orange to highlight interest; from week to week, Newsmaps tended to feature one main color. Of note, the Newsmaps starting within Vol. II began denoting front “F” and back “B” sides to the editions. Additionally, there were Industrial editions of the Newsmaps—sent to U.S.-based munitions plants and military factories—that were usually similar in their news and layout on the front, but did not contain B sides. (More on these Industrial editions in a future post.)
The AGSL physical collection now includes 114 military editions of the Newsmaps across Volumes 1-5 (which ran from 1942-1946), as well as 28 of the Industrial versions from Volumes 2-4. Roughly two dozen of the new military editions and 15 of the Industrial versions were added after a donation from the Milwaukee County Historical Society.
You can come up to view them Monday-Friday, 9 a.m. to 4:30 p.m. in the AGSL on the third floor of the Golda Meir Library; which is open to the public as well as UWM students. (The extent of 212 Newsmaps is also available online at the University of North Texas here.
