Atlases
Virtual cities : an atlas of exploration of video game cities
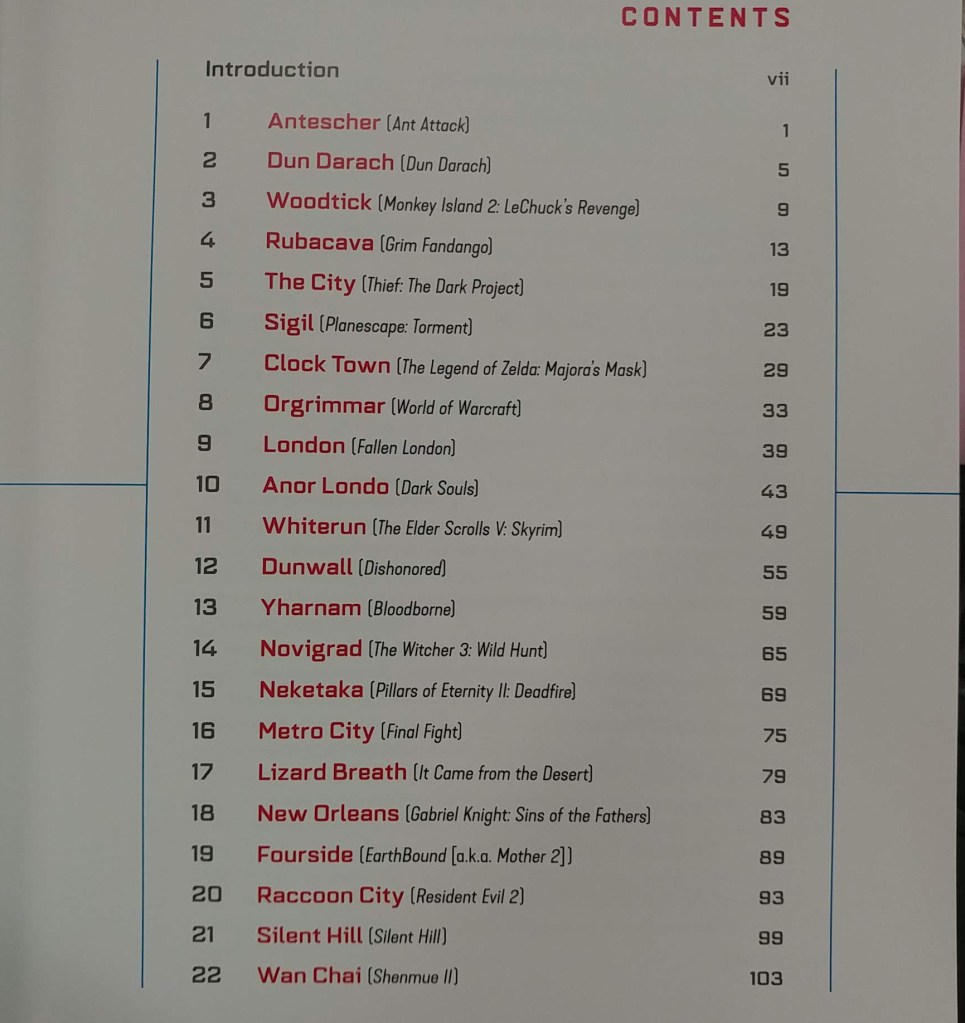
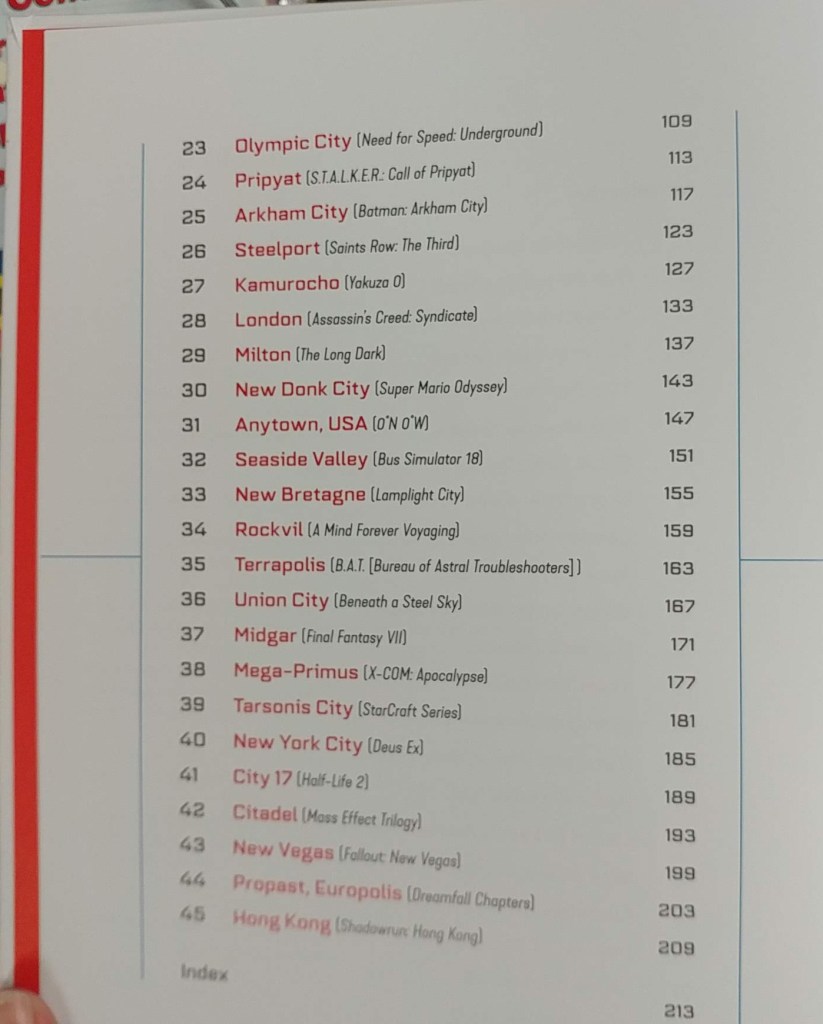
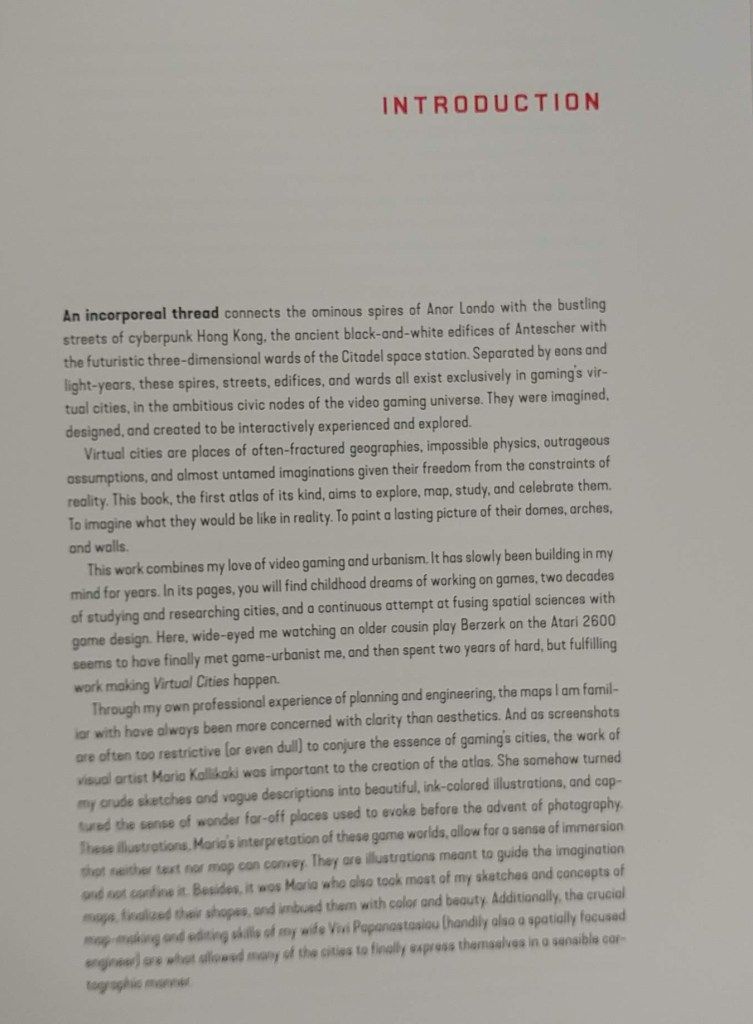
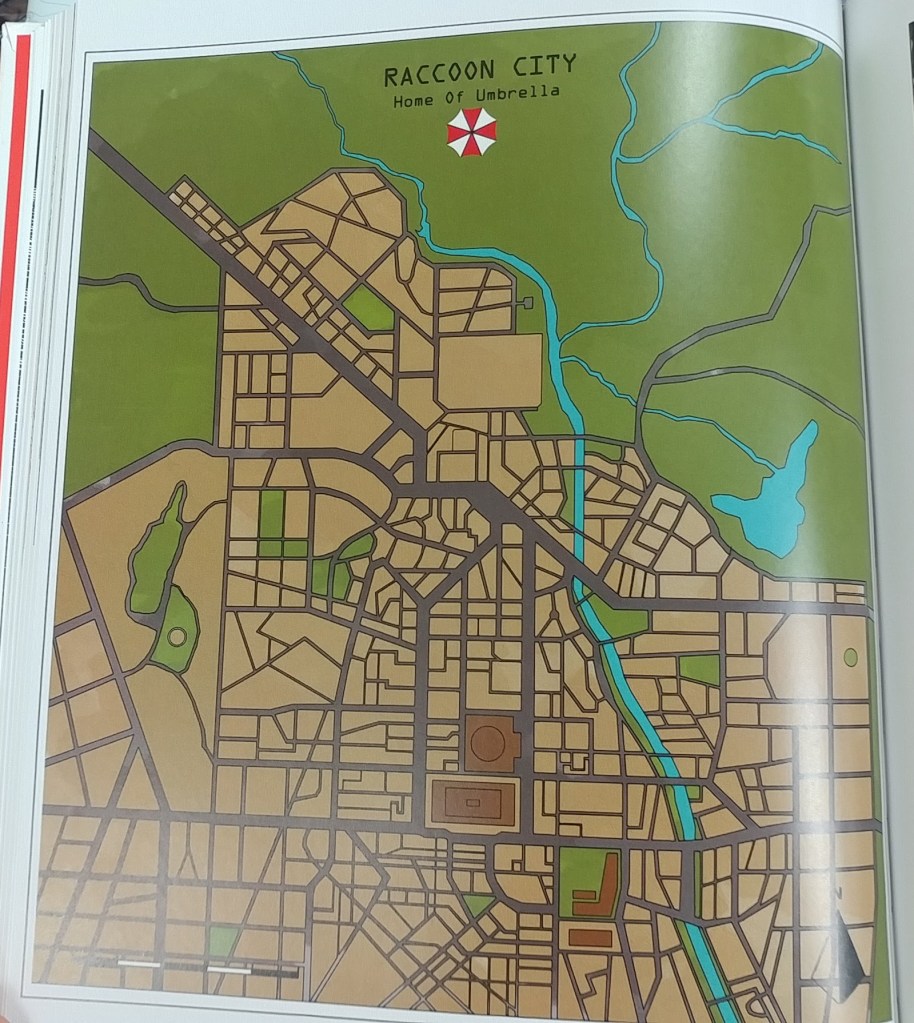
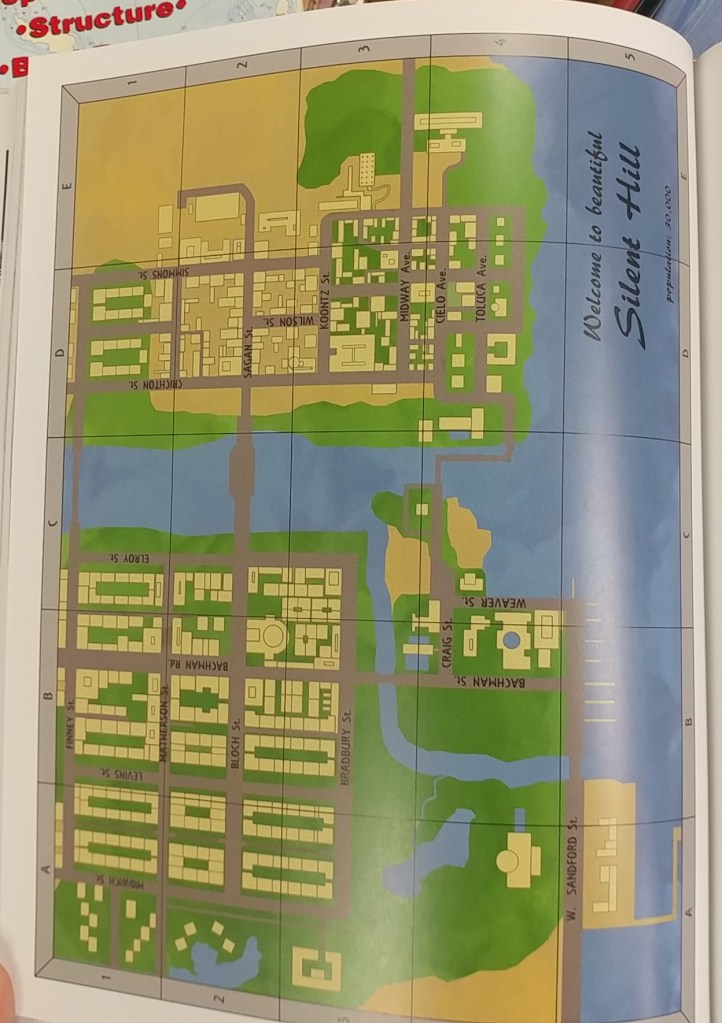
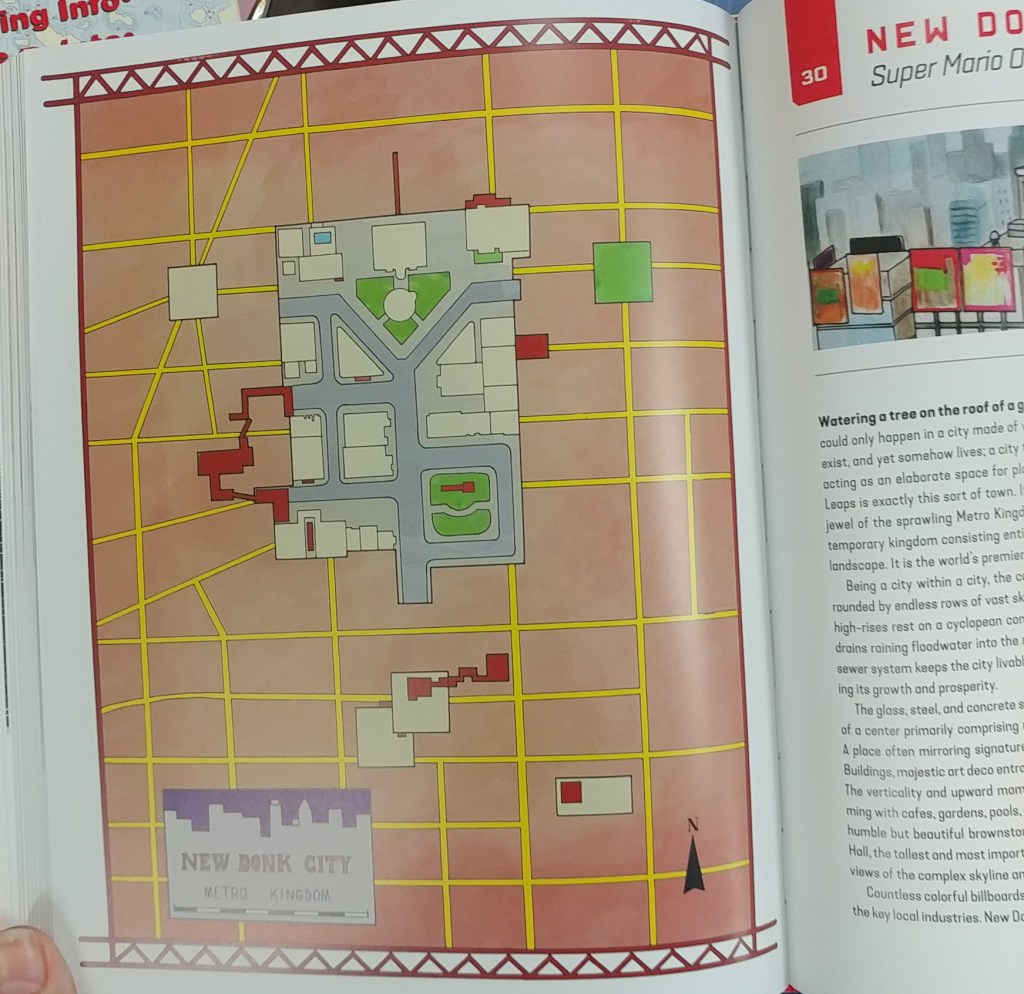
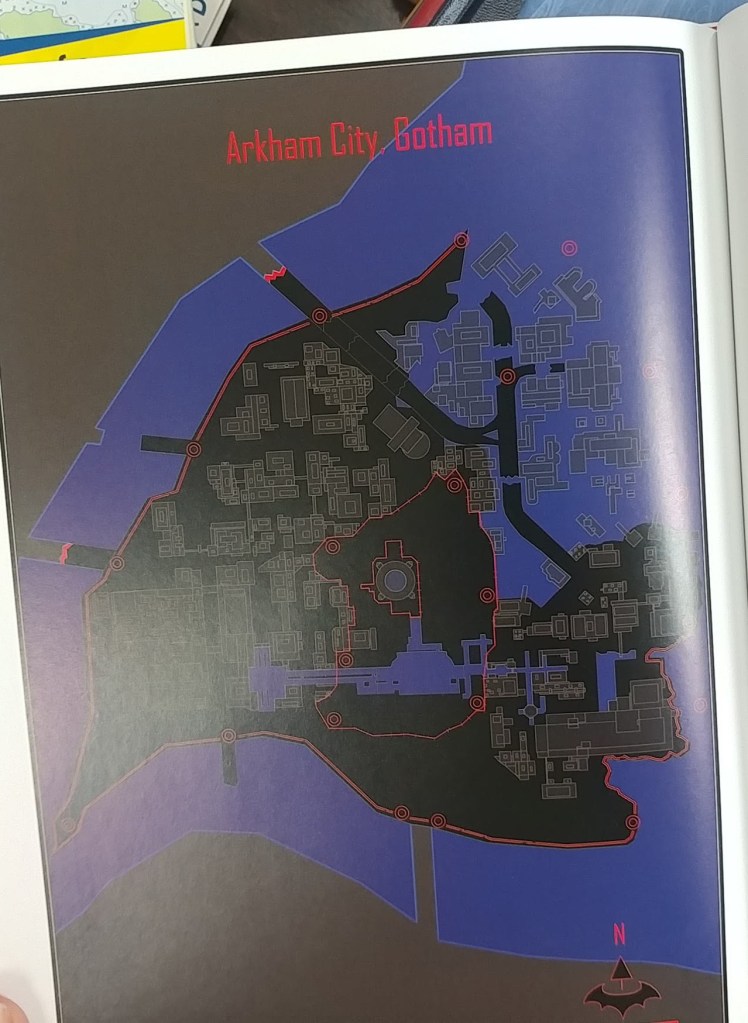
The AGS Library added a new atlas to the collection. Virtual Cities: An Atlas & Exploration of Video Game Cities by Konstantinos Dimopoulos. 224 pages, ISBN 1682686094 by Countryman Press, 2020.
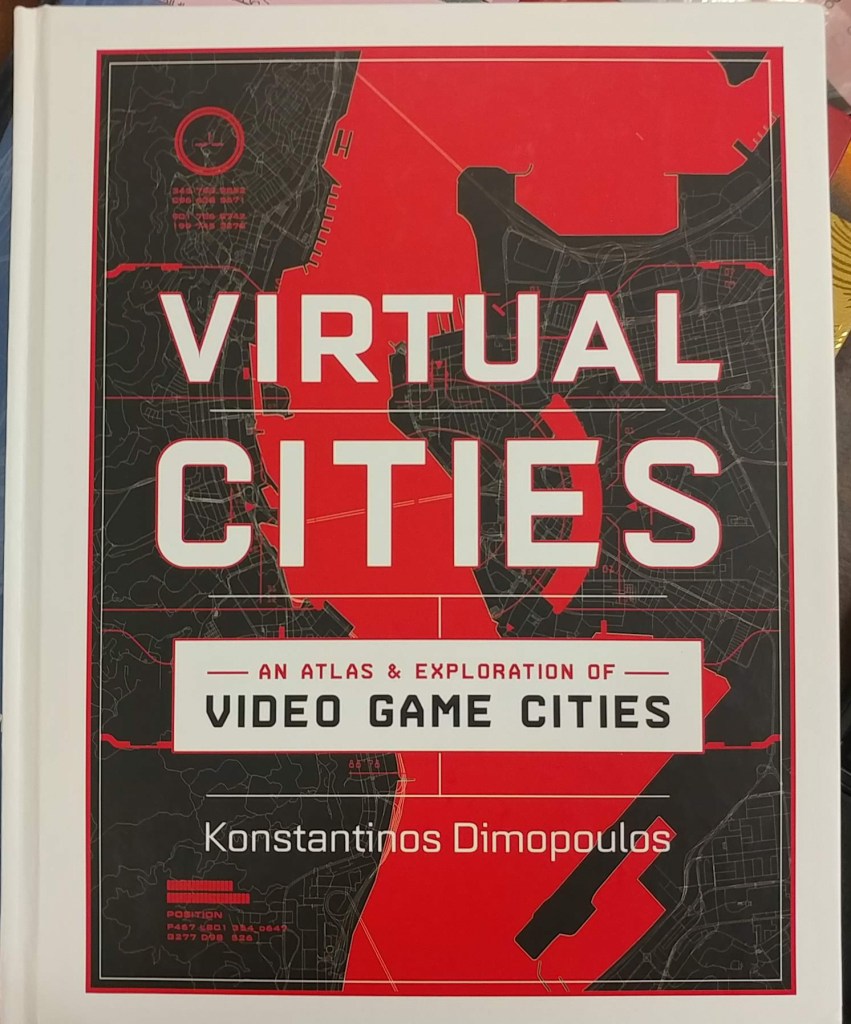
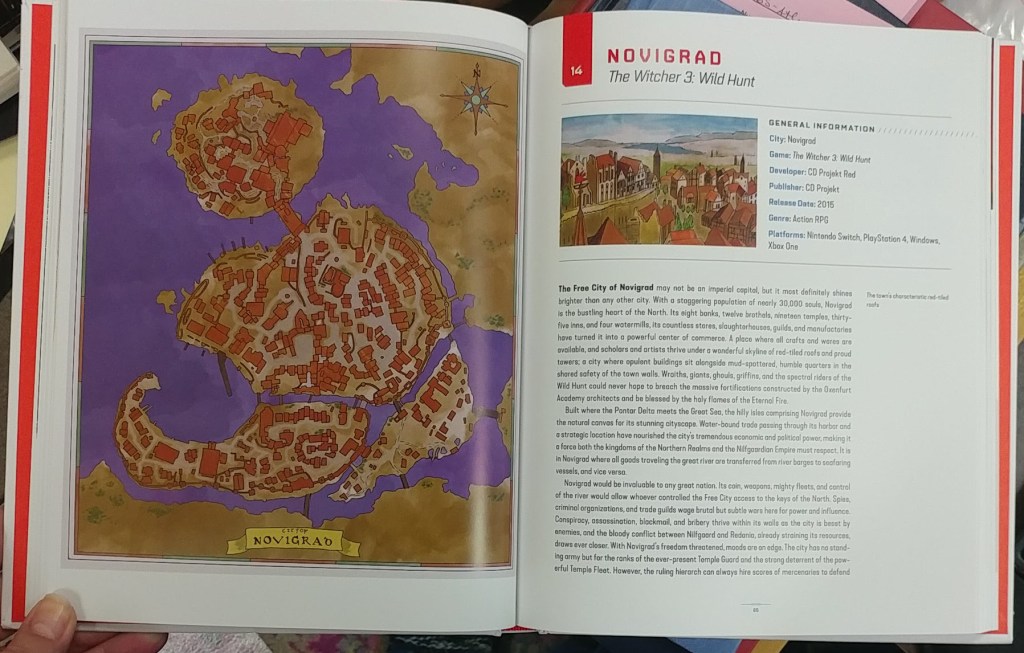
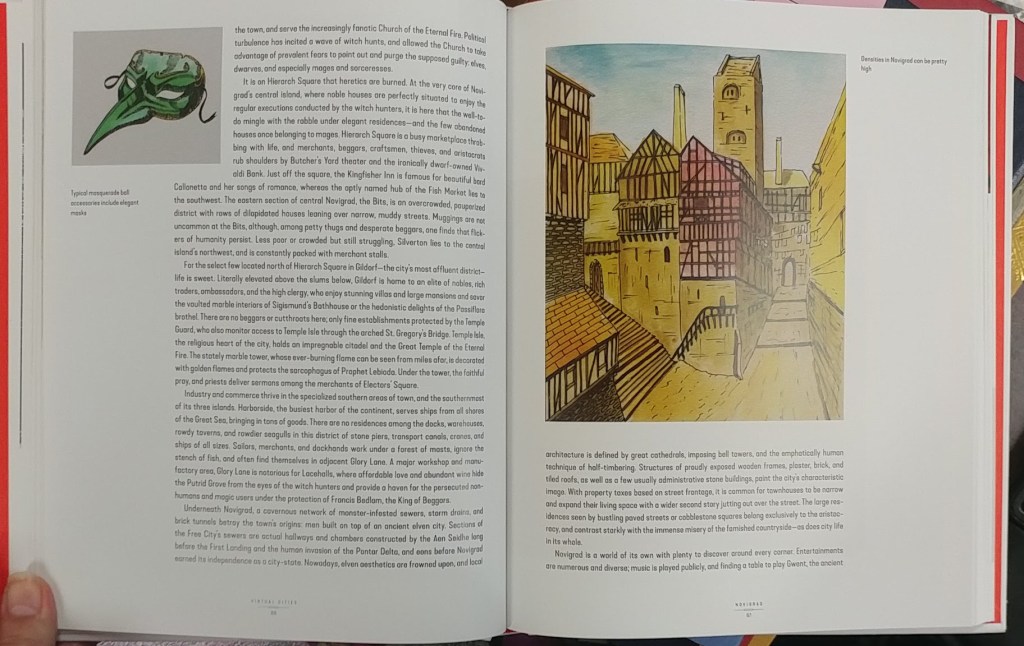
“Spanning decades of digital history, this is the ultimate travel guide and atlas of the gamer imagination. Dimopoulos invites readers to share his vision of dozens of different gaming franchises like never before: discover Dimopoulos’s Half-Life 2’s City 17, Yakuza 0’s Kamurocho, Fallout’s New Vegas, Super Mario Odyssey’s New Donk City, and many more. Each chapter of this virtual travel guide consists of deep dives into the history and lore of these cities from an in-universe perspective. Illustrated with original color ink drawings and―of course―gorgeous and detailed maps, readers can explore the nostalgic games of their youth as well as modern hits. Sidebars based on the author’s research tell behind-the-scenes anecdotes and reveal the real-world stories that inspired these iconic virtual settings. With a combination of stylish original maps, illustrations, and insightful commentary and analysis, this is a must-have for video game devotees, world-building fans, and game design experts. 100 color illustrations.” — amazon.com


Konstantinos Dimopoulos studied urban planning and city geography for 10 years and holds a PhD. He has worked on the cities, settlements, and maps of several games including MMO Seed, The Sinking City, and more. He lives in Athens, Greece.
On the Road to Algoe: Revisiting the Paper Town
By Lauren Maddox
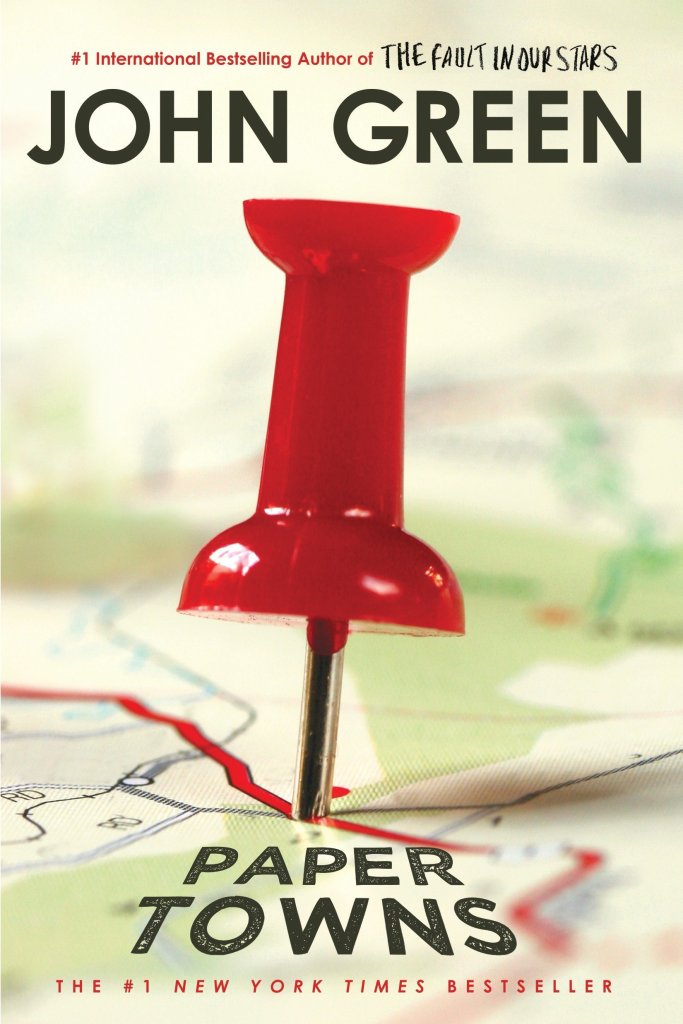
John Green’s Paper Towns posed a question that stumped many of its readers: how can spaces be simultaneously fictitious and real?
The novel was received by an excited public in 2008; the book won the Edgar Award, was Editor’s Choice for book of the year at Booklist and Voya, and was top of the list for Best Book at the Chicago and New York public libraries. In 2014 and 2015 interest in the novel and its faux-setting peaked– Paper Towns was being adapted into a film starring Nat Wolff and Cara Delevingne. Excitement for the move inspired a plethora of articles by news outlets like NPR, MNN, and Gizmodo describing the paper town that the book is centered around: Algoe, New York.
Check this book out from the UWM library! Click the link to learn more.
Algoe was unique in that it wasn’t and then was and then wasn’t a real place. Mapmakers would sometimes include fictitious entries as a way to subtly sign their work. It’s almost impossible to prove that a representation of reality has been copied, but copyright traps were a way to prove that a work had been stolen. If the copycat included the fictional place names from the original map in their version, the original mapmaker could prove that it was their intellectual property. Algoe was one of these copyright traps. It appeared to be a small hamlet in upstate New York, nestled between interstate routes. In reality, “Algoe” was just an anagram of mapmakers Otto G. Lindberg’s and Ernest Alpers’s initials.
Esso bought the map from Lindberg and Alpers and began distributing it. A few years later, Algoe appeared on another map by Randy McNally. Lindberg accused McNally of having stolen the map because, of course, Algoe wasn’t a real place. But McNally protested. His company had gotten the records of Algoe completely legally. A general store owner had seen the town name Algoe on the Esso map years earlier and decided to name his general store after it. Just like that, Algoe had become a real place. After a few years, the store shut down, and Algoe ceased to exist again. You can still find it, though, if you search for Algoe on Google Maps.
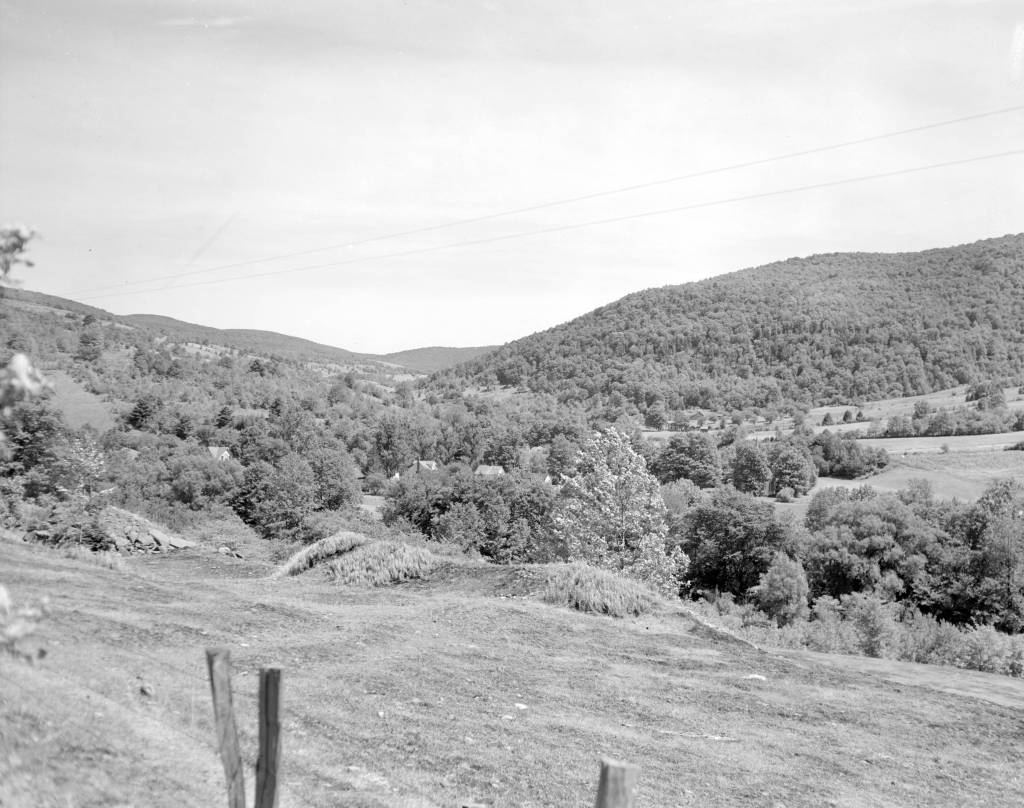
Photo of Delaware County, New York, where Algoe was supposed to be. Click this link to see this photo in our Digital Collections!
Trap streets and paper towns were just one way that a mapmaker might mark their work– the map sheets below, which are part of a survey of the Gold Coast (now Ghana), depict a hidden elephant in the elevation chart. Frank Jacobs’s “How to Hide an Elephant in a Map” tells the story of a hot, uncomfortable British surveying expedition who, upon discovering a particularly inaccessible stretch of land, decided to just doodle an elephant and call it a day.
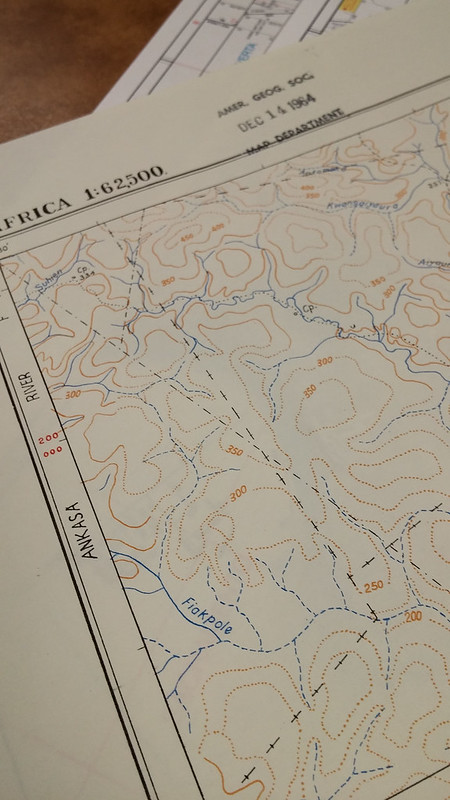
1964 Edition of the Gold Coast Survey Maps. Click the link to check out our Flickr! 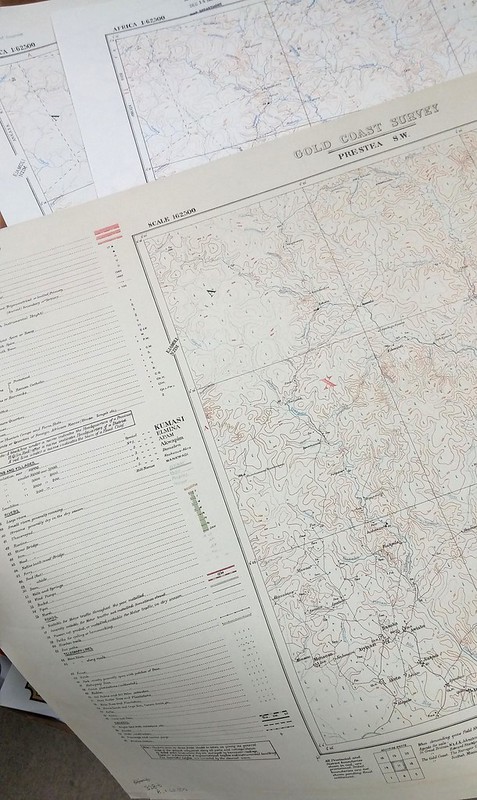
Three editions featuring the elephant. Click the link to check out out Flickr!
In this case, the hidden mark on the map wasn’t to protect intellectual property; apparently, the expedition decided to fill the blank space in their survey so that they could pack up and go home. But the result was the same– the creator’s left a unique stamp on their work that was copied in later editions over and over again. Just in the AGSL archives, there are three editions of this map sheet with the elephant from 1924, 1951, and 1964.
We expect maps to tell the truth– they appear, on the surface, to be objective representations of reality. But the truth is, they often aren’t; mapmakers and the people who finance them have an agenda. In Algoe’s case, it was a white lie designed to protect the intellectual property of mapmakers who wouldn’t otherwise be able to prove that their work had been stolen. And the tired British expedition’s elephant was a way for them to avoid traversing any deeper into an inaccessible landscape. These are the innocent lies that maps sometimes tell us– but other times, a map could be lying to us for other, more nefarious reasons.
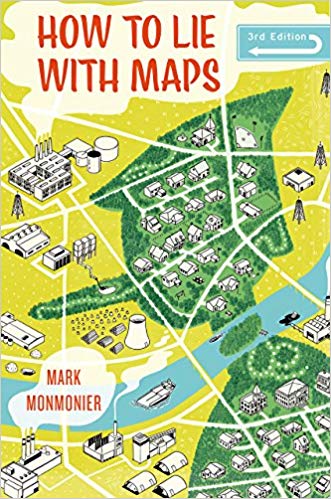
Monmonier’s How to Lie with Maps. Click the link to see this book in our Digital Collections!
Mark Monmonier’s How to Lie with Maps outlines the many lies, harmless or not, that maps sometimes tell us. According to Monmonier, “map users…need to appreciate the perils and limitations” of maps because they are “rhetorical tools fully capable of ‘lying'” to us, accidentally and purposefully. These lies can be fairly small– a fake hamlet in upstate New York or an elephant masquerading as a hill. Algoe isn’t a threat to our perceptions of reality. However, it does remind us that maybe our maps aren’t as truthful as we like to believe.
In 1993, a series of cases against the board game company behind Trivial Pursuit ended the use of copyright traps. The courts found that, in the same way you can’t copyright a real place, you can’t copyright a lie. No one looks for these copyright traps anymore, since they aren’t functional protections against copycat map makers– which means there might be even more hidden places on our maps, waiting to be discovered.
Historical County Atlases
by Angie Cope
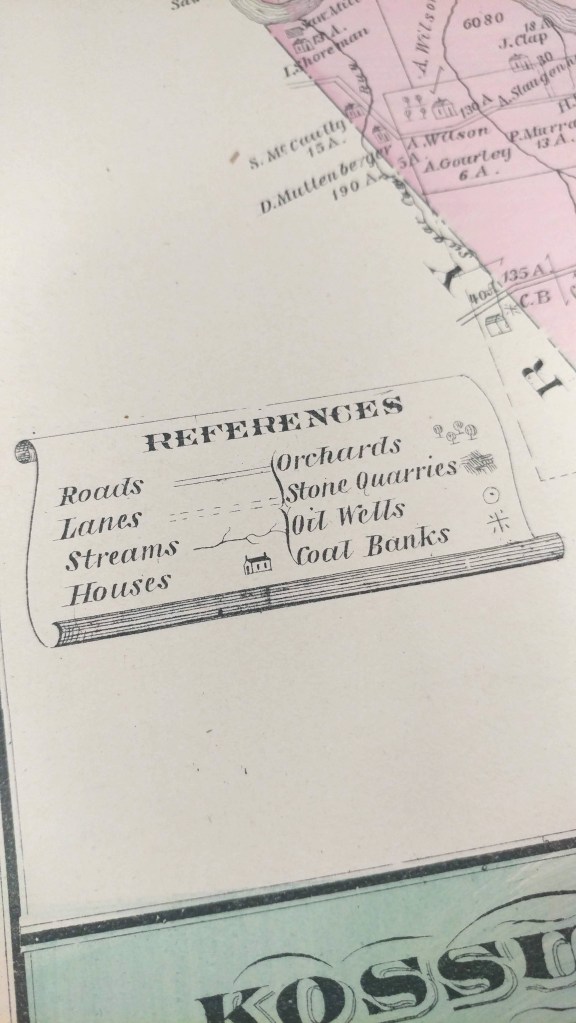
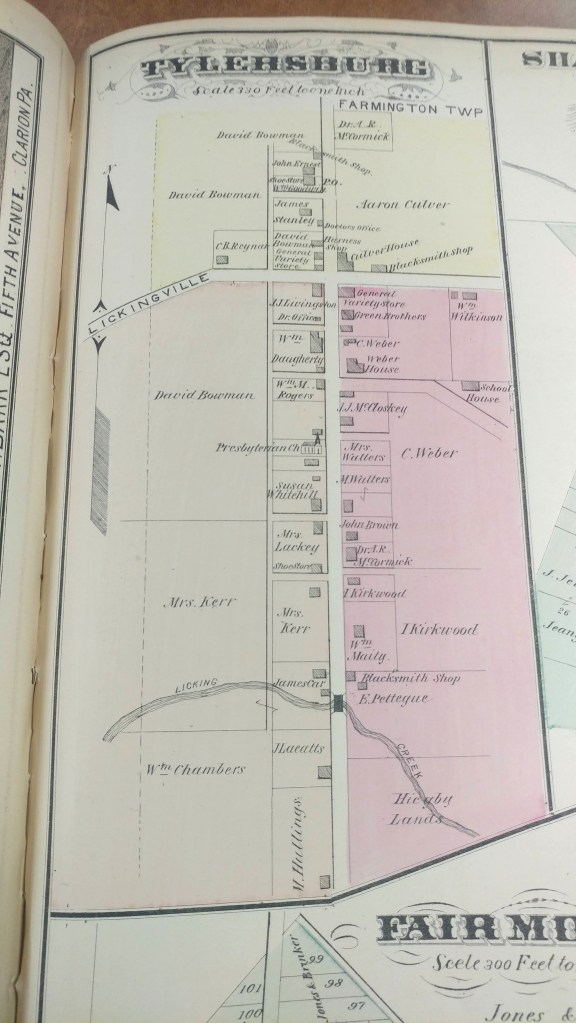
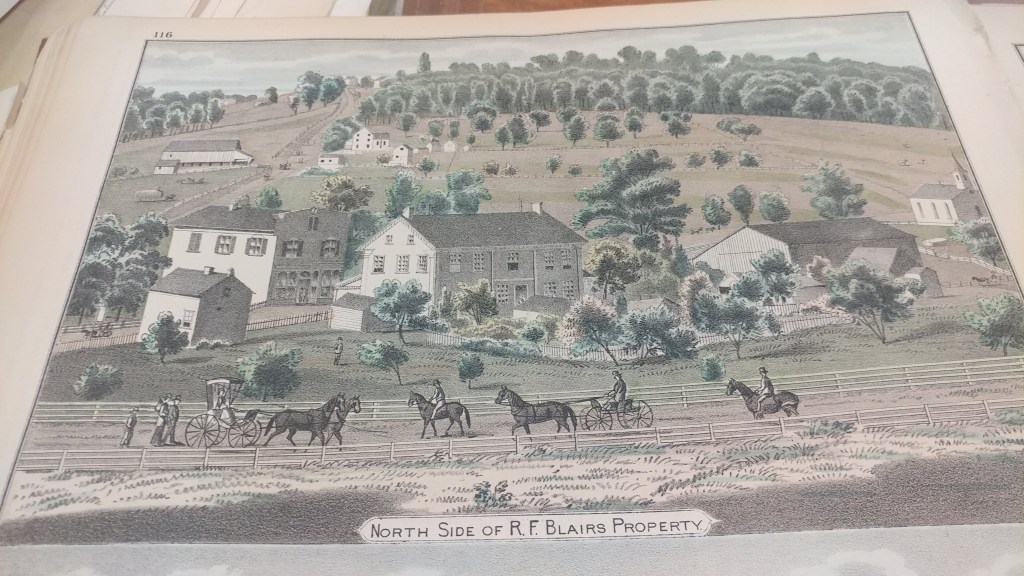
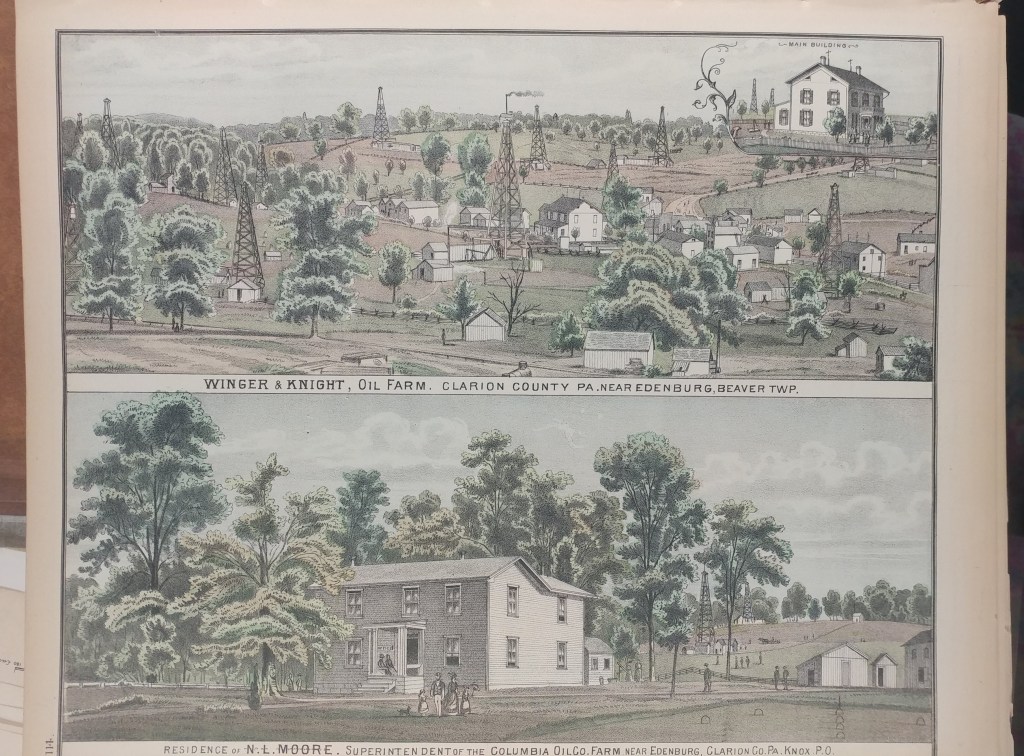
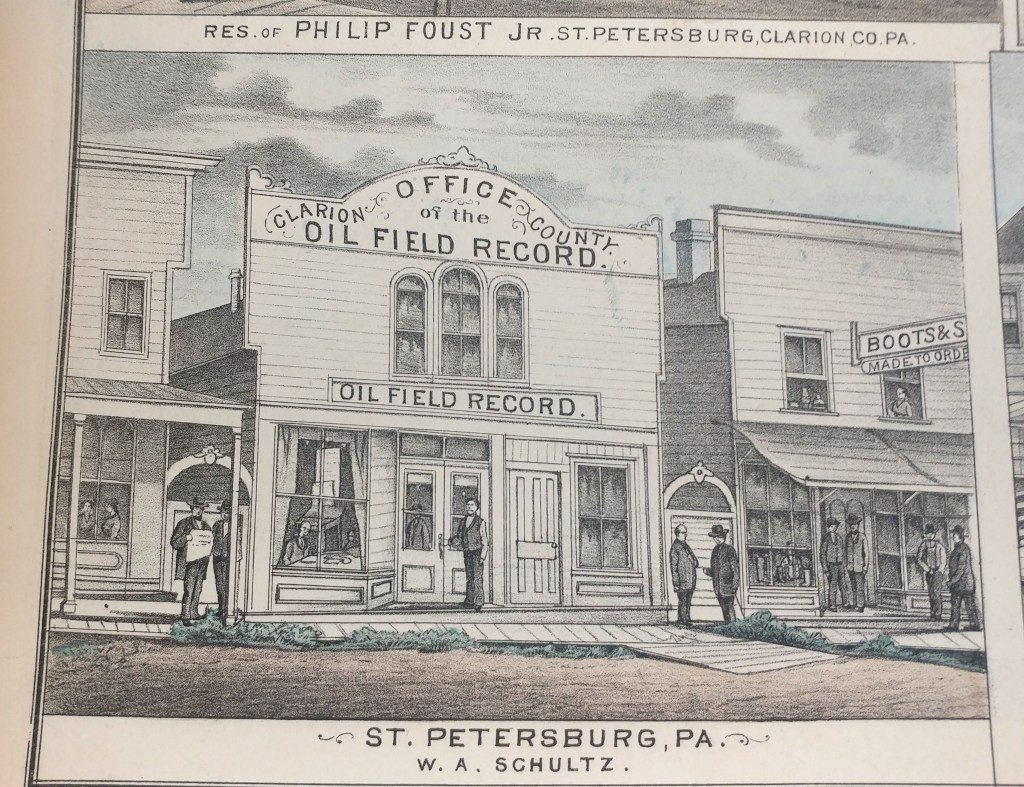
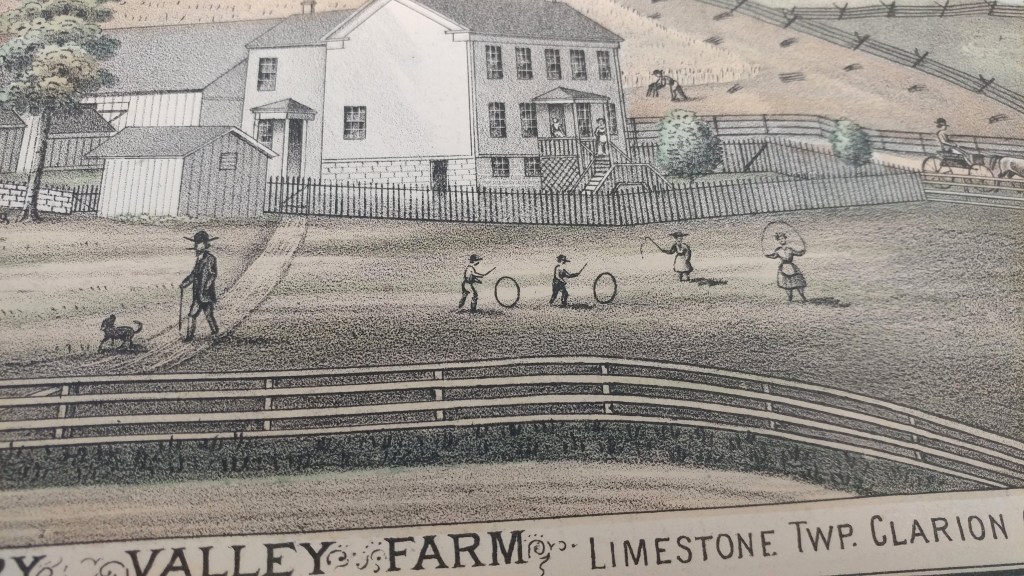
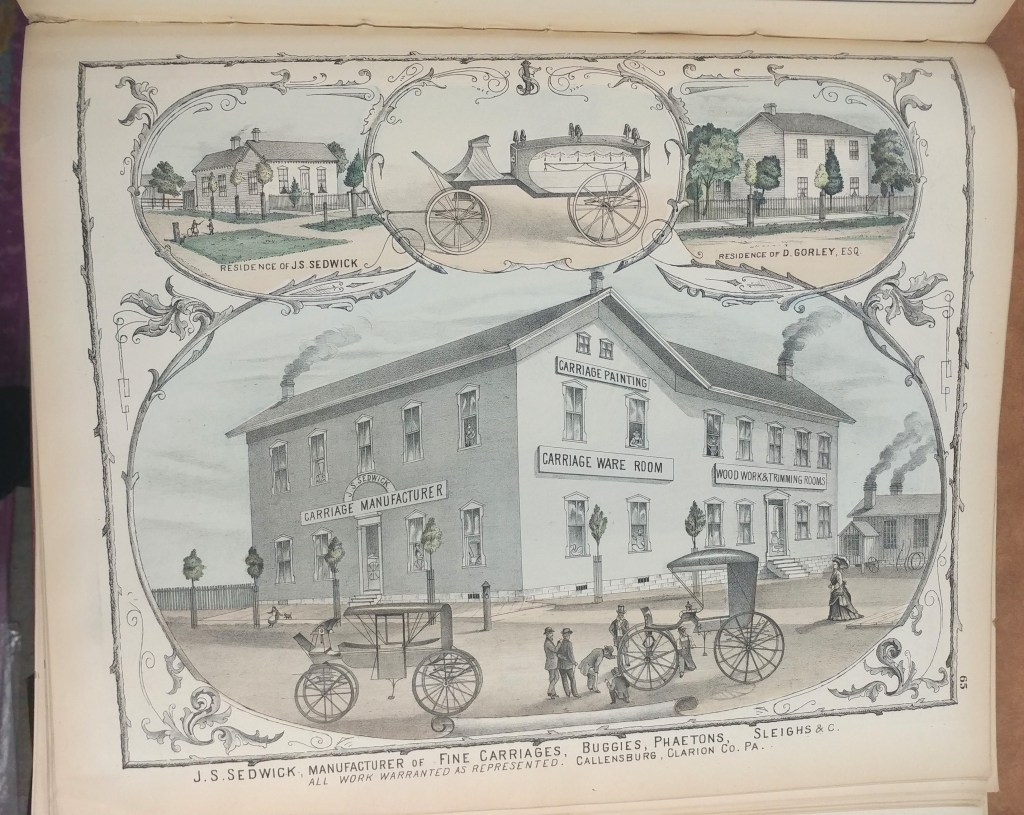
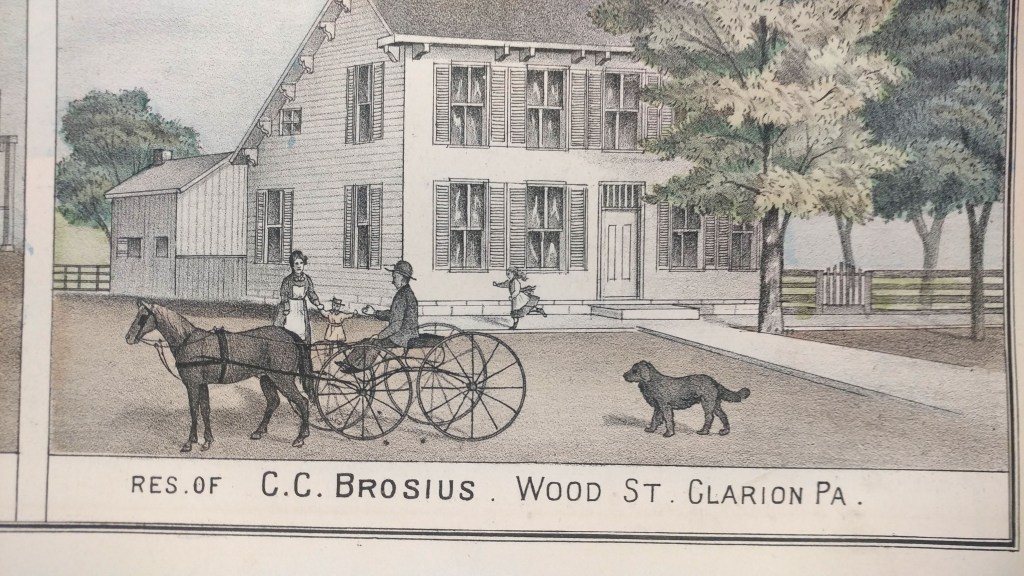
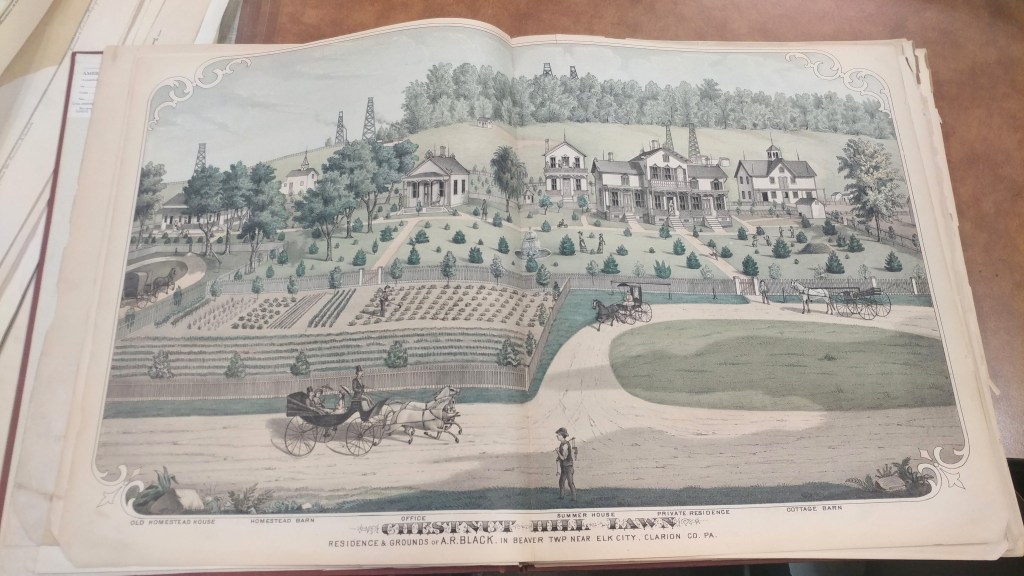
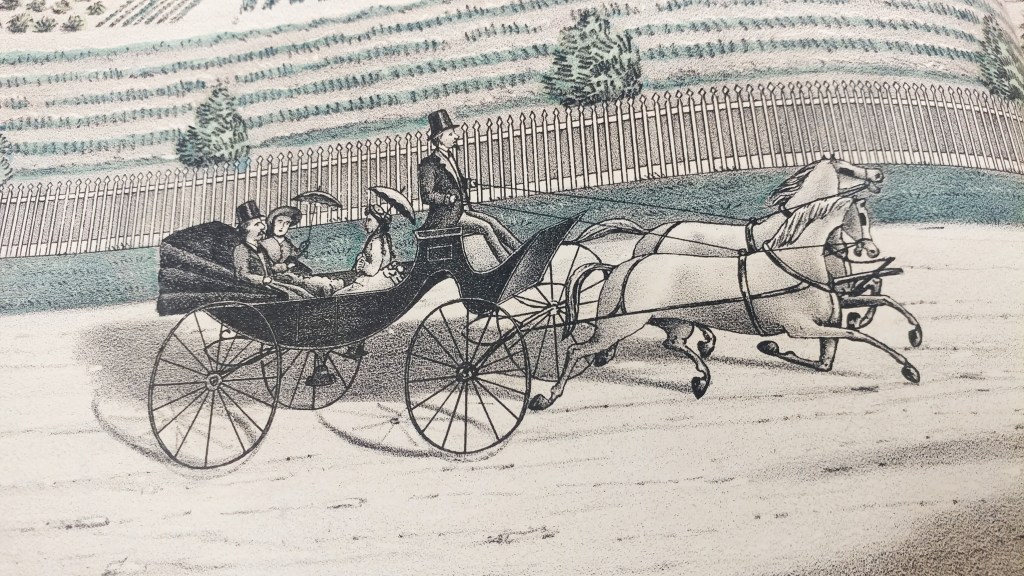
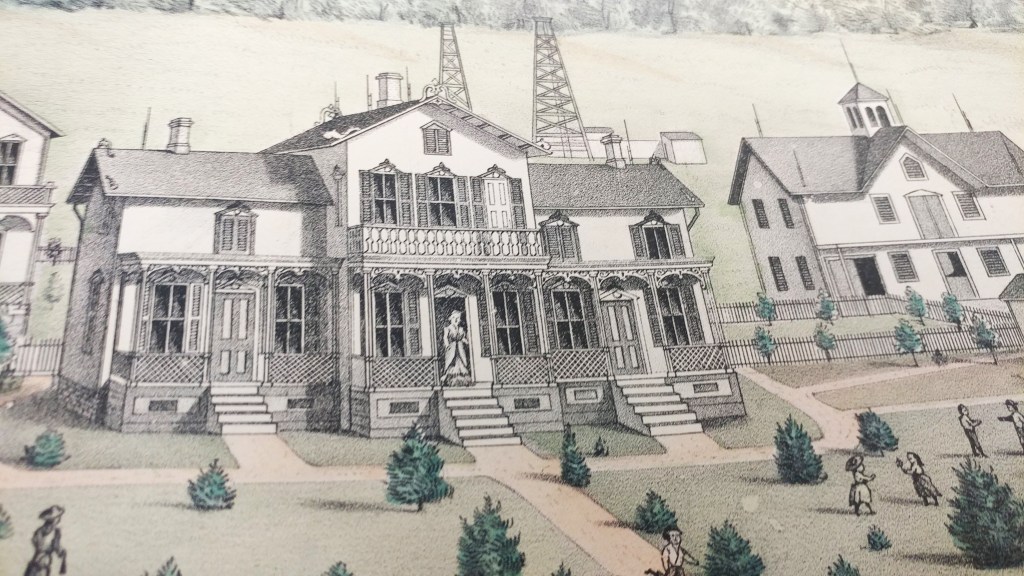
Historical county atlases show property boundaries and land ownership for every parcel of land in a county. In addition to rivers, hills and roads, these maps showed churches, cemeteries, schools, administrative boundaries, railways and roads. Each region had unique features such as Clarion County, Pennsylvania’s orchards, oil wells and coal banks.
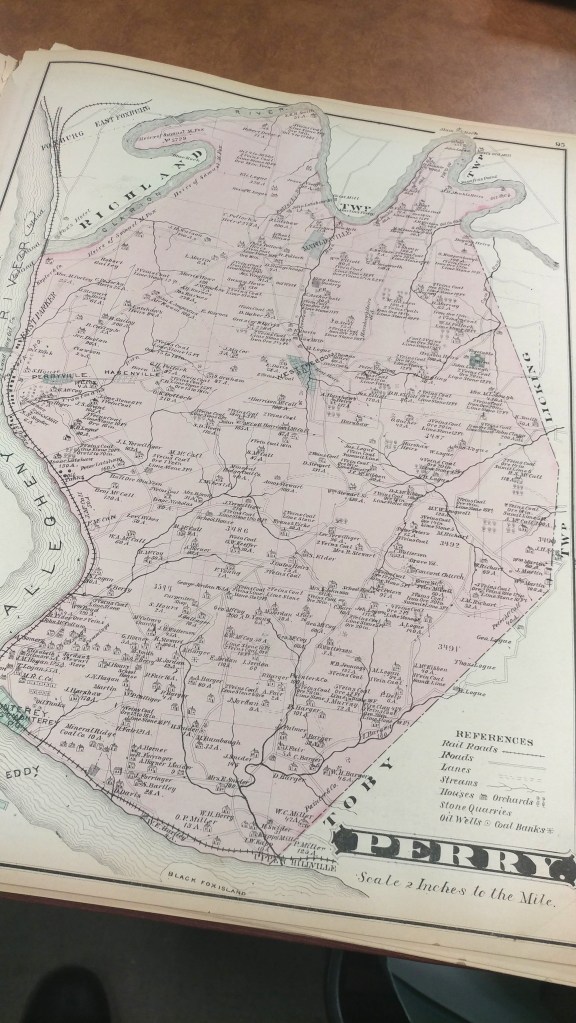
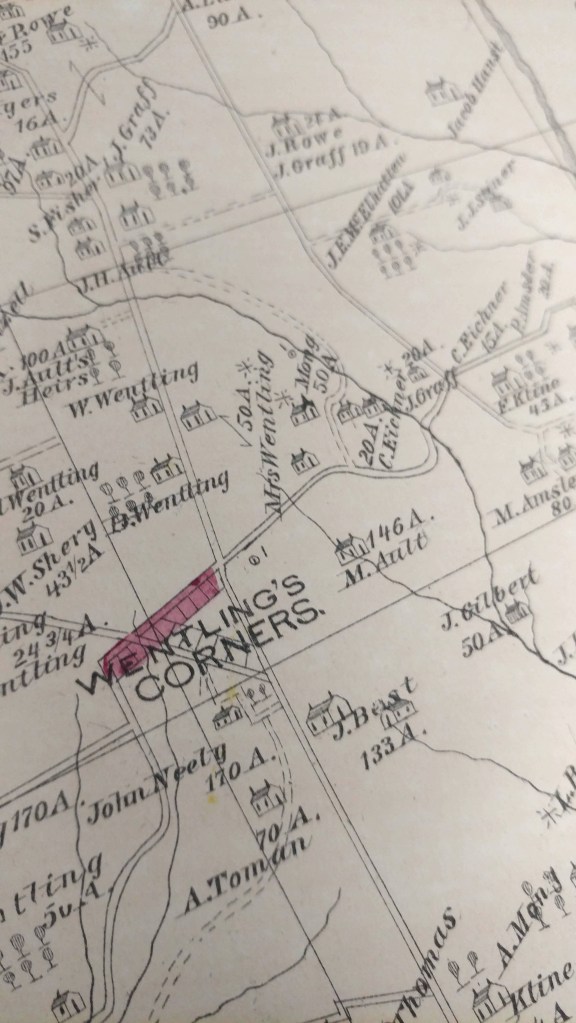

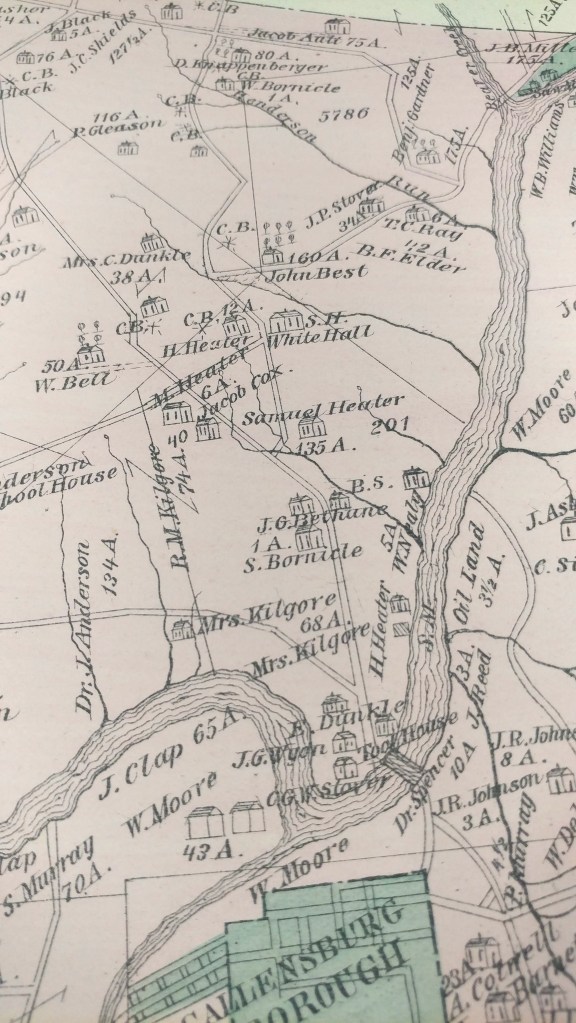
These historical county atlases provide a detailed snapshot of much of the United States during periods of great population expansion of the 19th and early 20th Century.
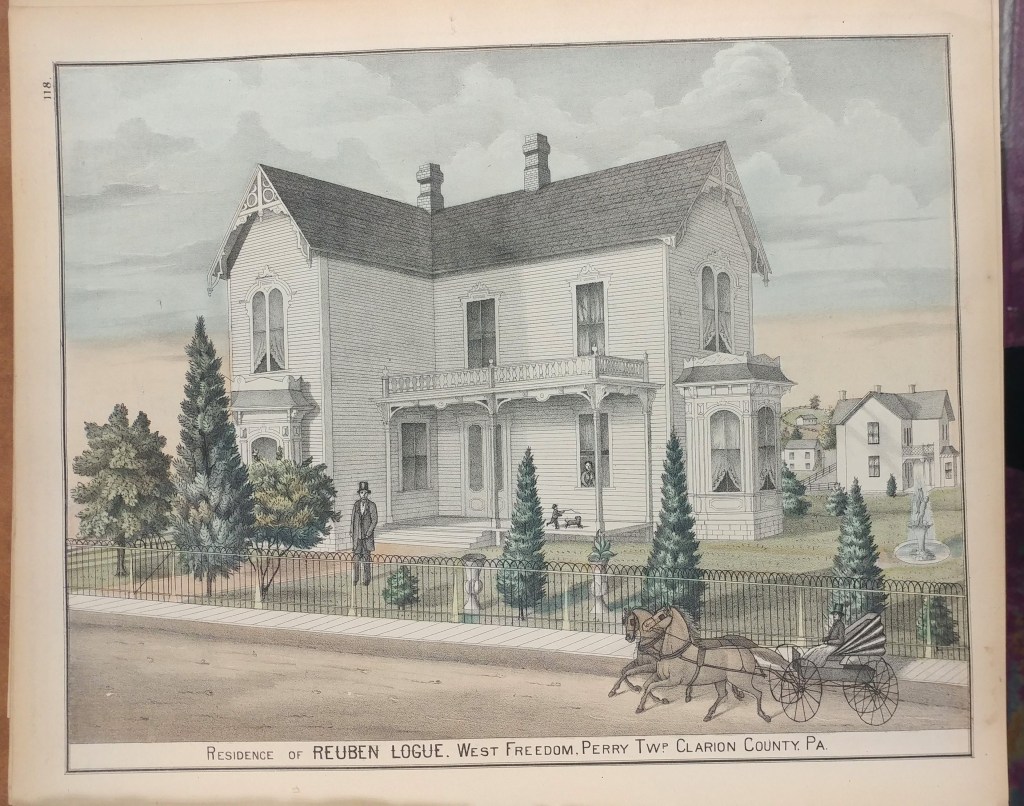
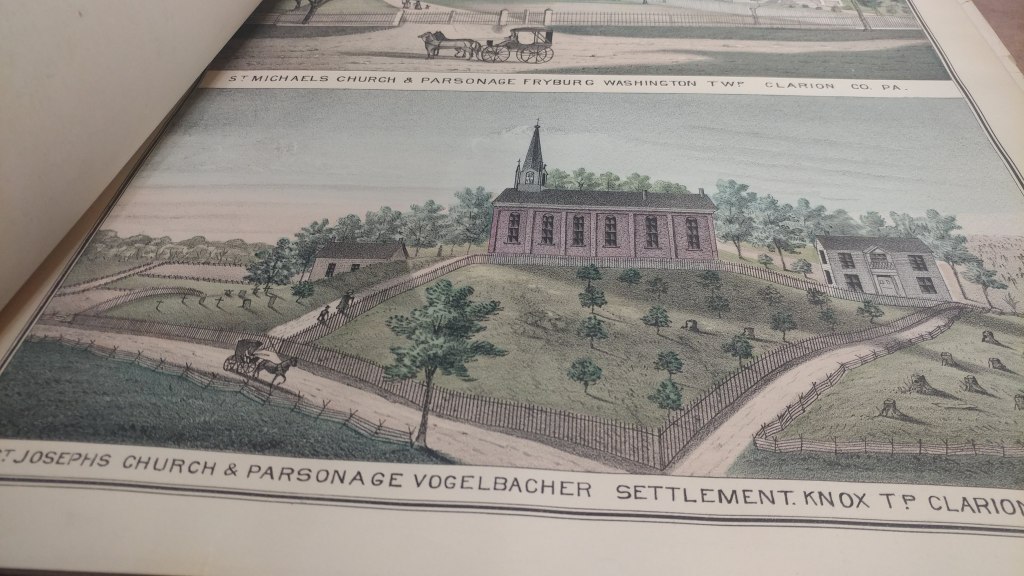
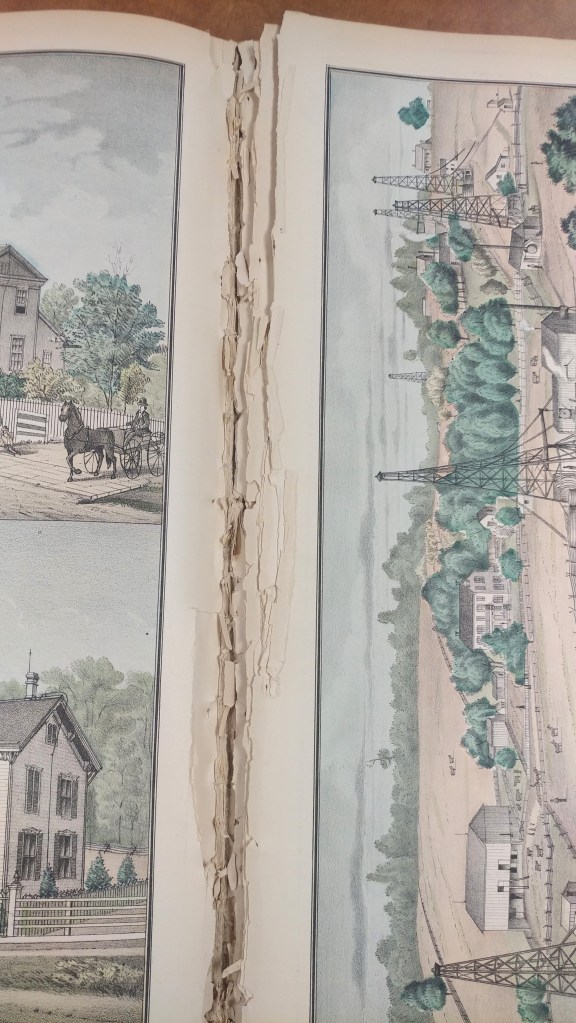
Preparation was often financed through support of local patrons who paid a fee to door-to-door salesmen. The atlases would then include patron directories and biographies, giving credit to this financial support. Many atlases include detailed illustrations of patrons and their homes, businesses and families. As in the example of this Clarion County, Pennsylvania atlas, the illustrations are numerous and beautiful.
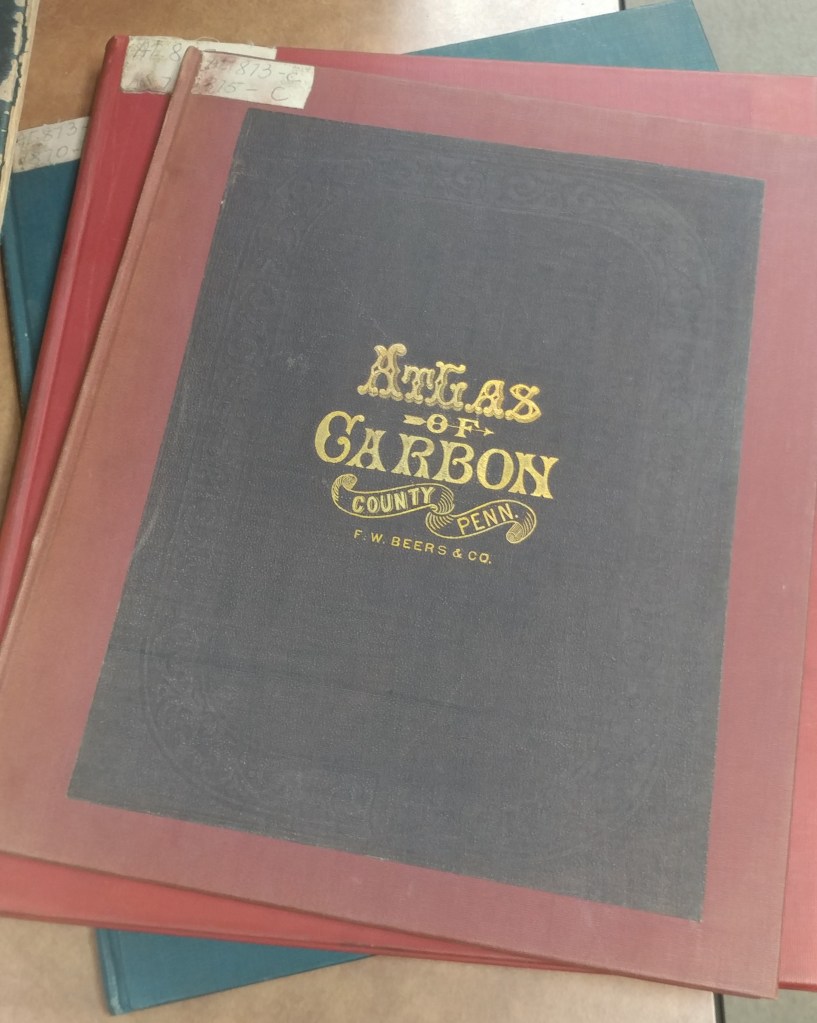
These atlases can be found in libraries across the country but the paper used wasn’t always the best quality. At the AGS Library even re-binding didn’t guarantee use of acid-free materials.
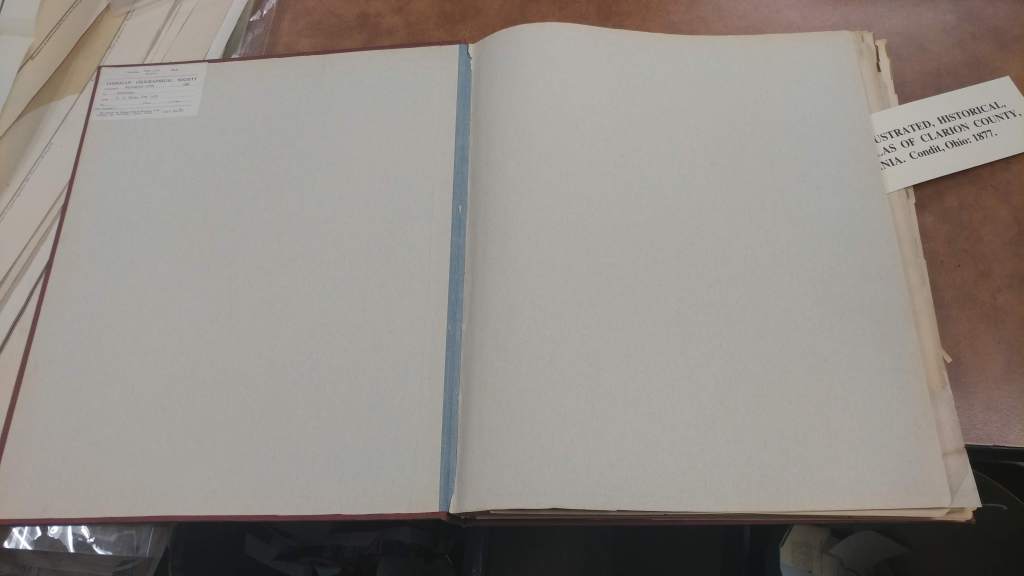
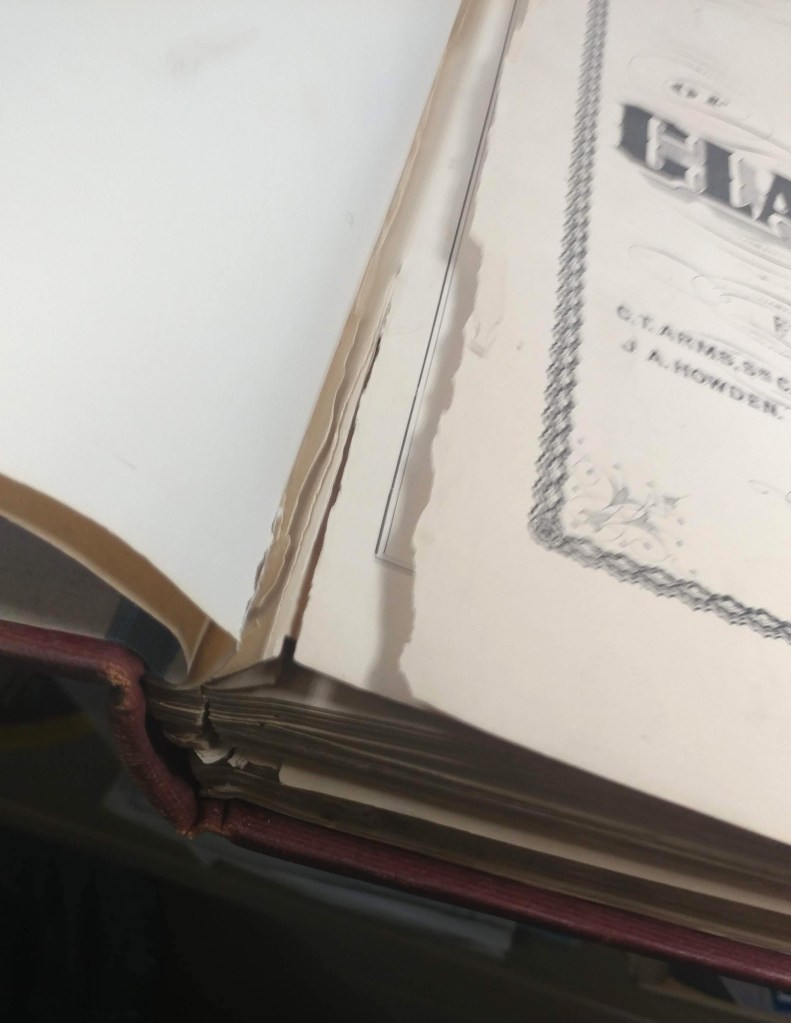
Scanning atlases is a way to provide increased access, preserve information and limit handling to avoid additional damage. At the AGS Library we have nearly 1,000 atlases of this type. Other libraries are also scanning their atlases and making them available to researchers.
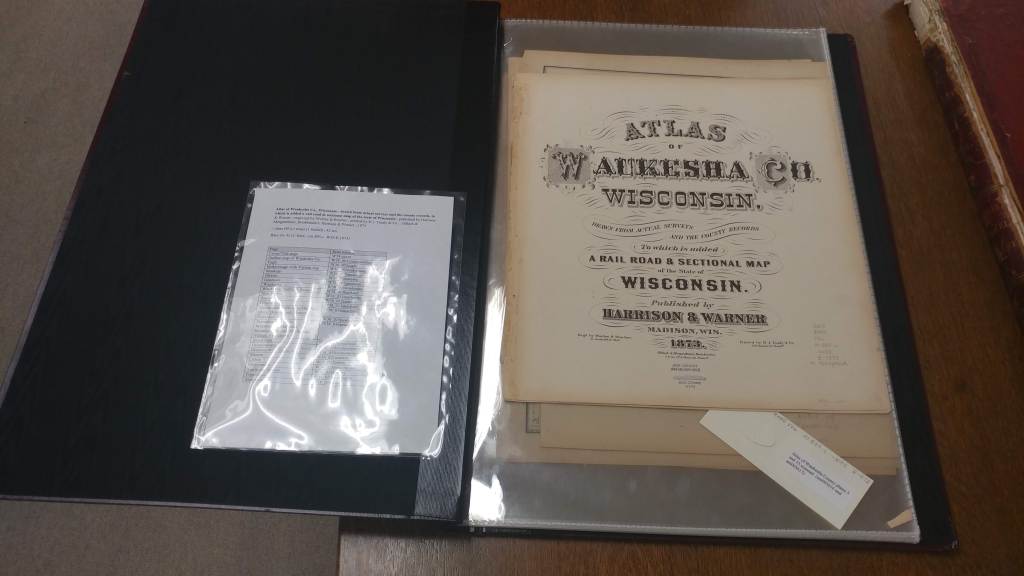
Atlas of Waukesha Co., Wisconsin : drawn from actual surveys and the county records, to which is added a rail road & sectional map of the state of Wisconsin / published by Harrison & Warner ; engraved by Worley & Bracher ; printed by H.J. Toudy & Co. ; Oldach & Mergenthaler, Bookbinders, 1873.
https://collections.lib.uwm.edu/digital/collection/agdm/id/3626/rec/2
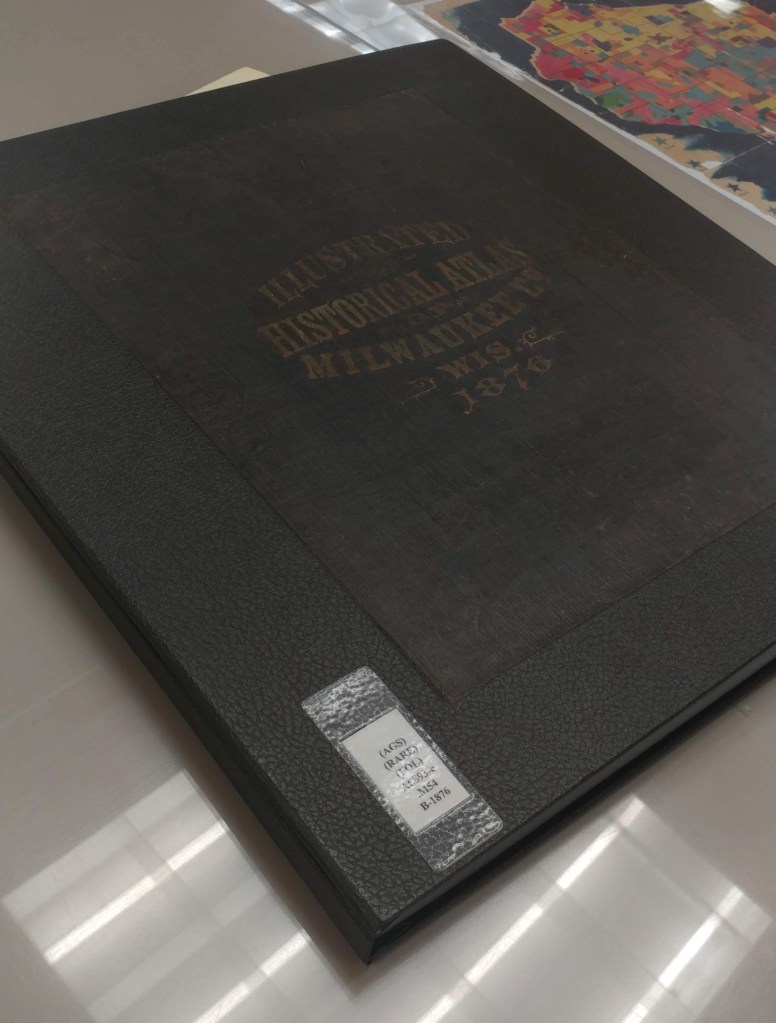
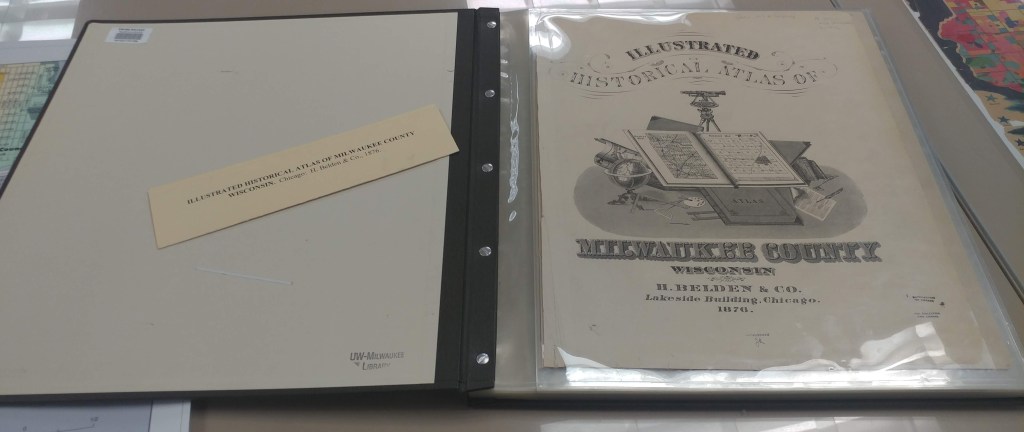
Illustrated historical atlas of Milwaukee County, Wisconsin / by H. Belden & Co., 1876.
https://collections.lib.uwm.edu/digital/collection/agdm/id/3746/rec/4
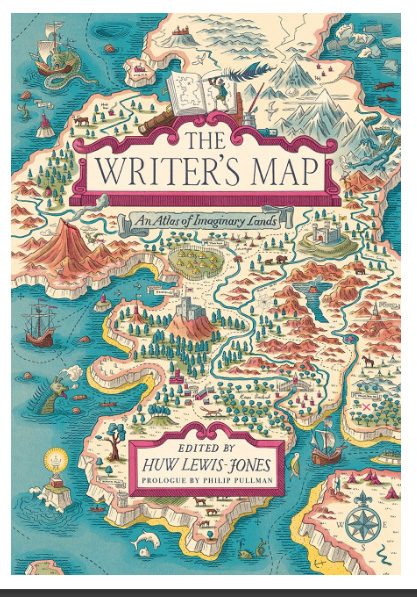
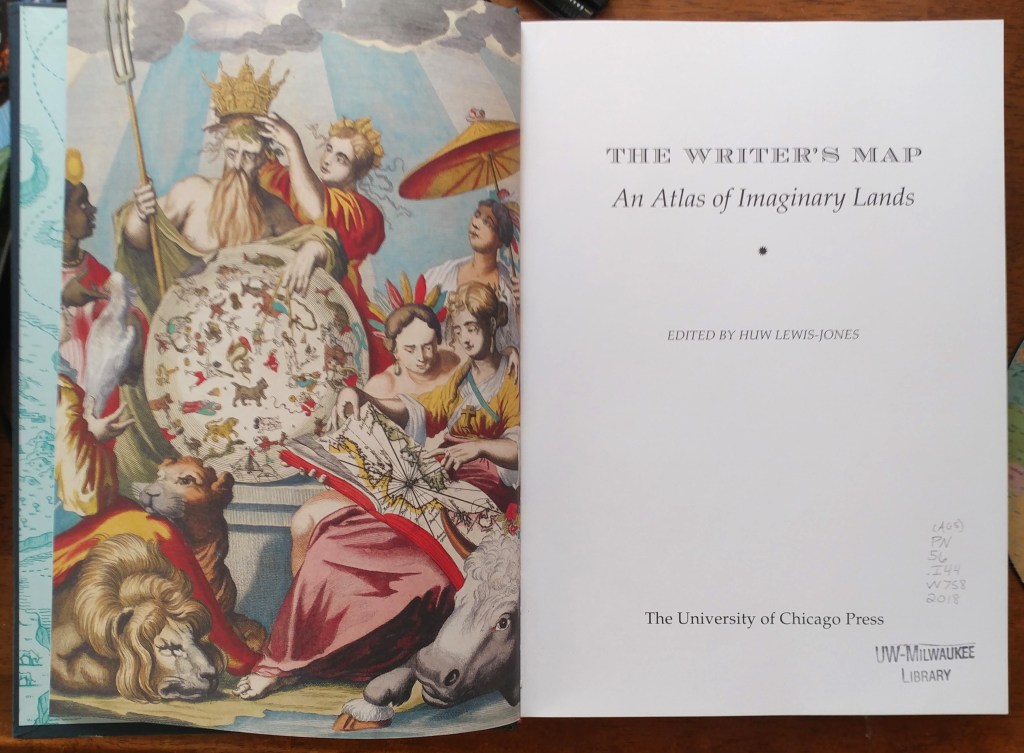
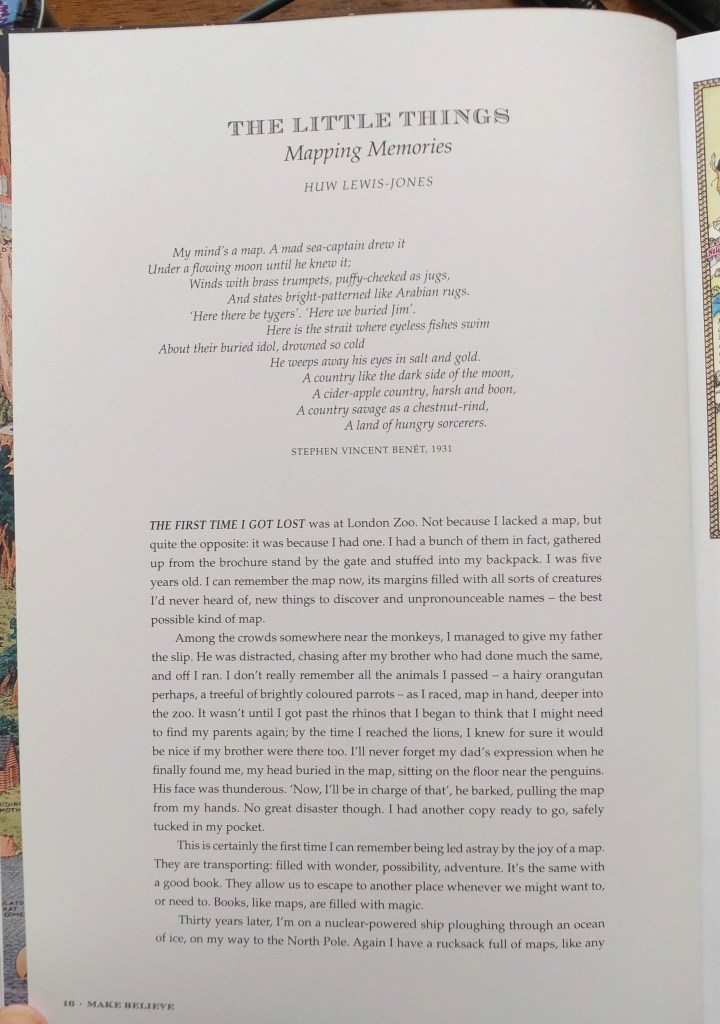
The Writer’s Map – an atlas for creative storytellers
by Angie Cope
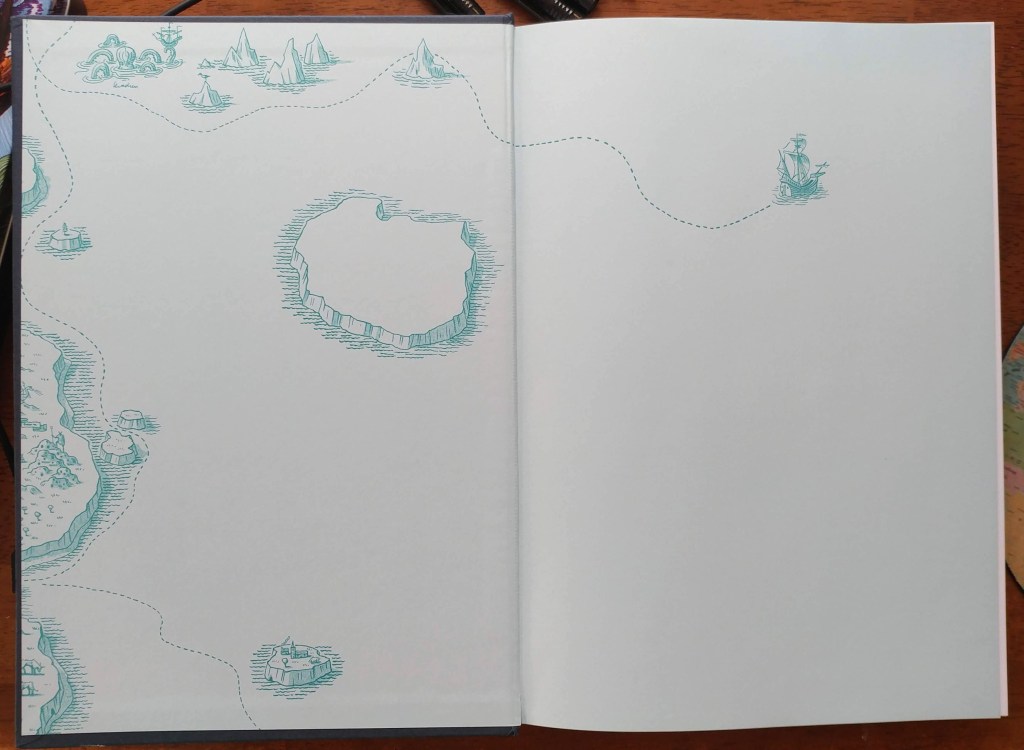
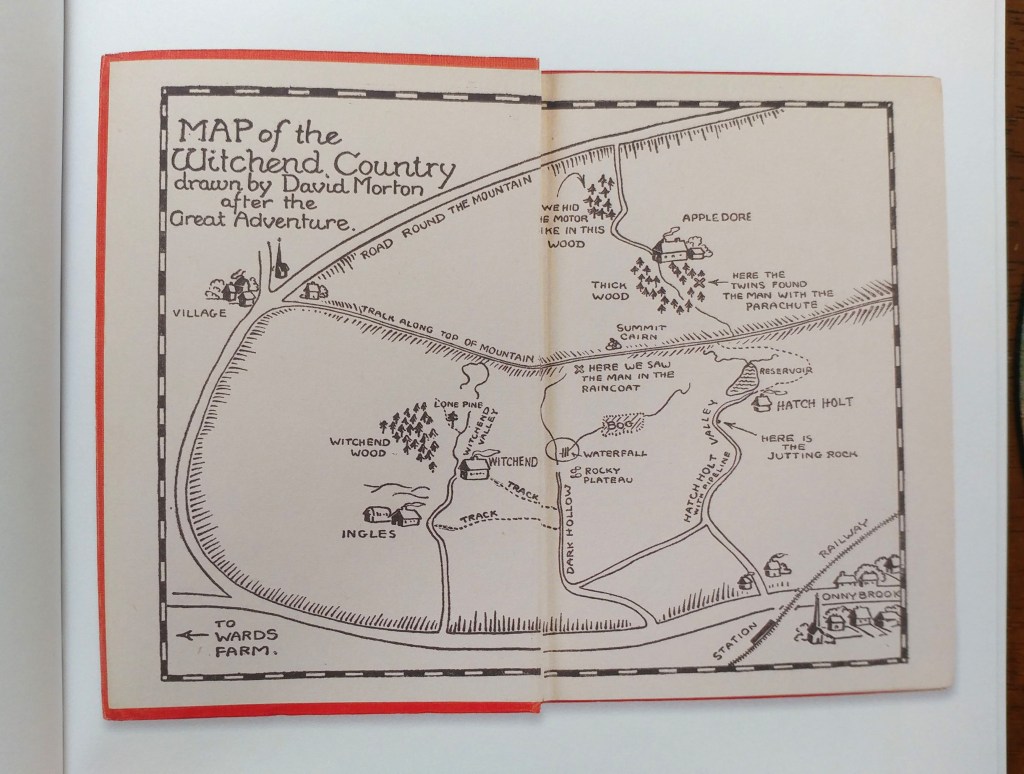
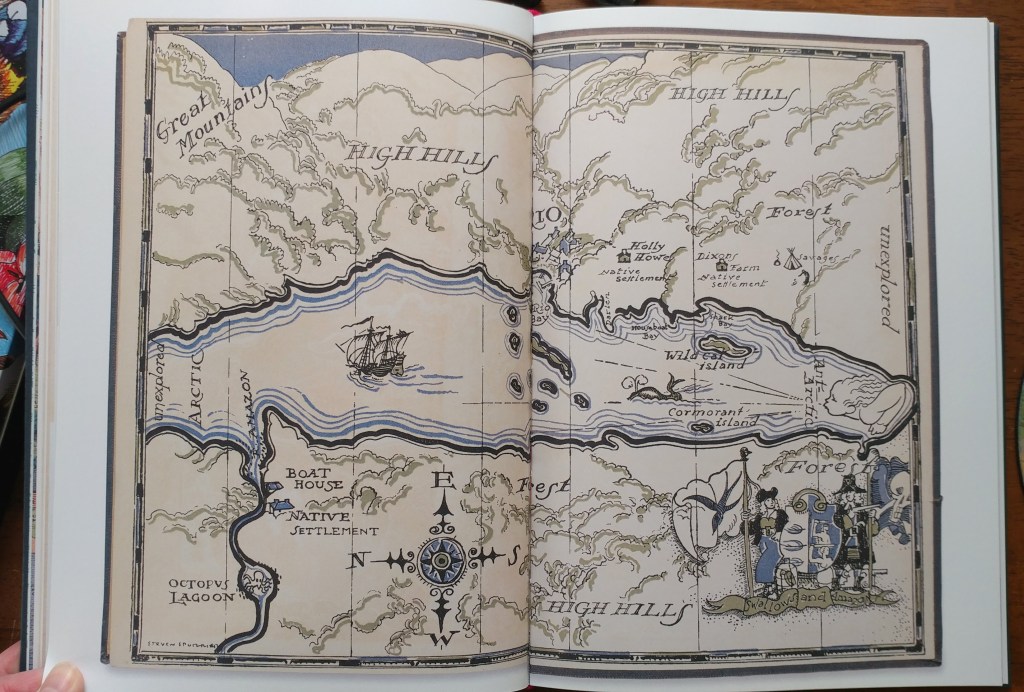
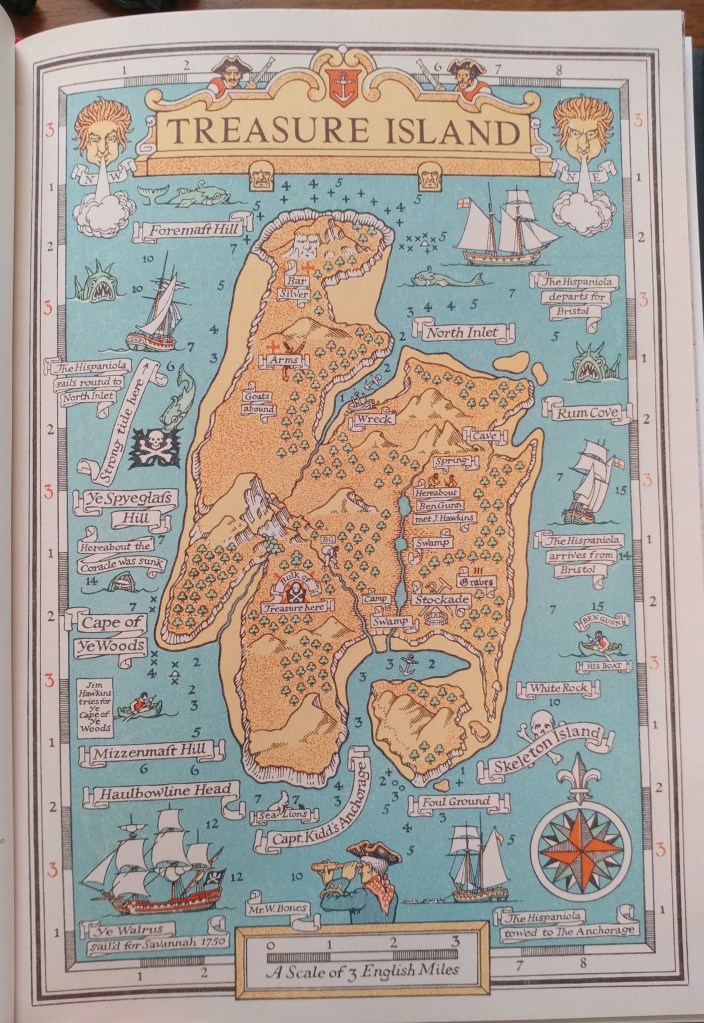
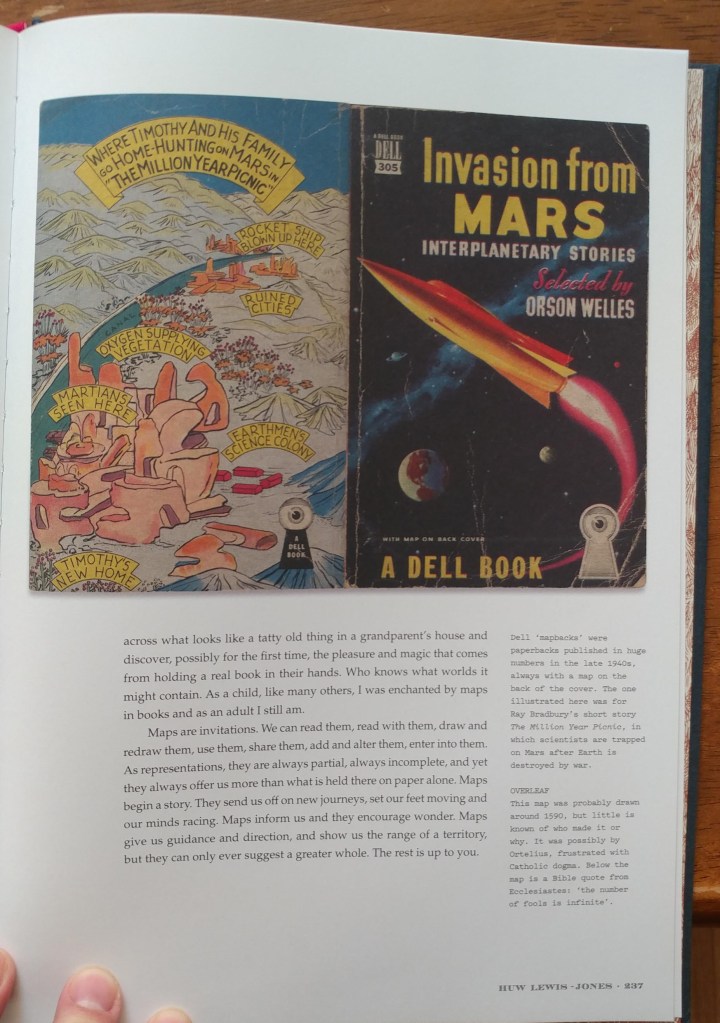
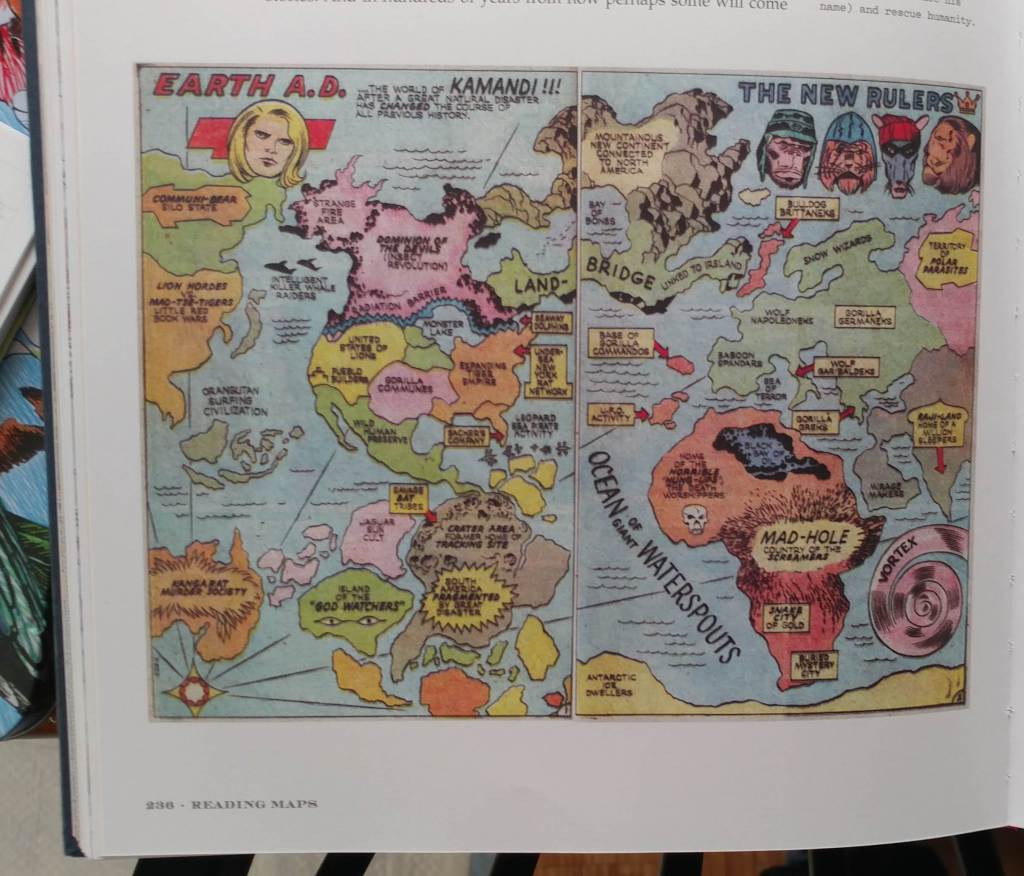
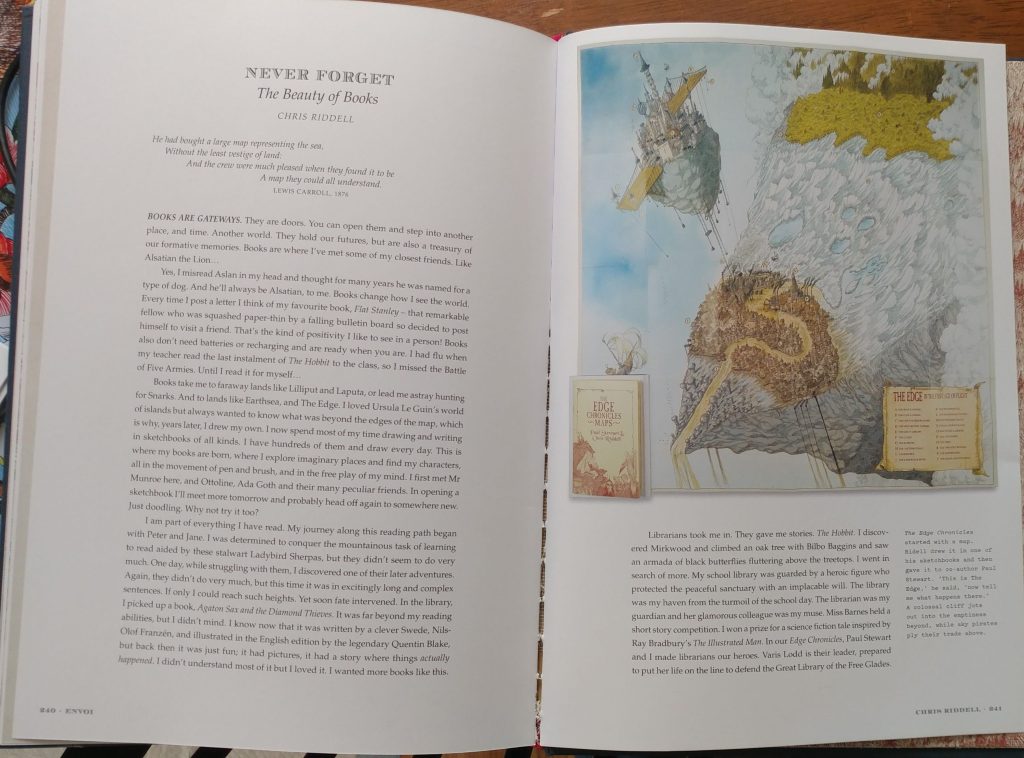
The Writer’s Map is an atlas of the journeys that our most creative storytellers have made throughout their lives. This magnificent collection encompasses not only the maps that appear in their books but also the many maps that have inspired them, the sketches that they used while writing, and others that simply sparked their curiosity.
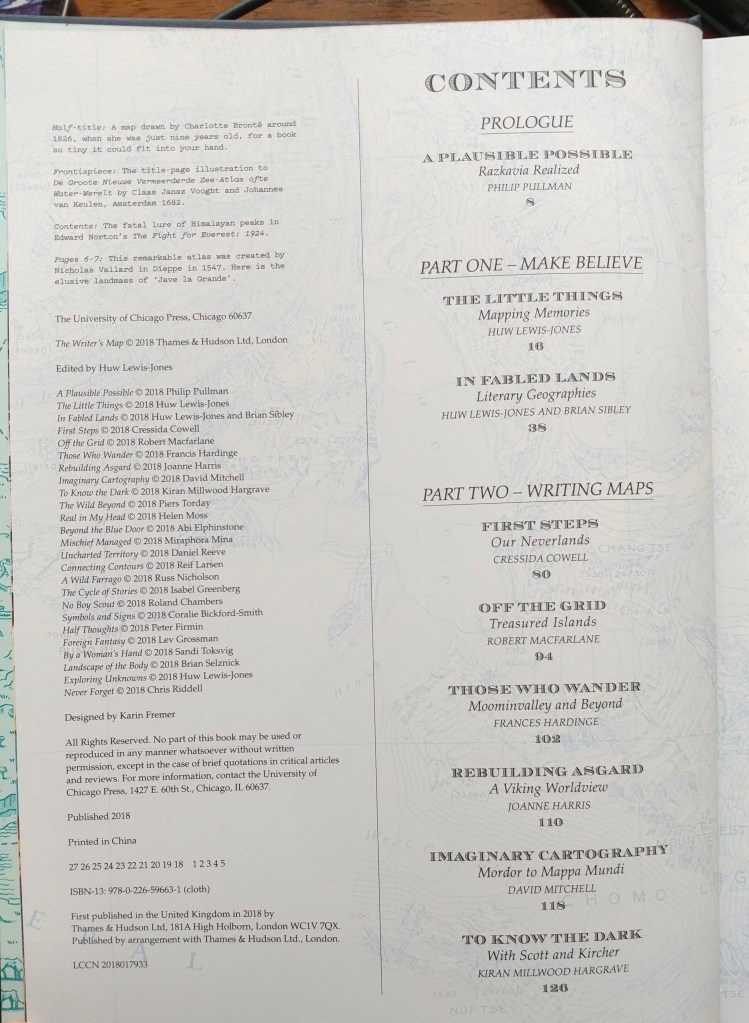
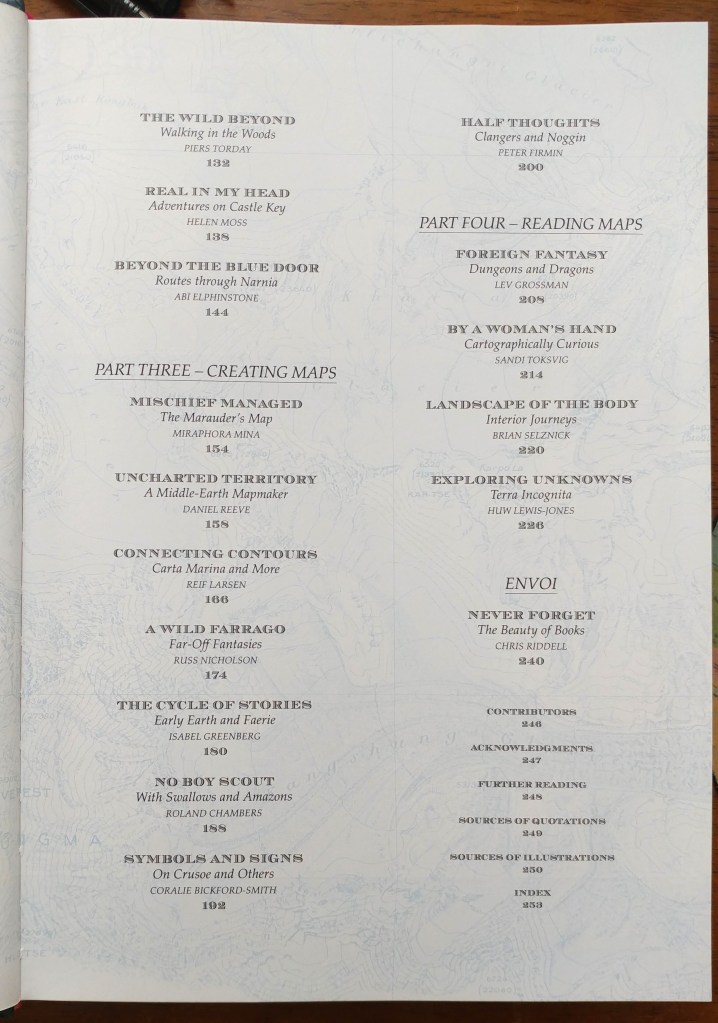
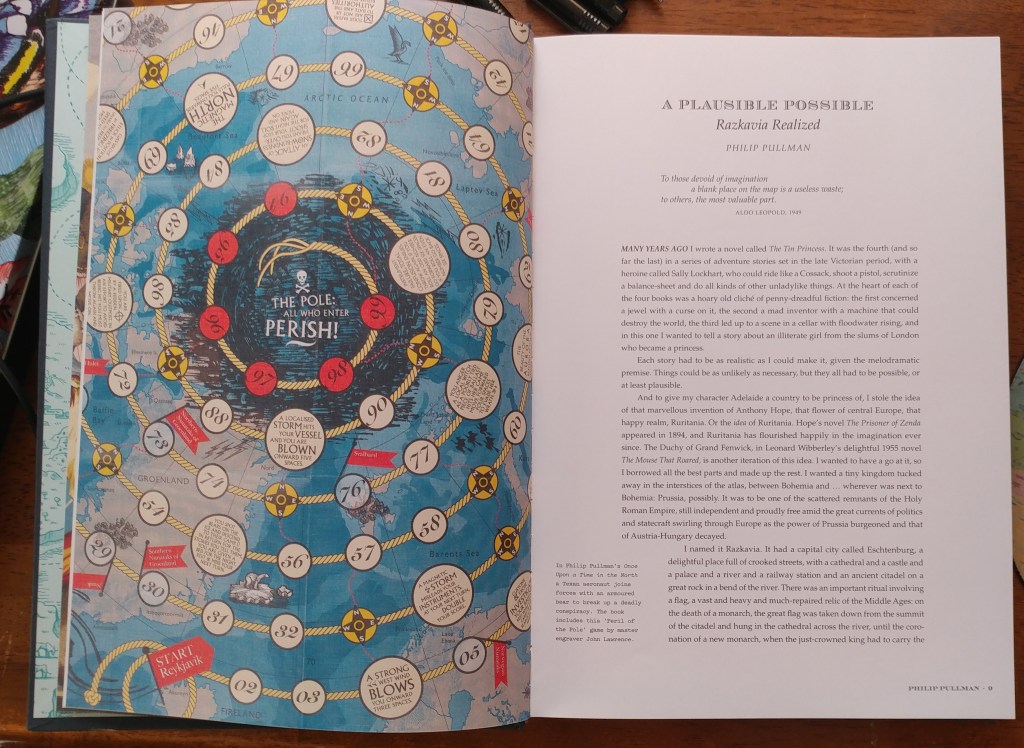
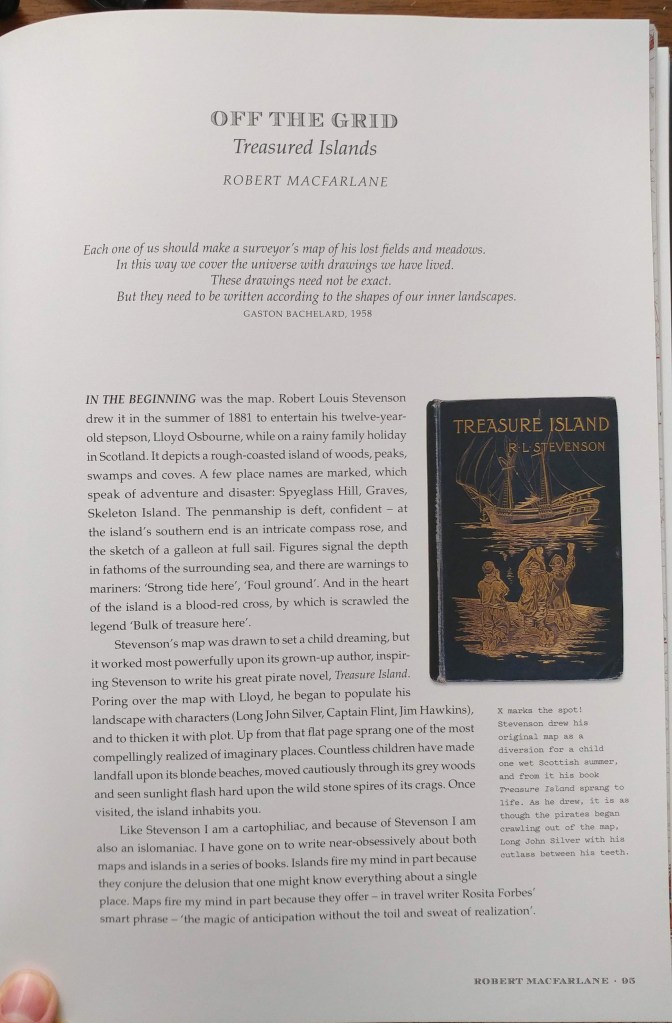
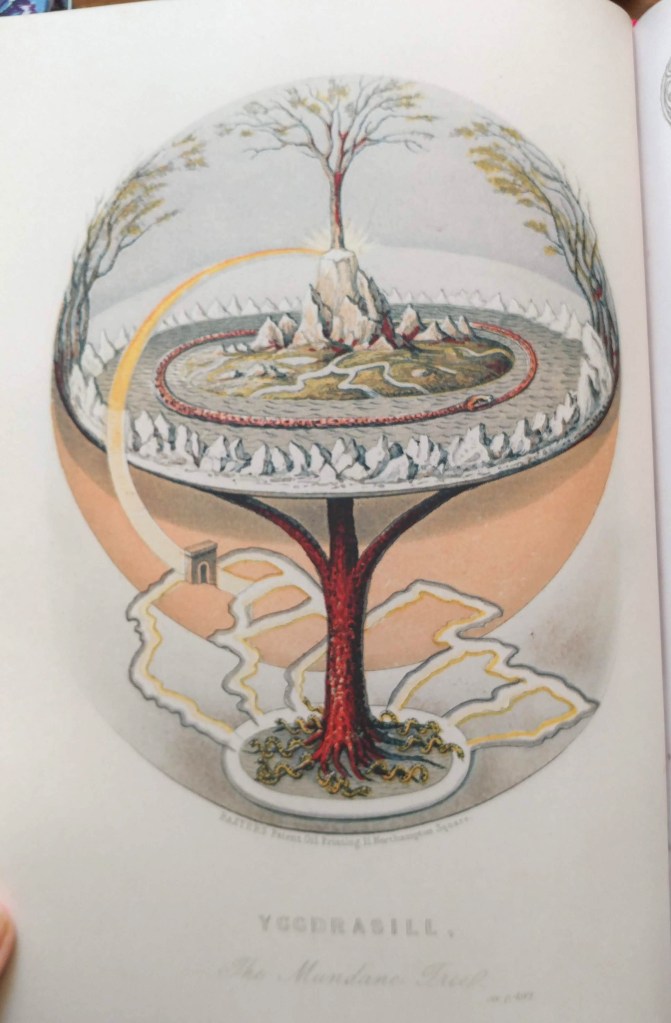
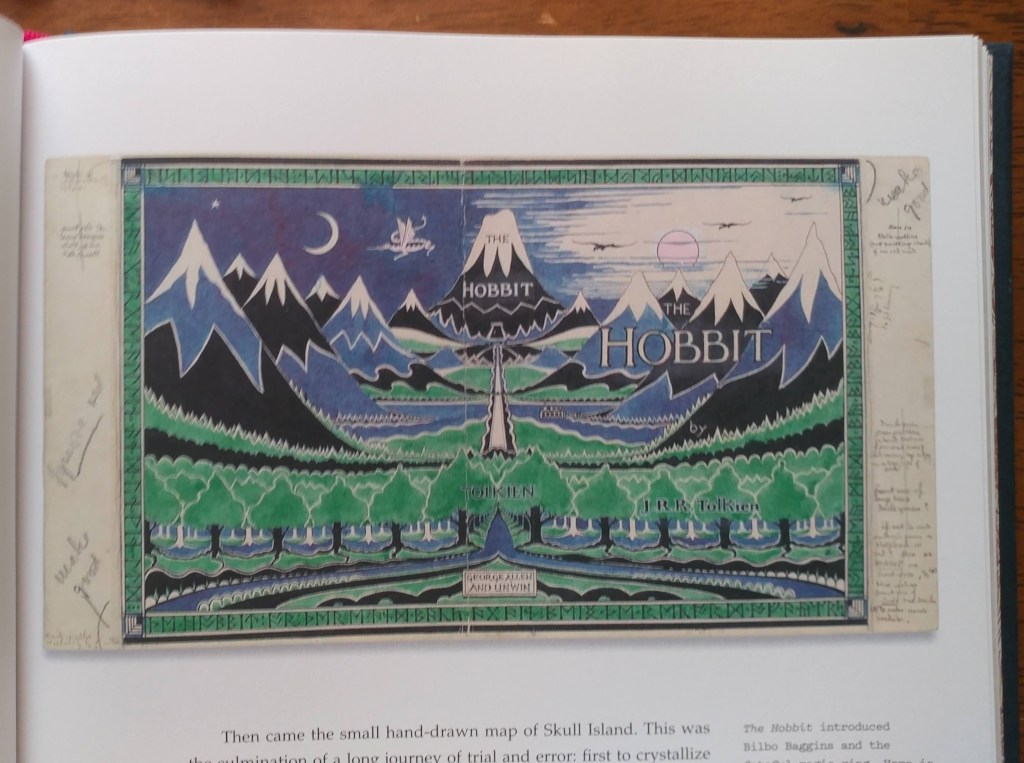
Philip Pullman recounts the experience of drawing a map as he set out on one of his early novels, The Tin Princess. Miraphora Mina recalls the creative challenge of drawing up ”The Marauder’s Map” for the Harry Potter films. David Mitchell leads us to the Mappa Mundi by way of Cloud Atlas and his own sketch maps. Robert Macfarlane reflects on the cartophilia that has informed his evocative nature writing, which was set off by Robert Louis Stevenson and his map of Treasure Island. Joanne Harris tells of her fascination with Norse maps of the universe. Reif Larsen writes about our dependence on GPS and the impulse to map our experience. Daniel Reeve describes drawing maps and charts for The Hobbit film trilogy. This exquisitely crafted and illustrated atlas explores these and so many more of the maps writers create and are inspired by—some real, some imagined—in both words and images.
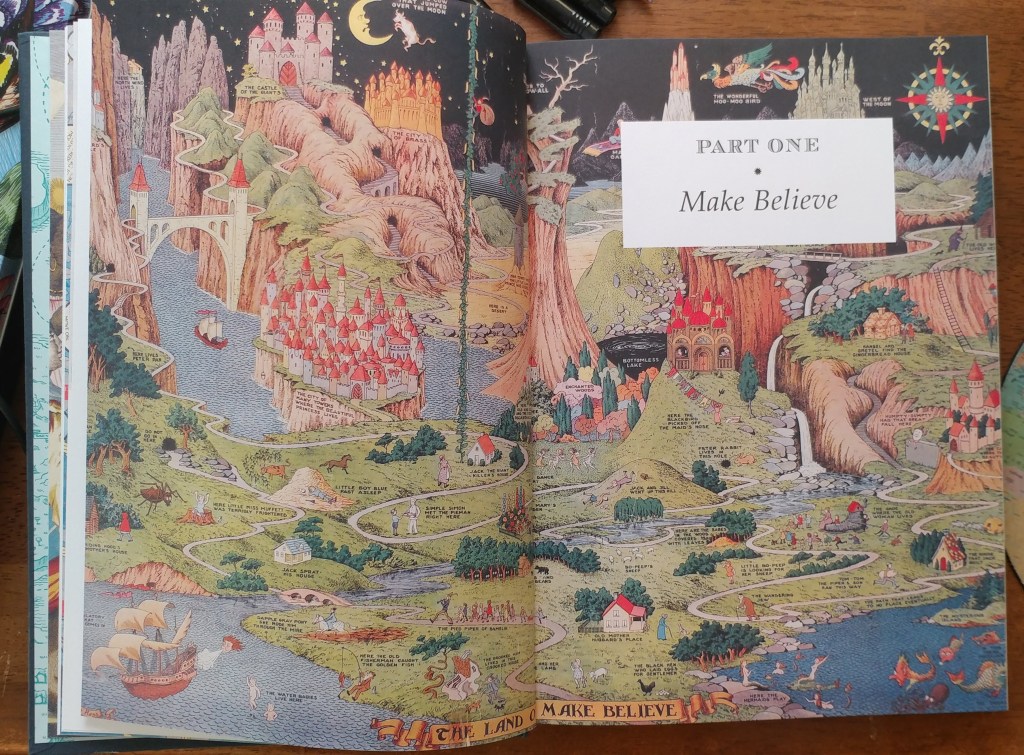
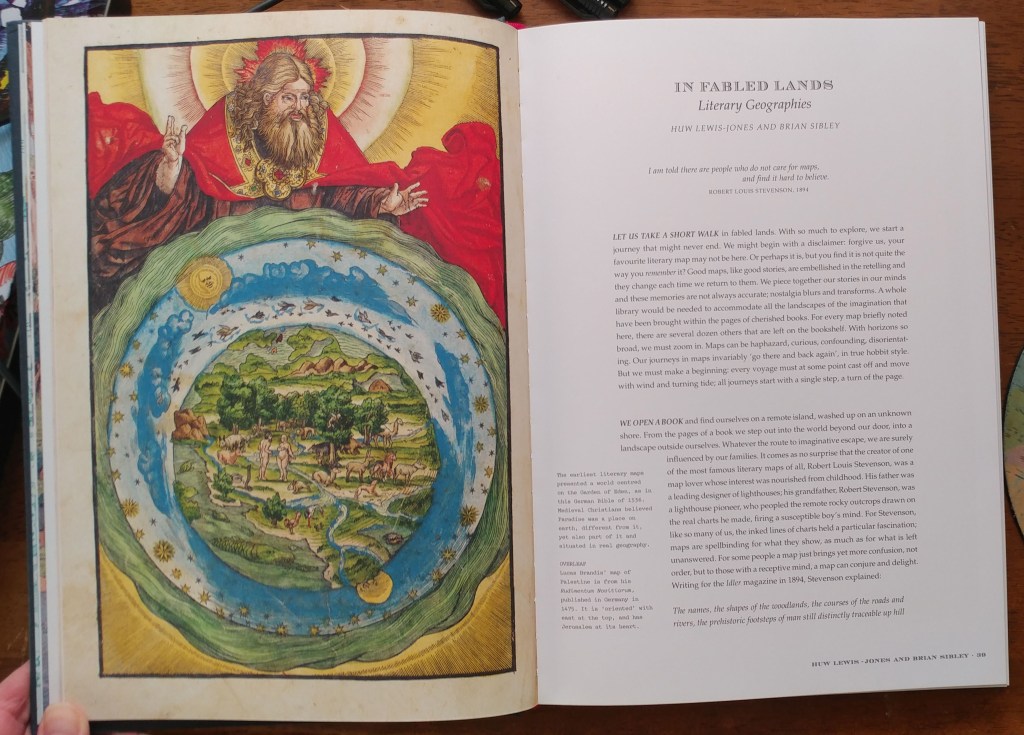
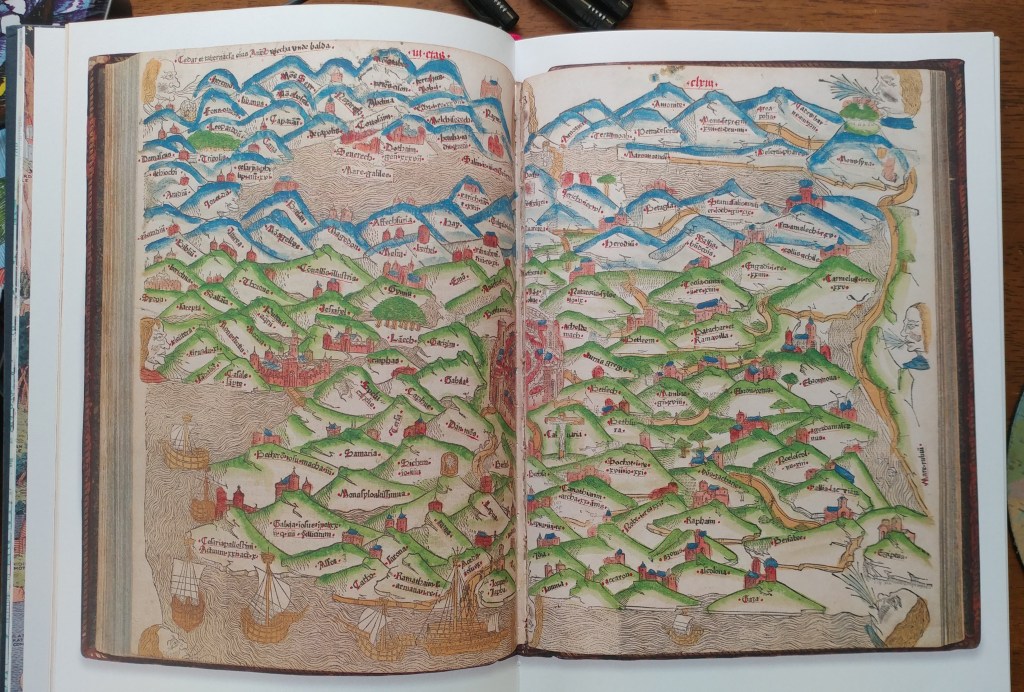
Amid a cornucopia of 167 full-color images, we find here maps of the world as envisaged in medieval times, as well as maps of adventure, sci-fi and fantasy, nursery rhymes, literary classics, and collectible comics. An enchanting visual and verbal journey, The Writer’s Map will be irresistible for lovers of maps, literature, and memories—and anyone prone to flights of the imagination.
Huw Lewis-Jones is a historian of exploration with a PhD from the University of Cambridge. He was formerly curator at the Scott Polar Research Institute, Cambridge, and the National Maritime Museum, London. His books include Arctic, Ocean Portraits, In Search of theSouth Pole, The Conquest of Everest, The Crossing of Antarctica, and Across the Arctic Ocean. Most recently, he is also coauthor of the internationally bestselling Explorers’ Sketchbooks.
October Pop-up Exhibit
By Lauren Maddox
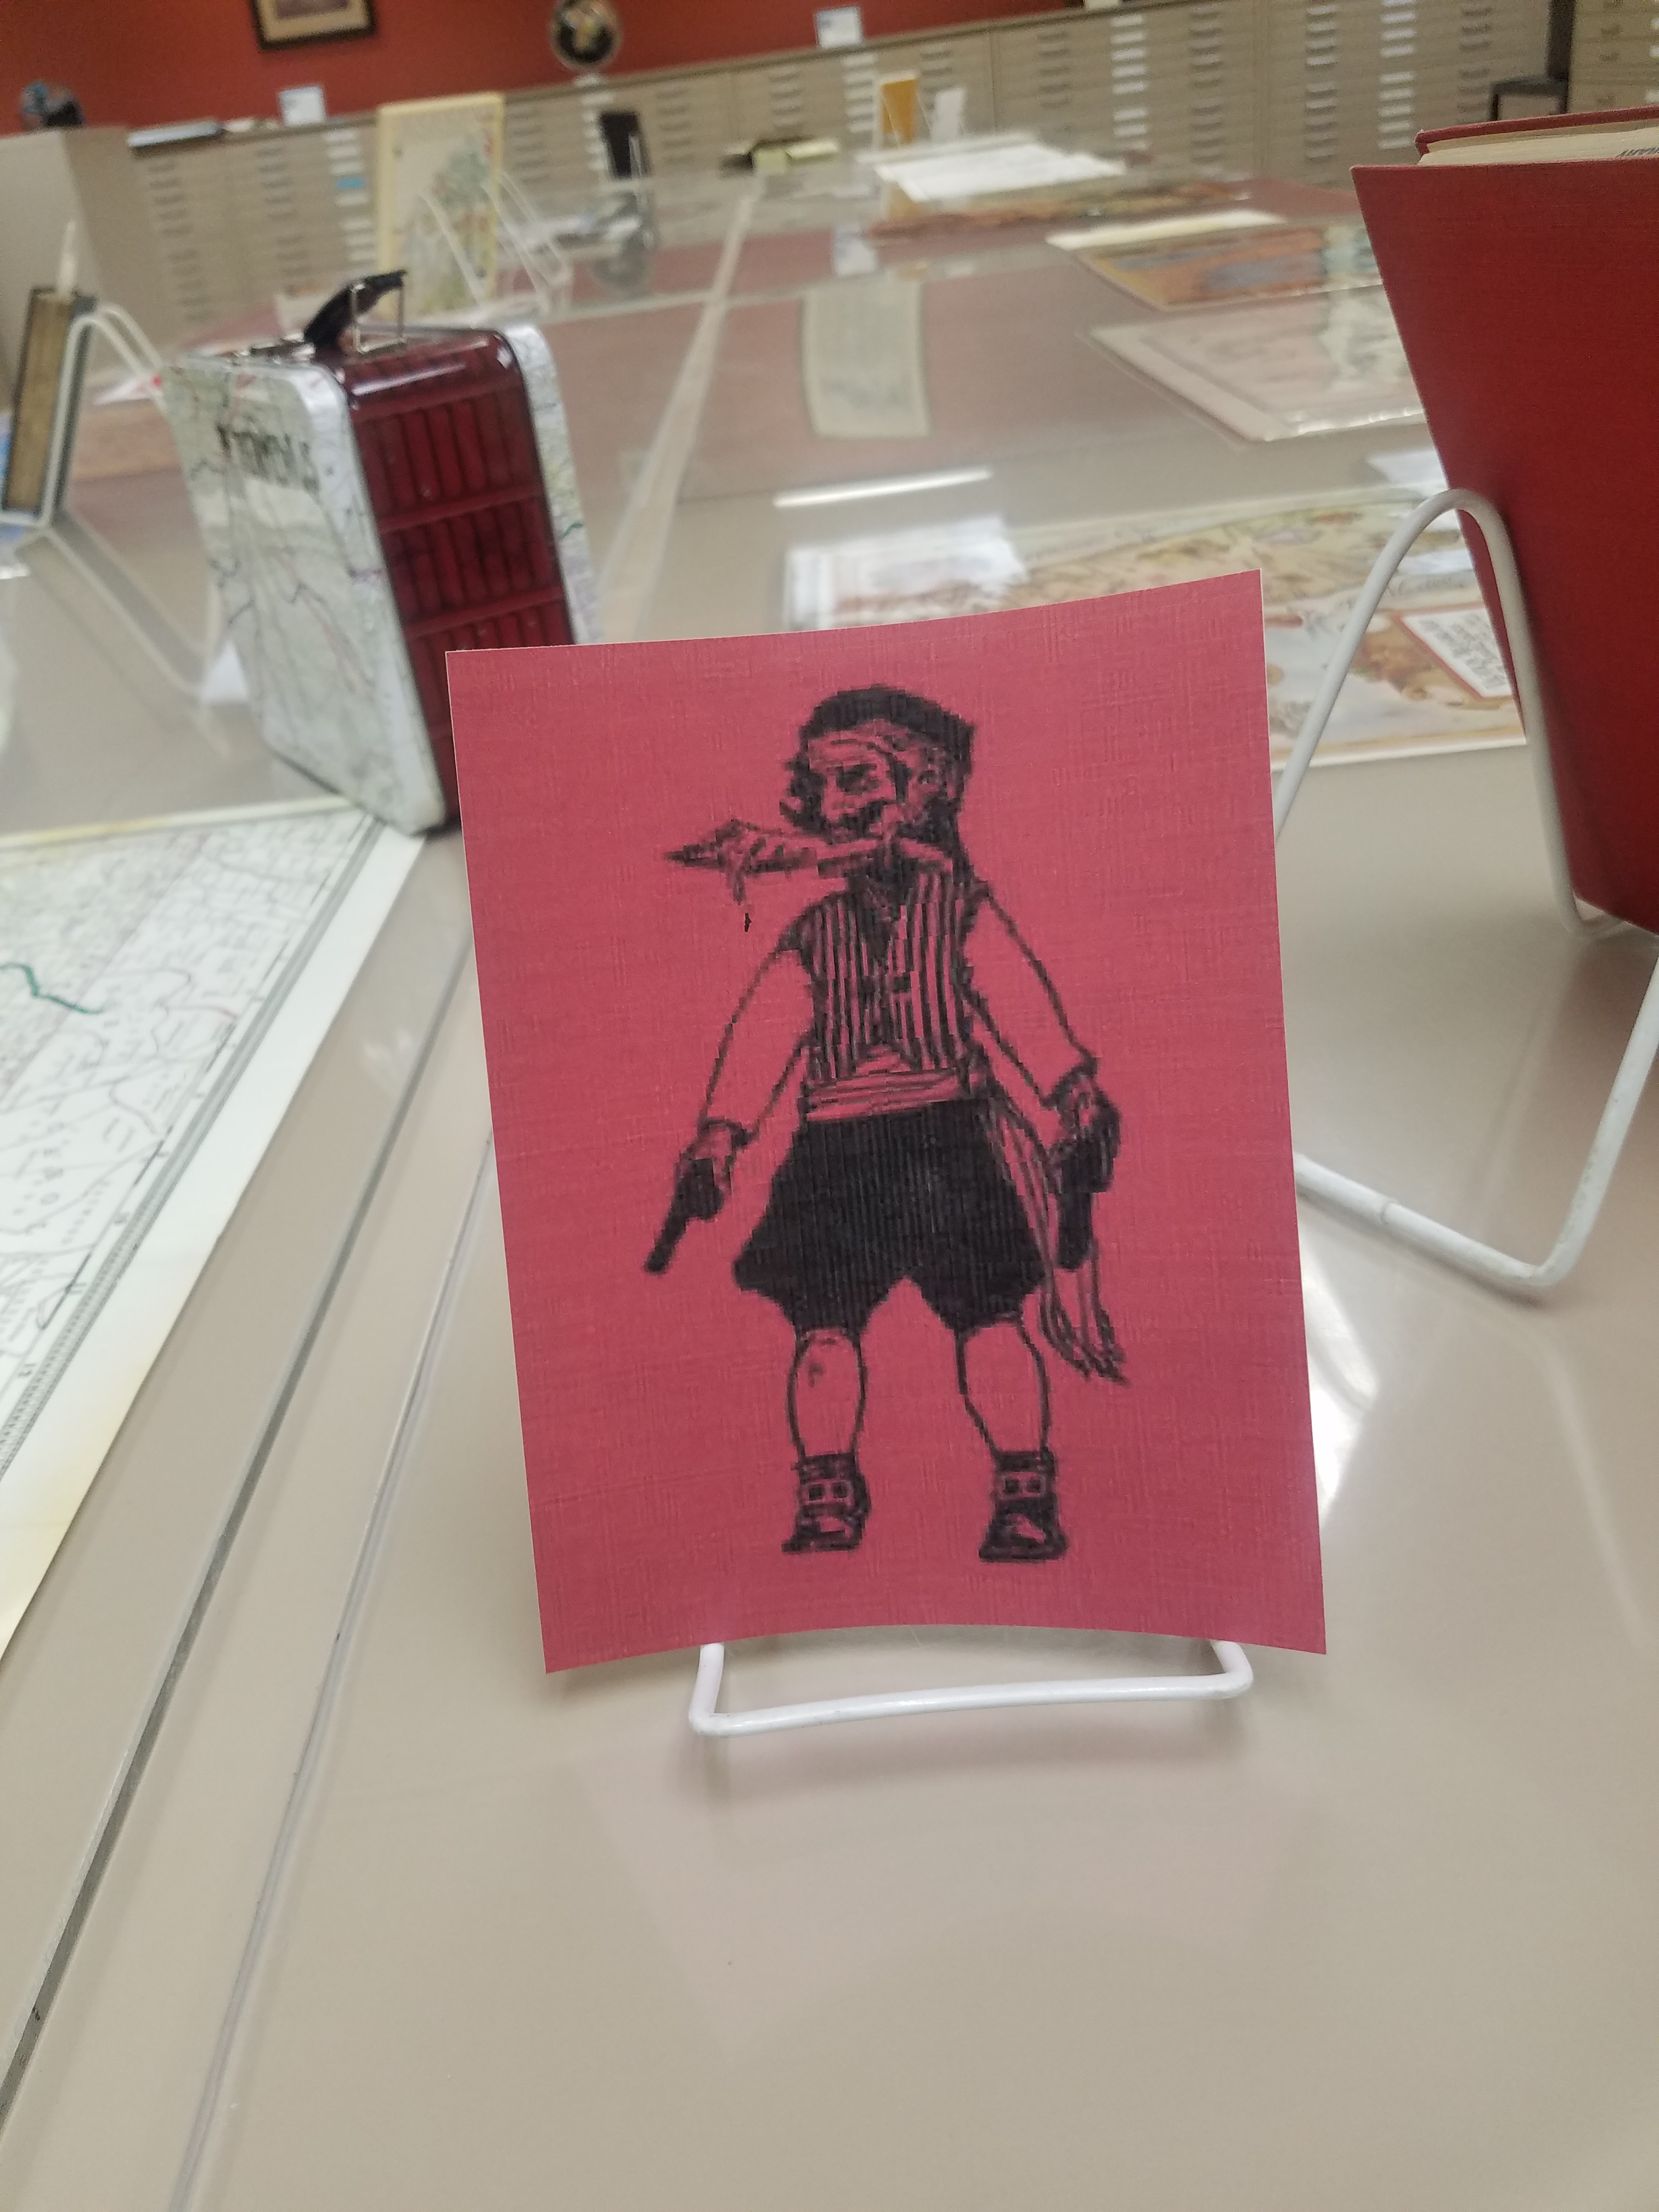
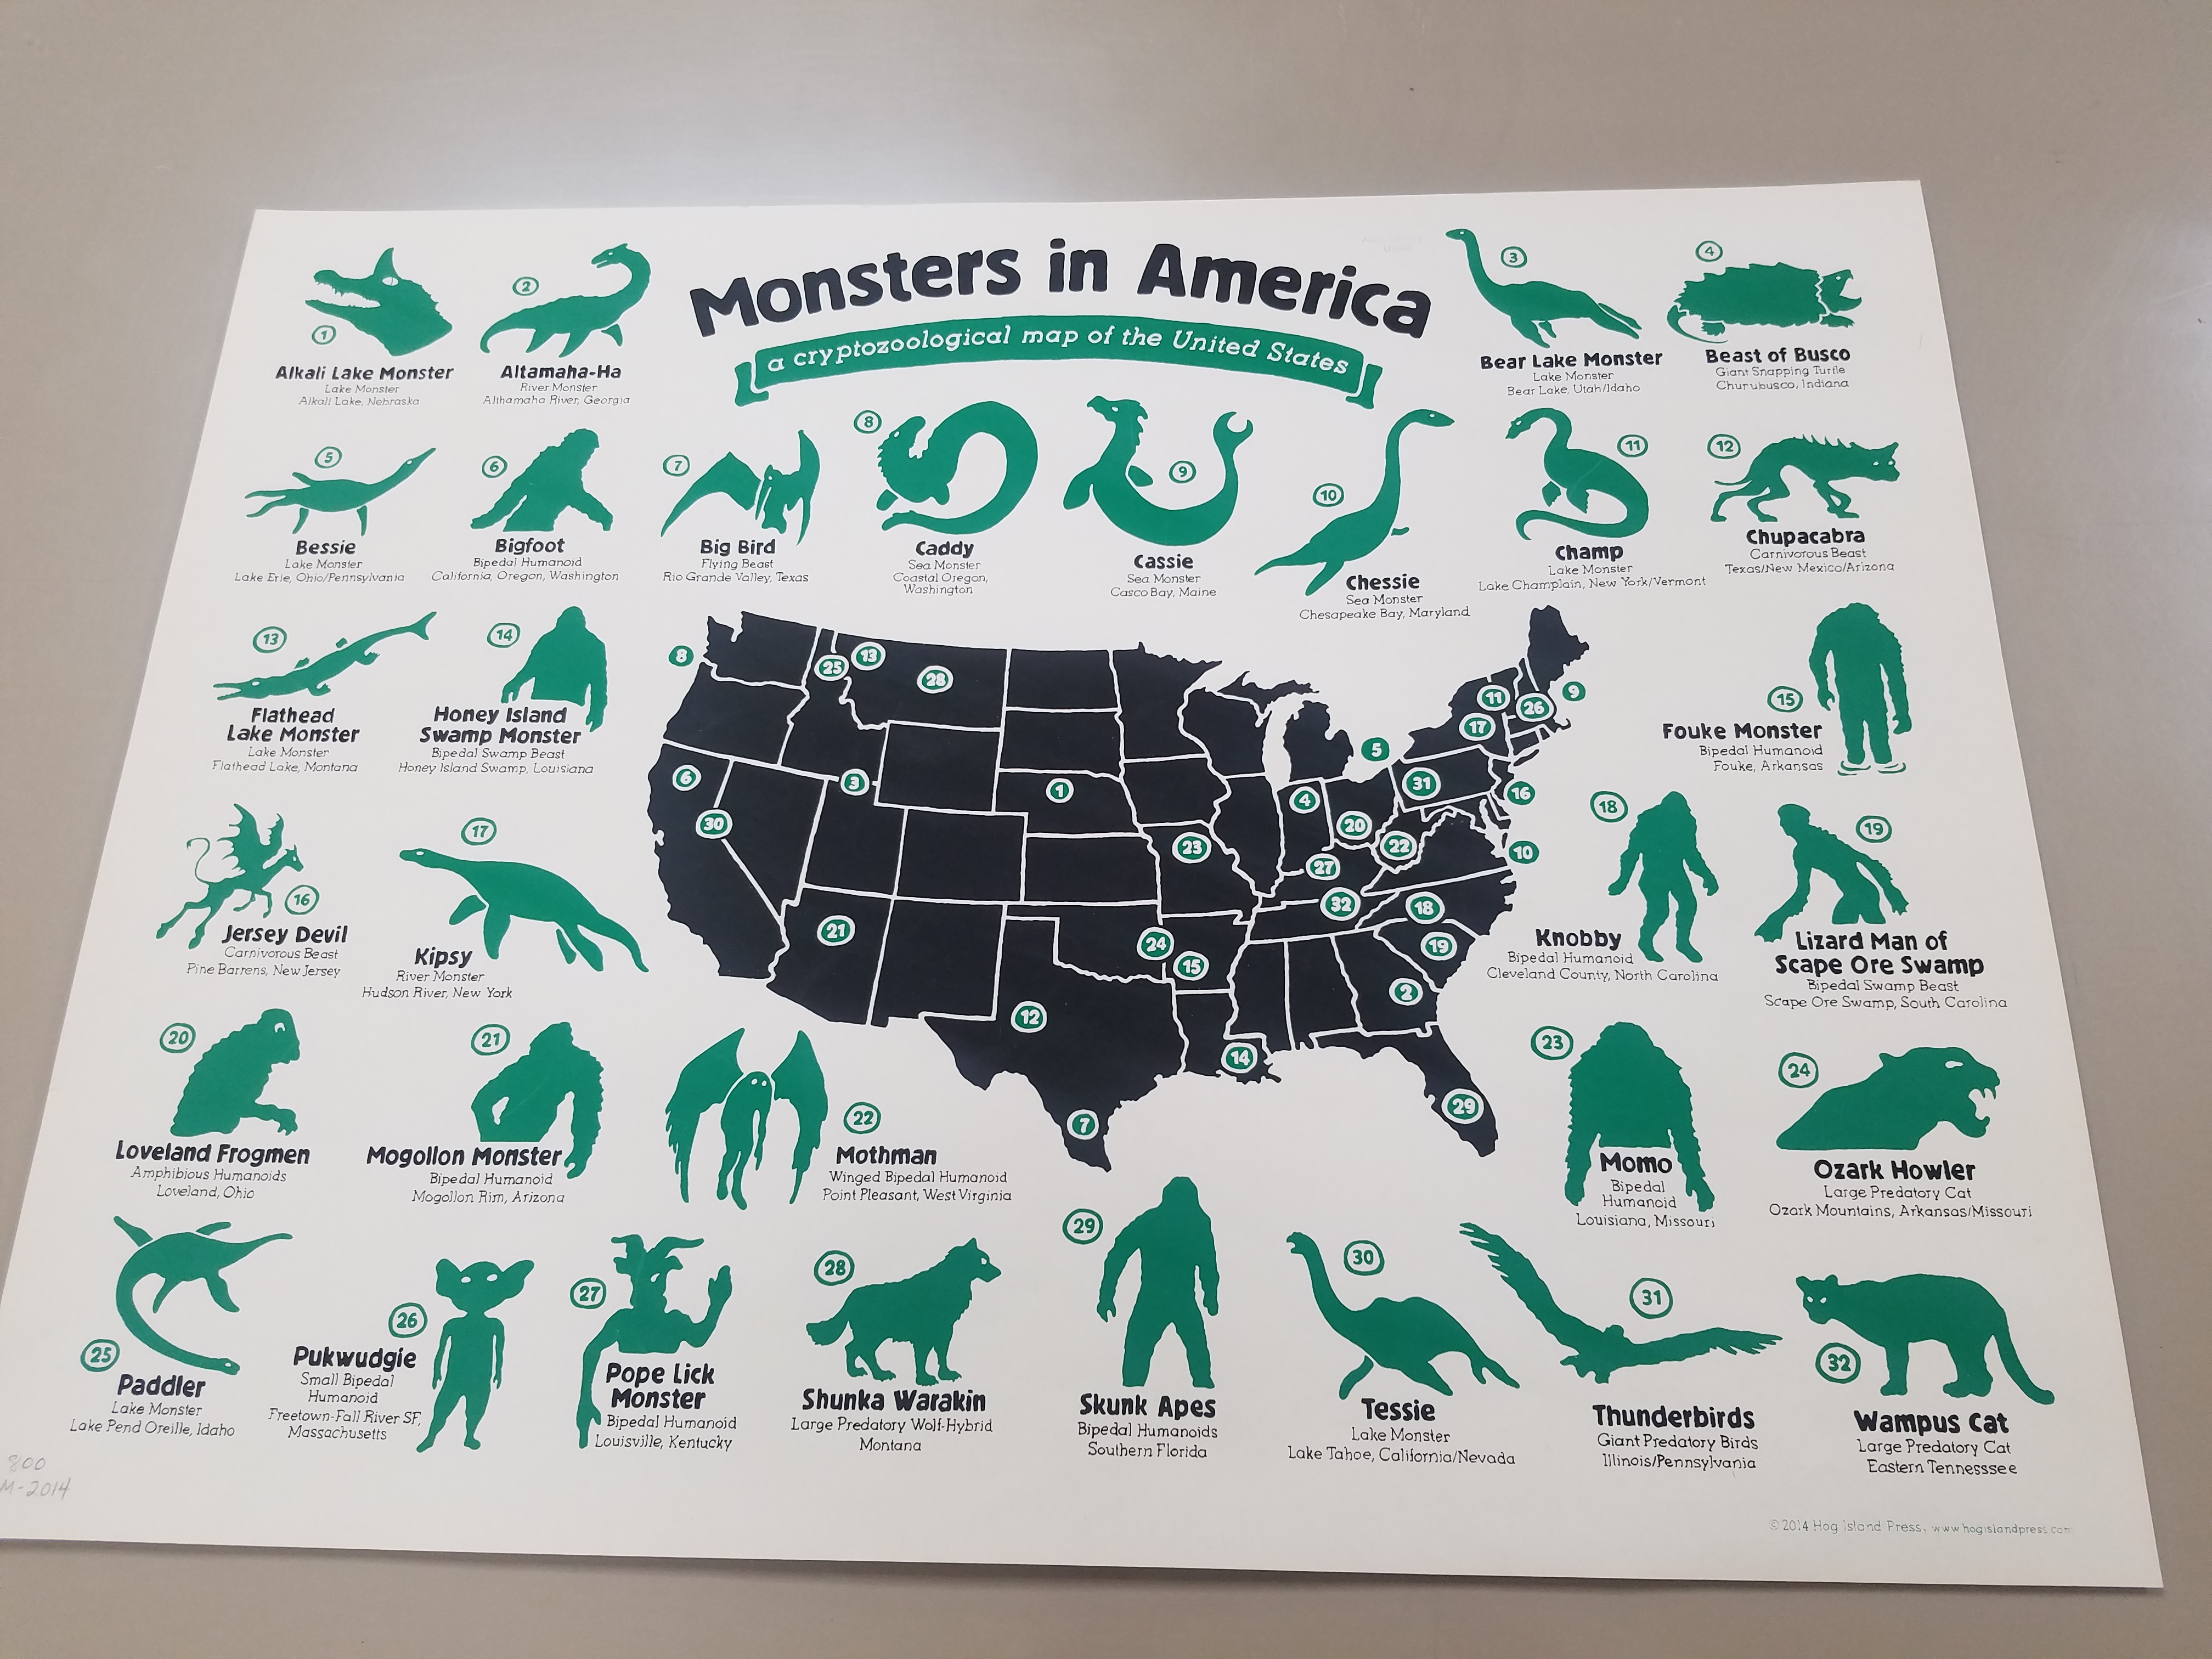
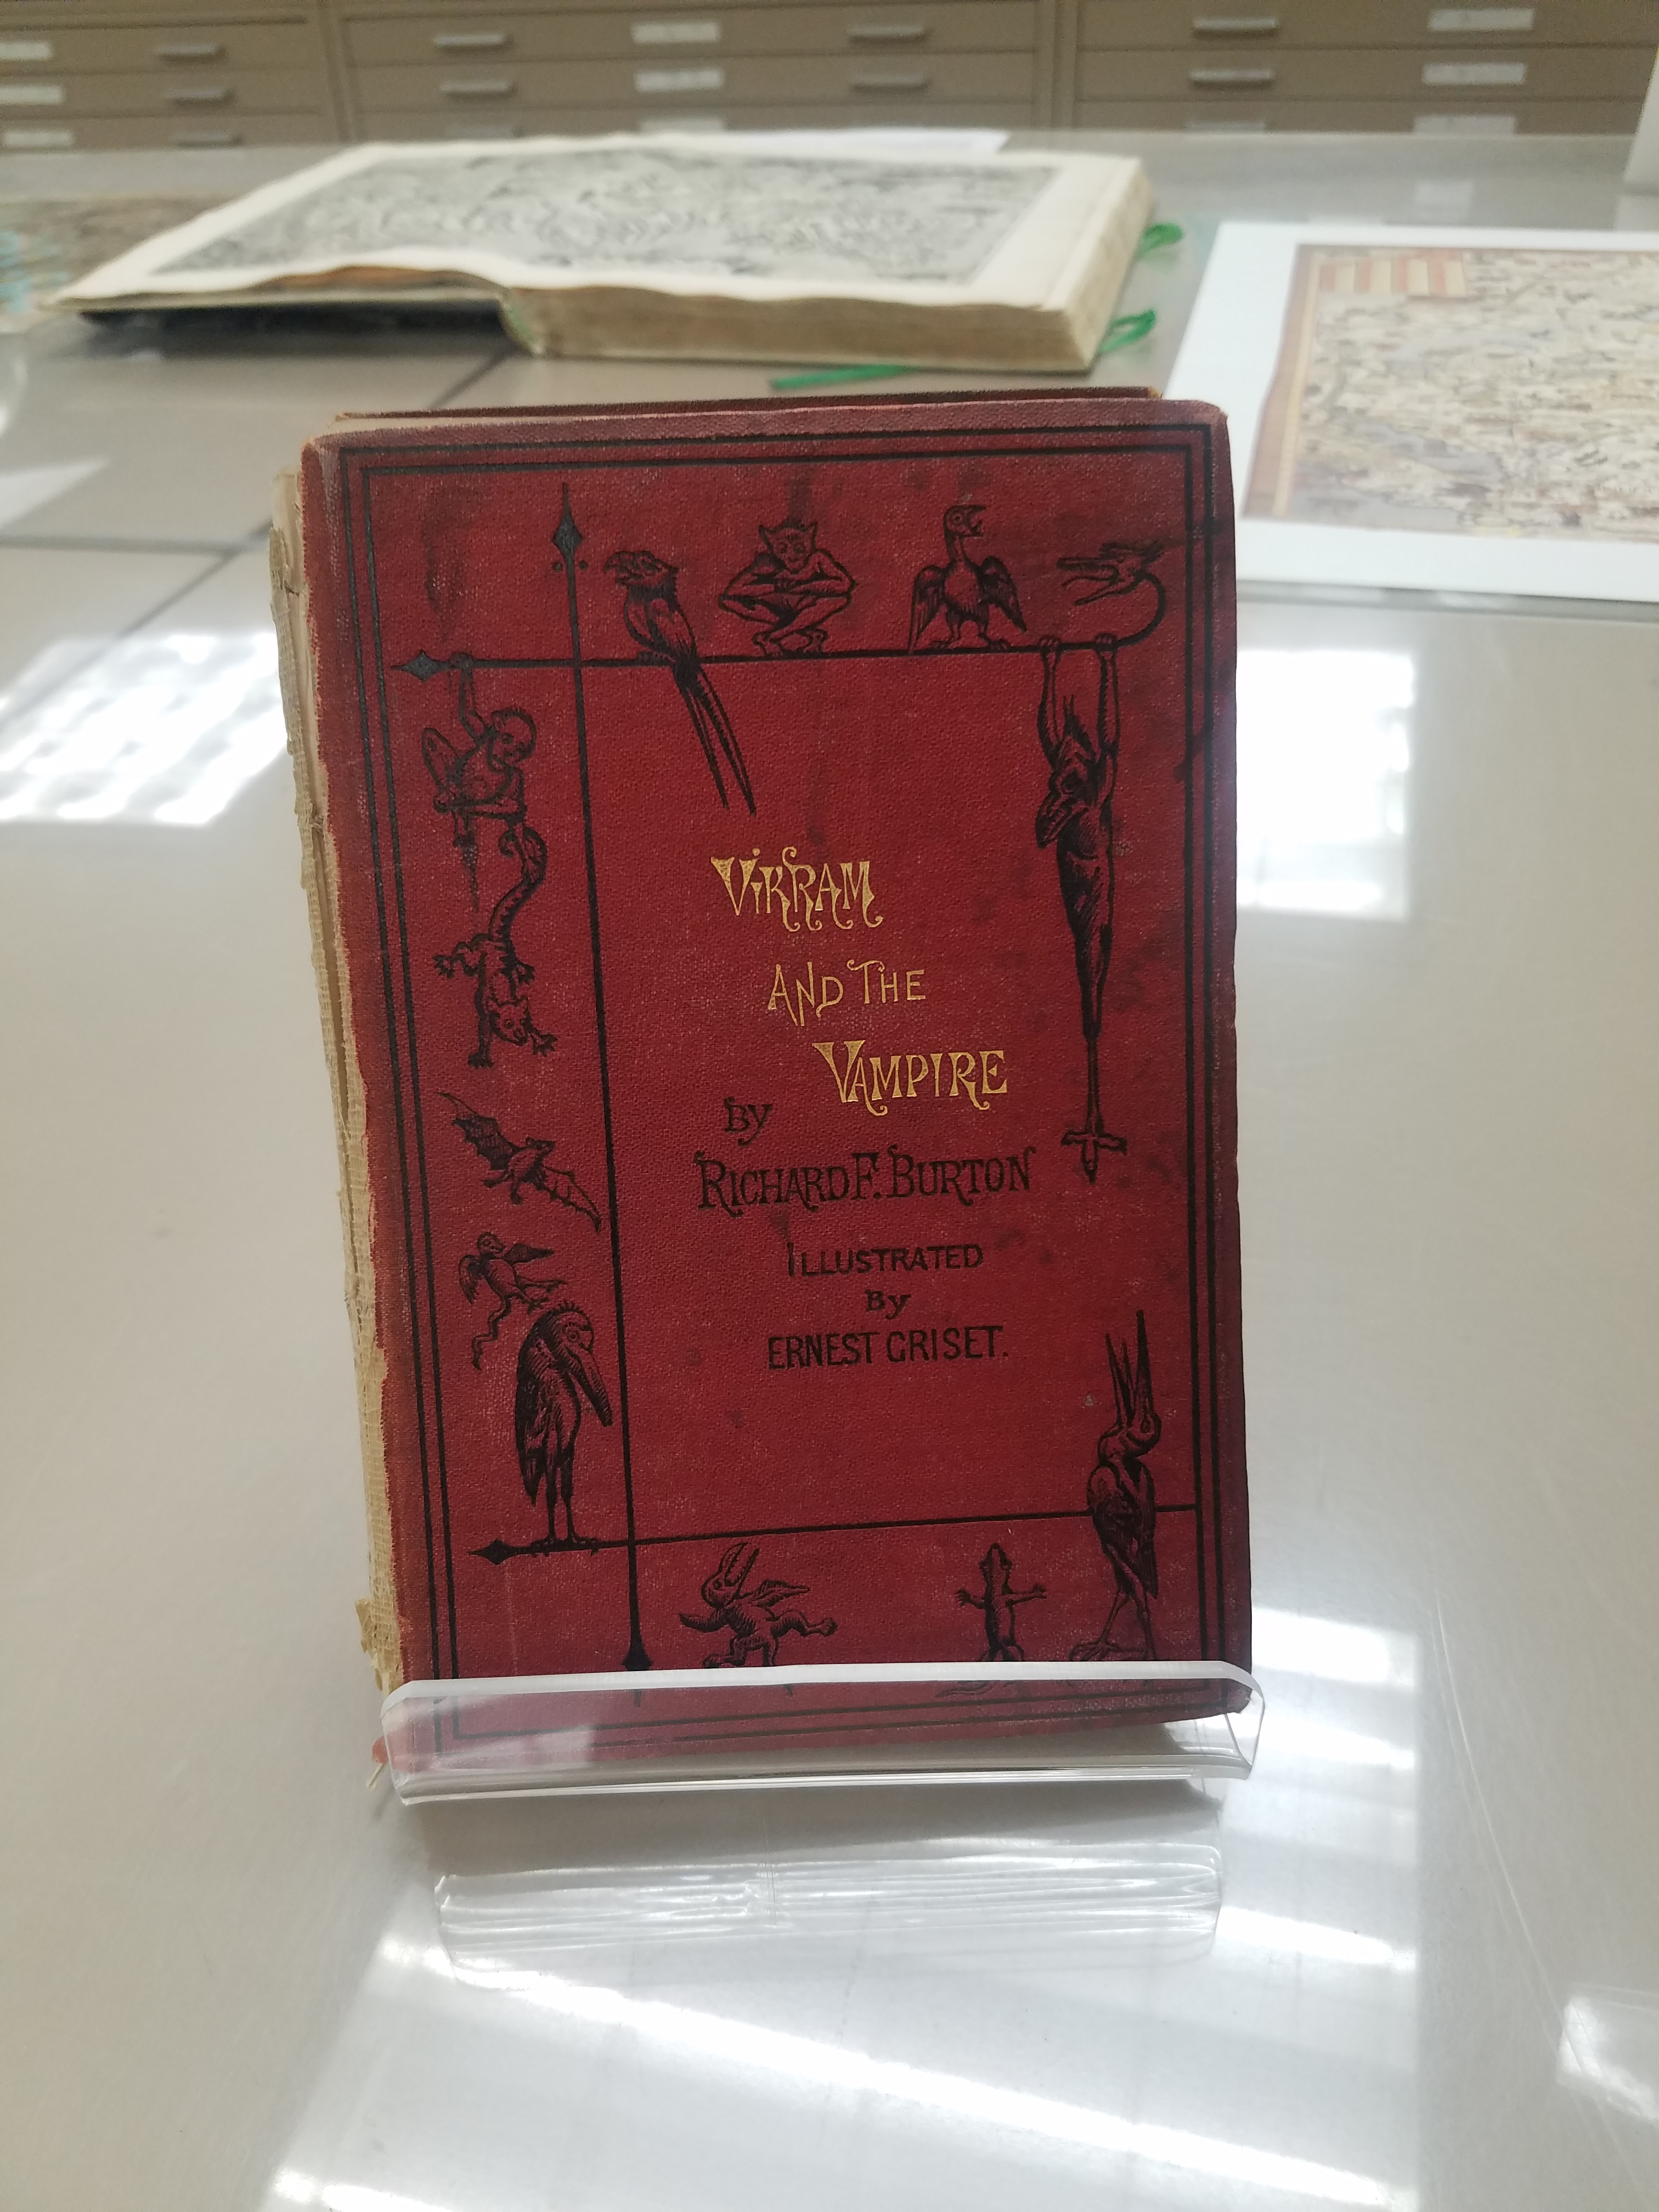
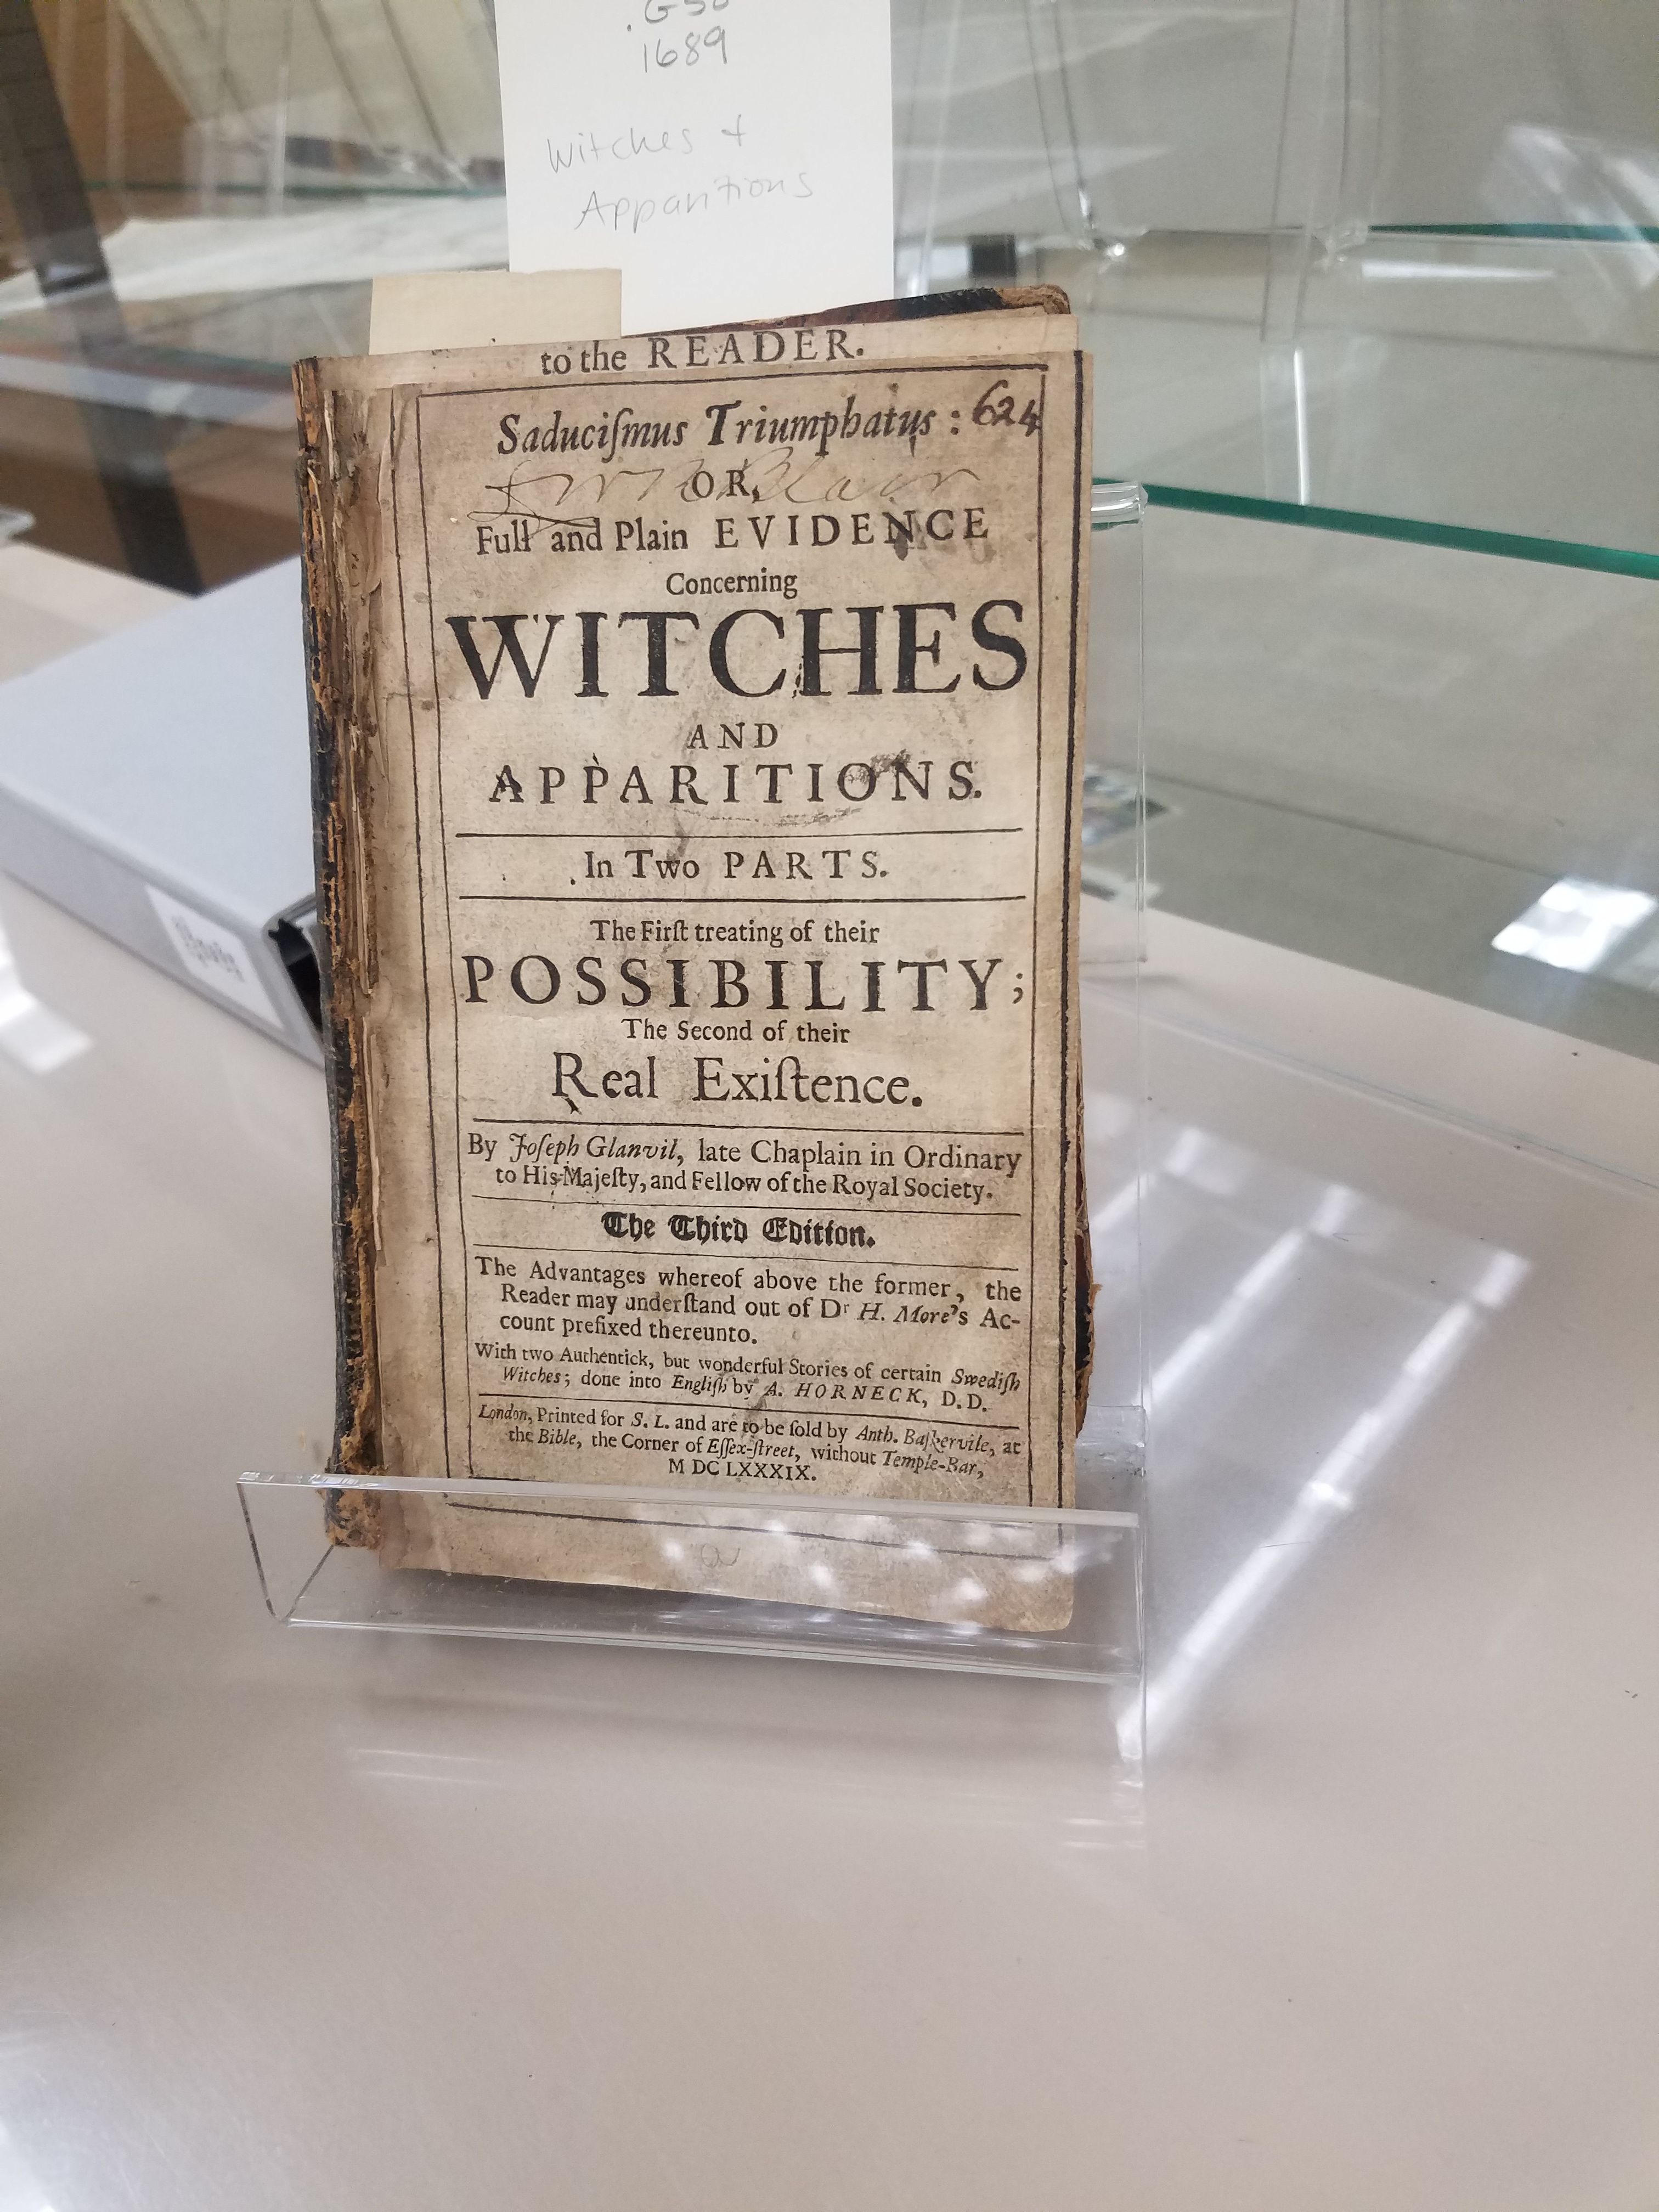
Happy Halloween! This month, the AGSL, UWM Archives, and Special Collections collaborated on another Pop-Up Exhibit! The official exhibit ran from October 23rd-25th and included specially curated pieces such as wood engravings of Mary Shelley’s Frankenstein by Barry Moser and many more spooky, scary artifacts! Well, you may have missed the full Pop-up Exhibit but don’t despair! There’s still time to see the hair-raising picks put out by the AGSL for the pop-up– our exhibition materials will stay on display until after Halloween! Peruse our collection; you may find sea monsters, witches, and haunted cemeteries– and if that doesn’t scare you, stay tuned for next week’s post which will feature some of the most spine-chilling, blood-curdling maps from this month’s Pop-Up!
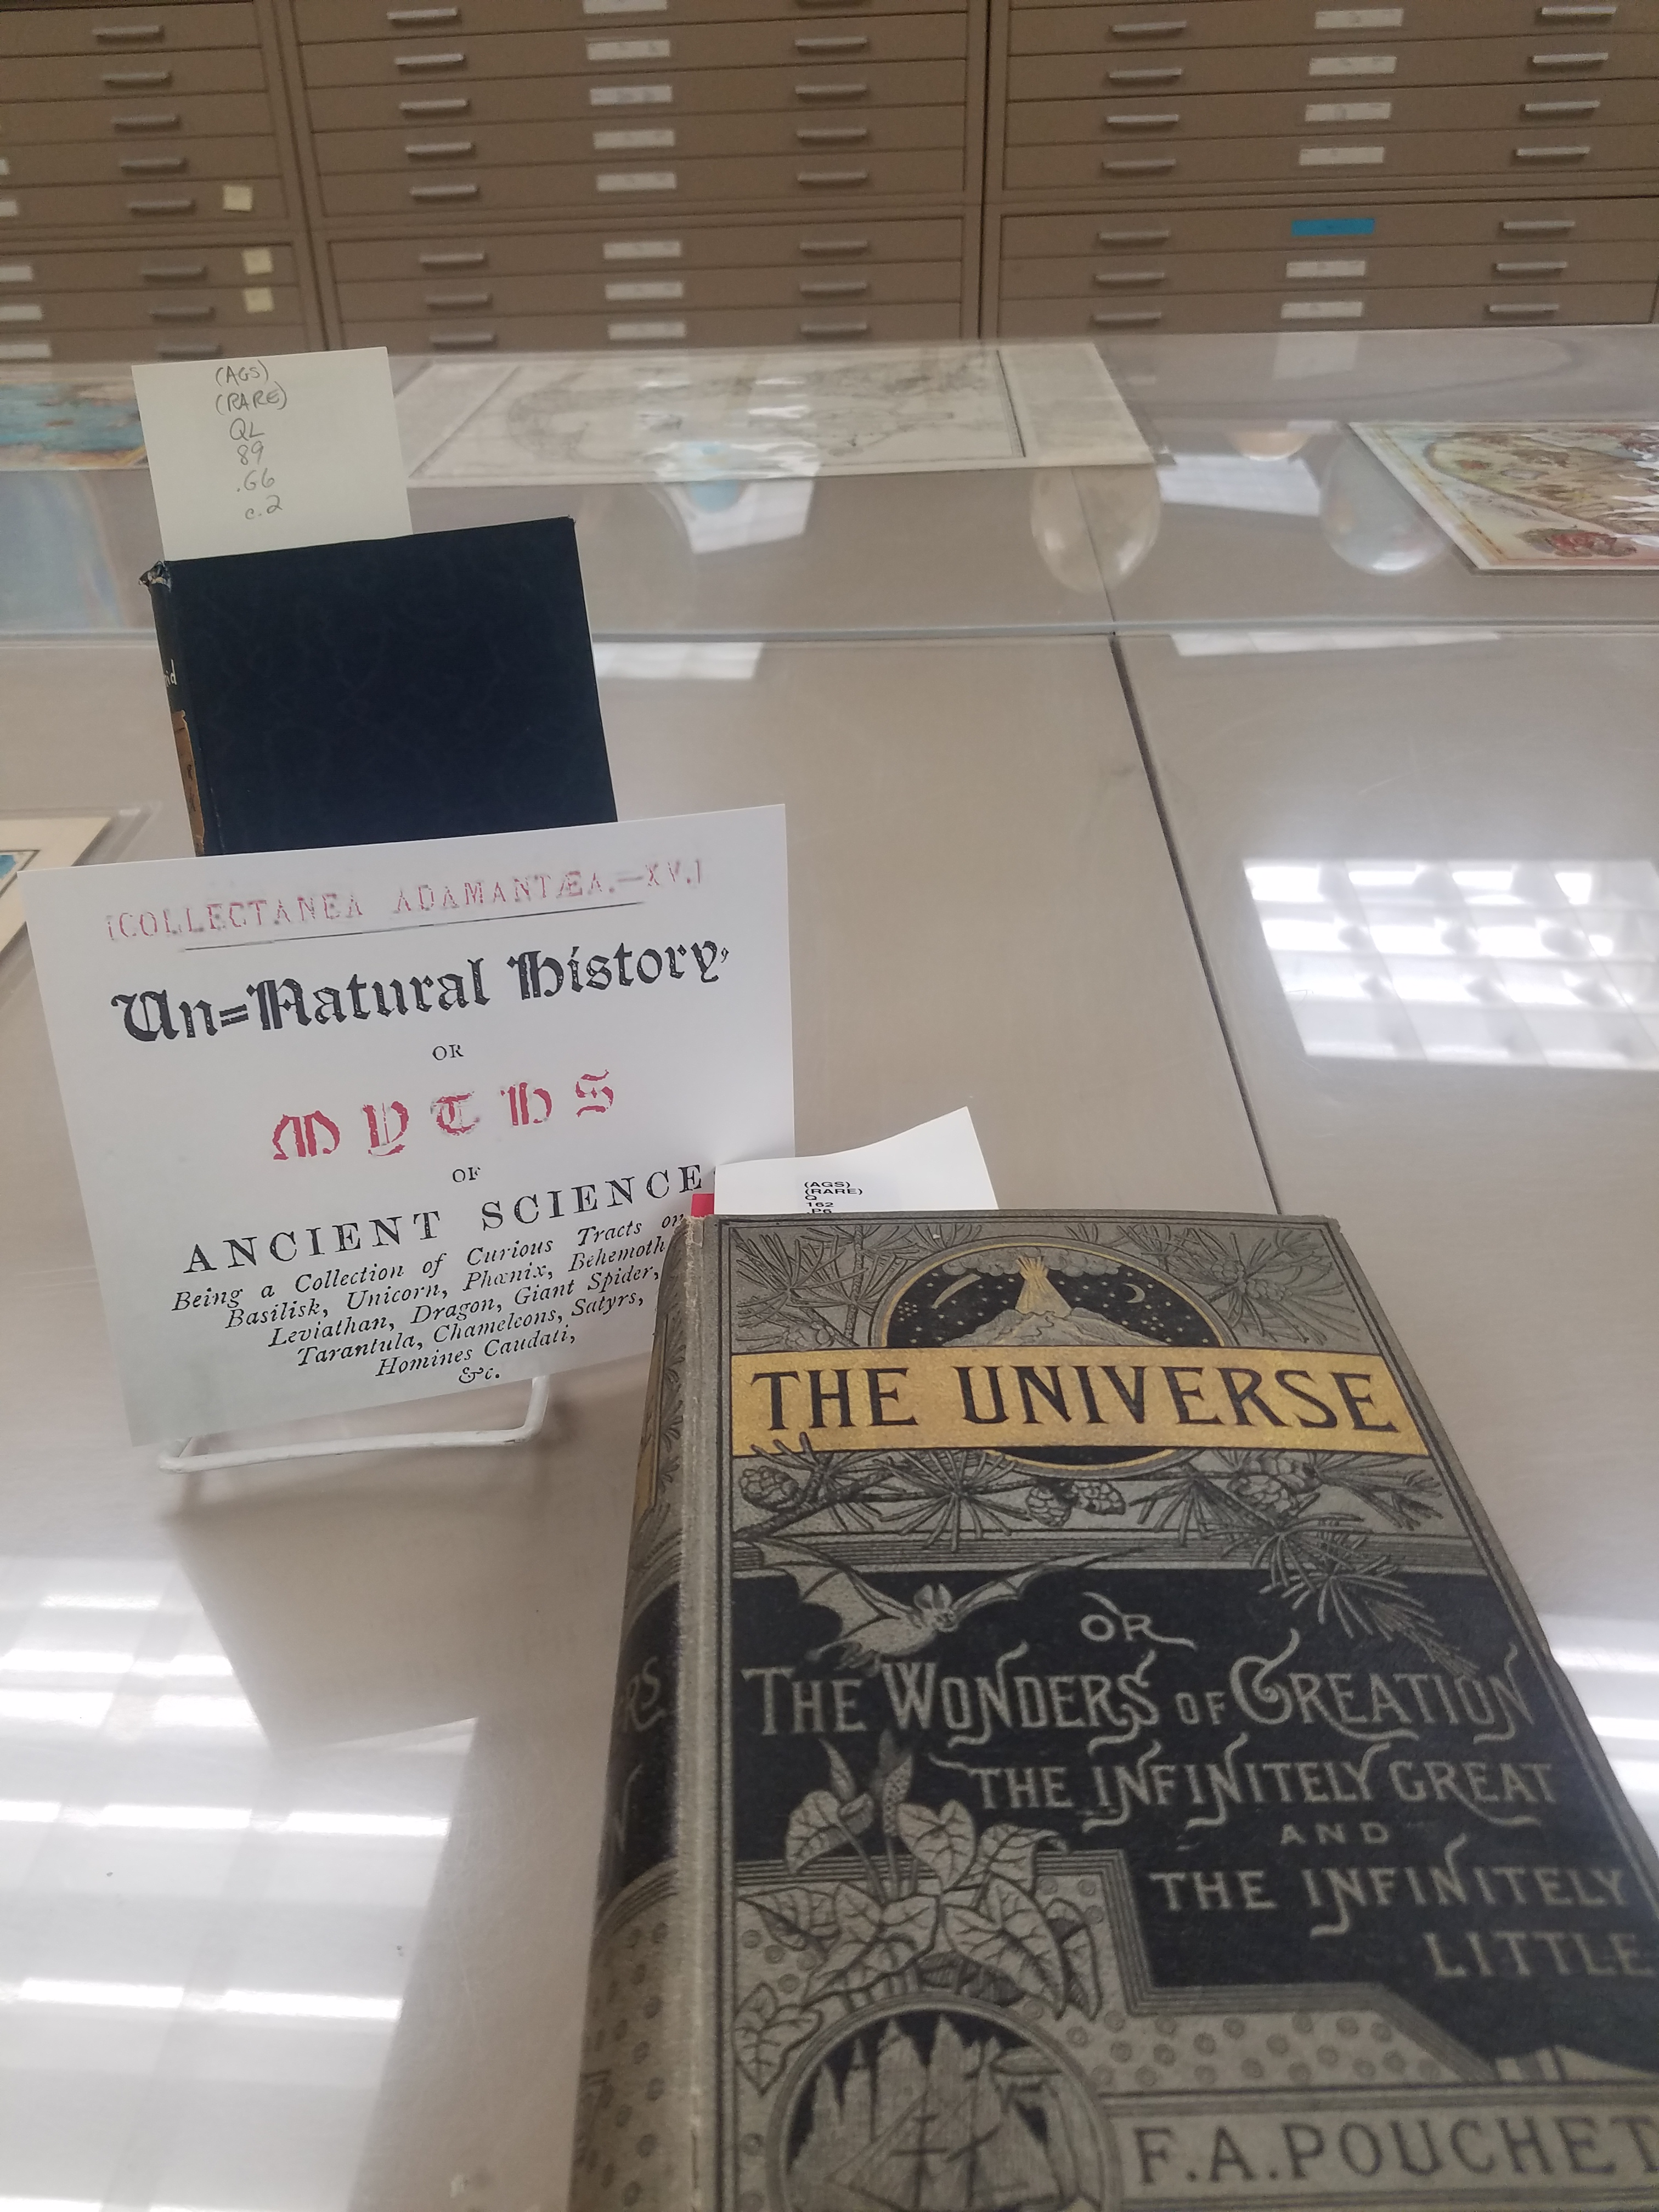
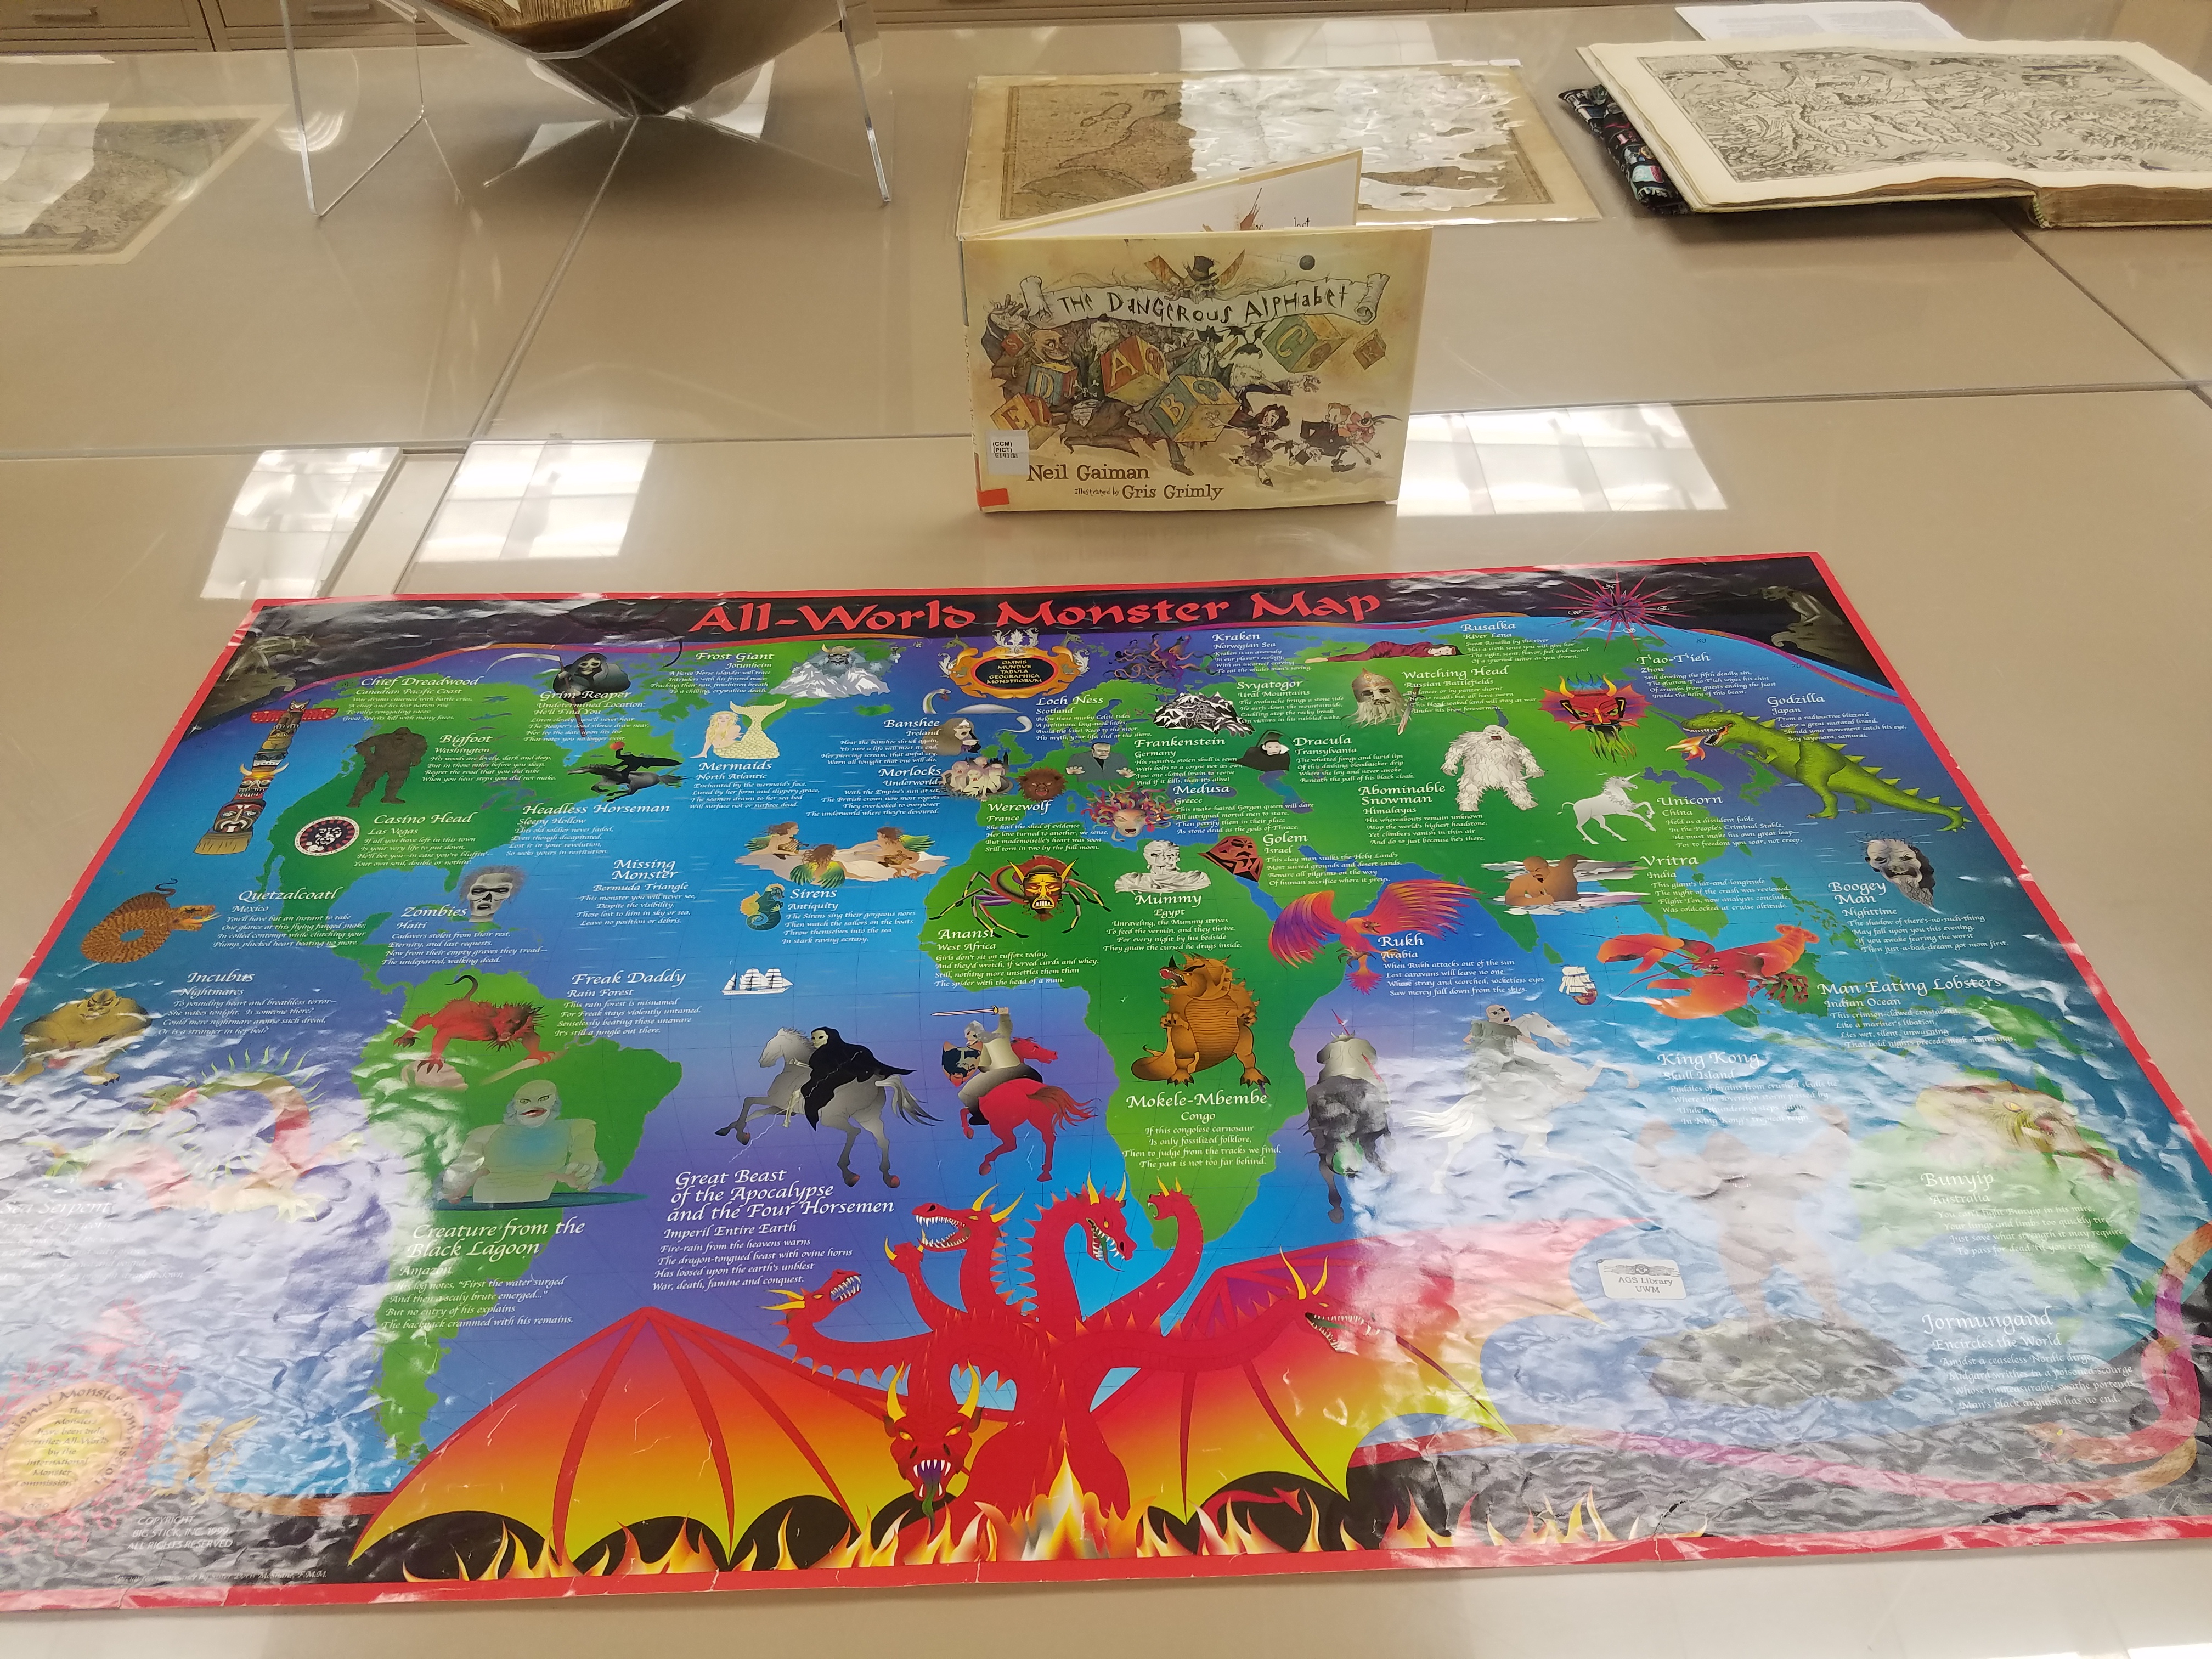
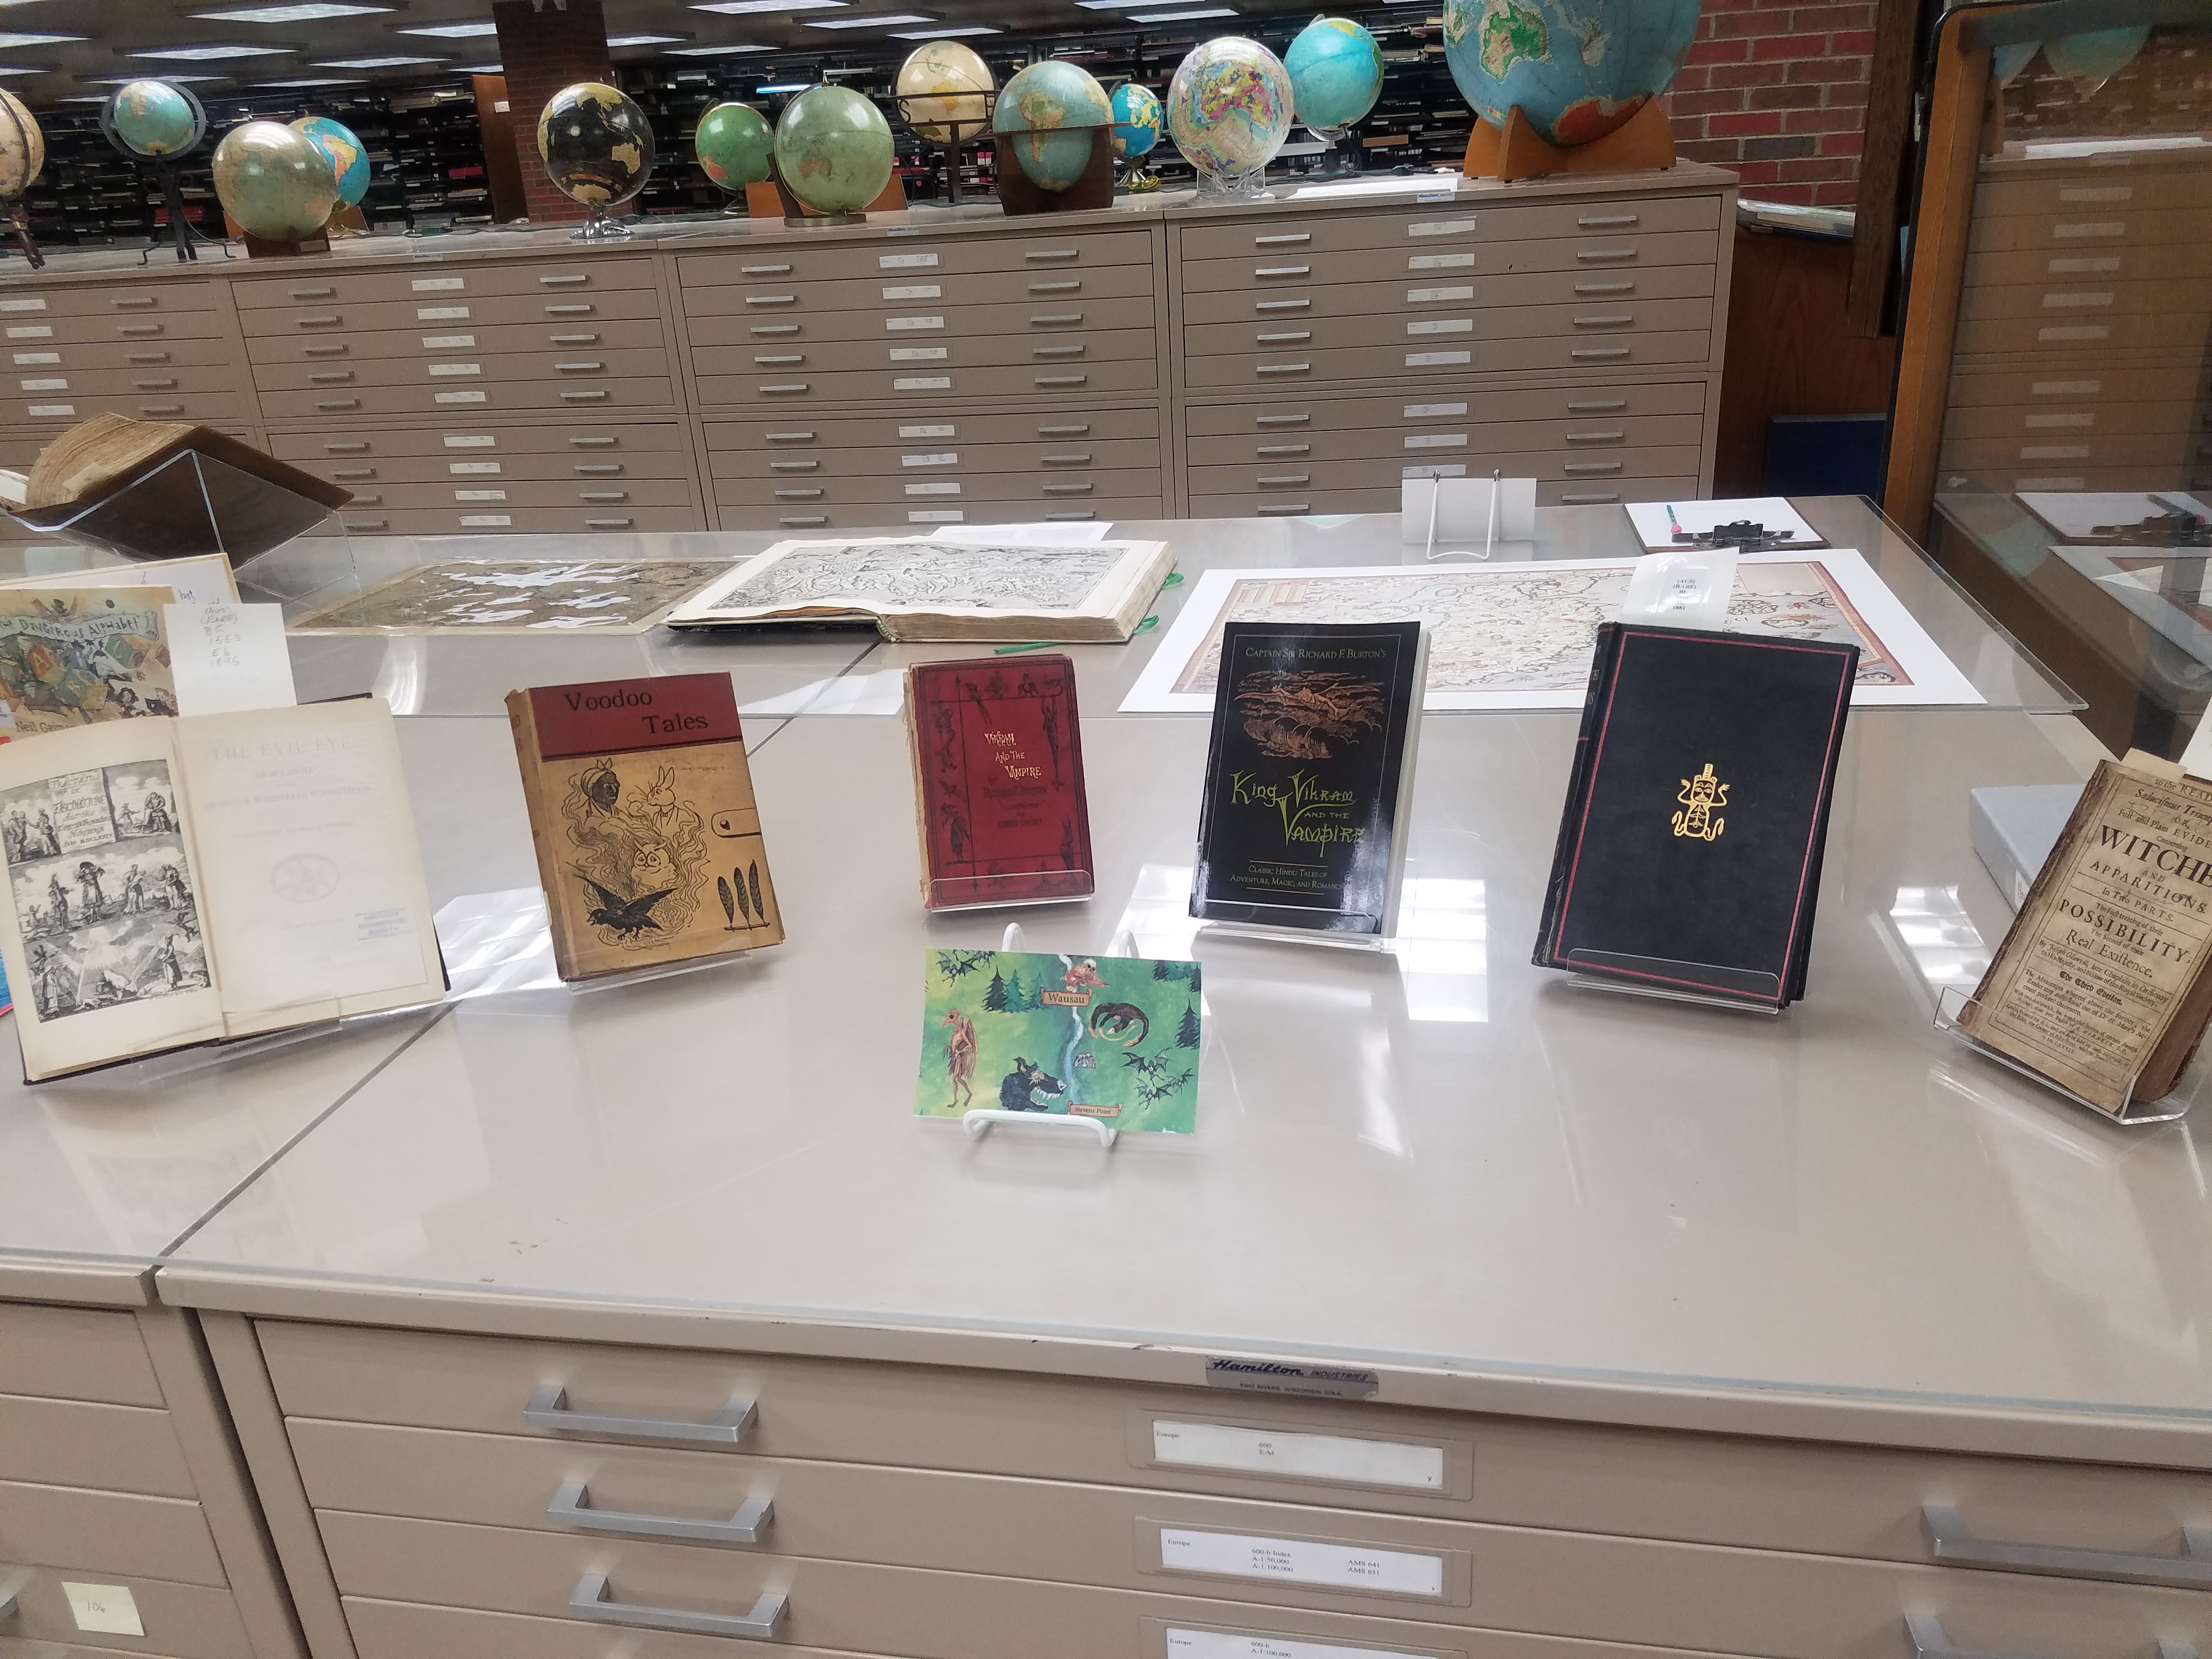
The AGSL is open to the public Monday through Friday, 8 a.m. to 4:30 p.m. Come see us and the Halloween Pop-up Exhibit while you still can!
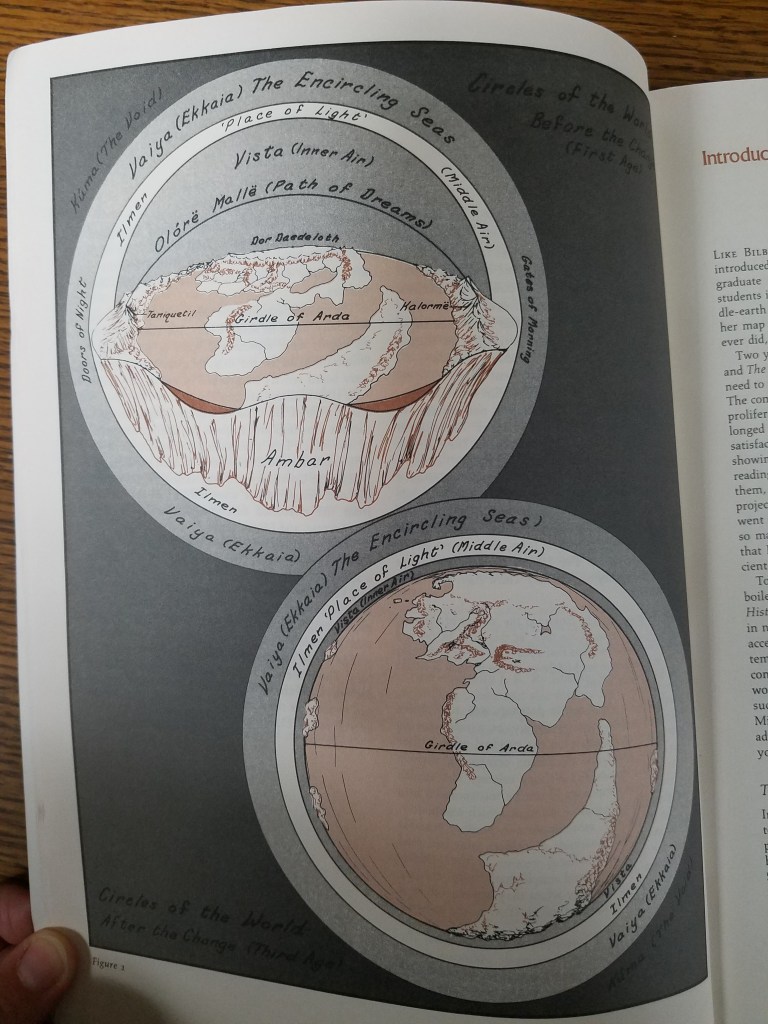
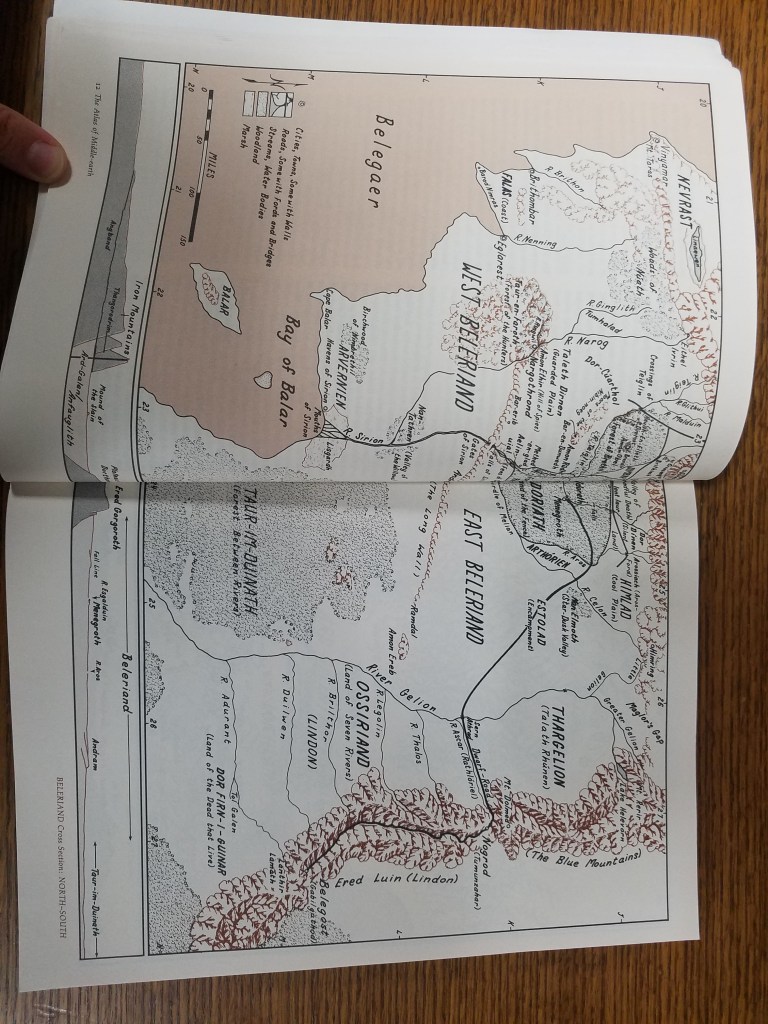
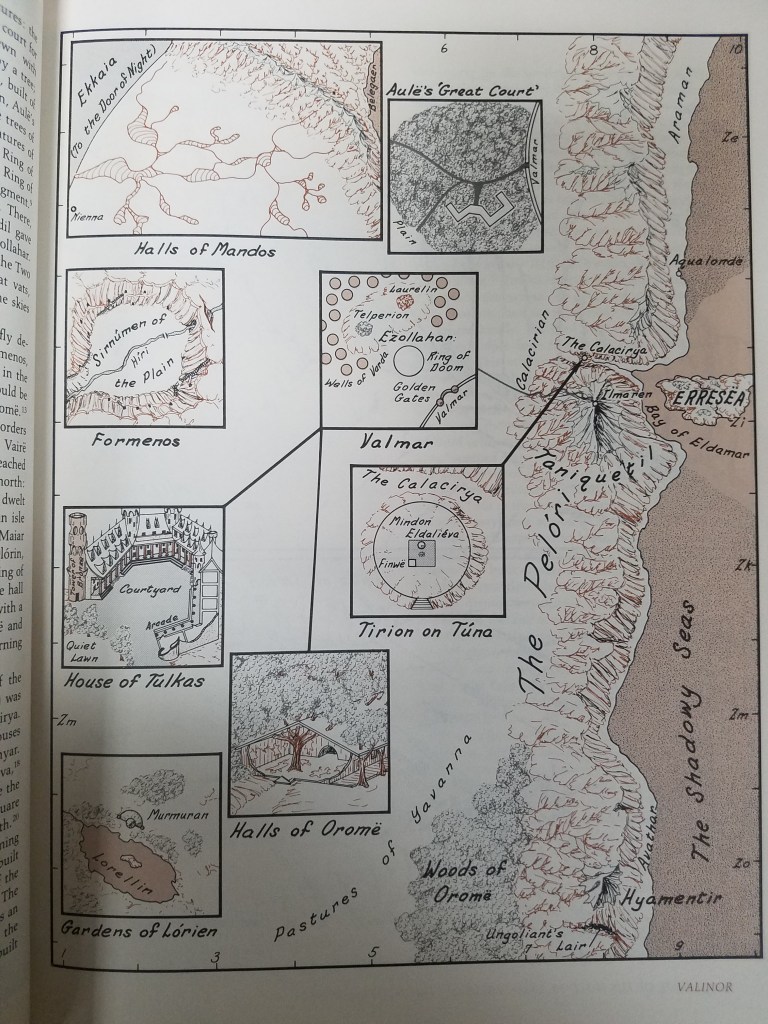
Mapping Fantasy Land: Karen Wynn Fonstad
By Lauren Maddox
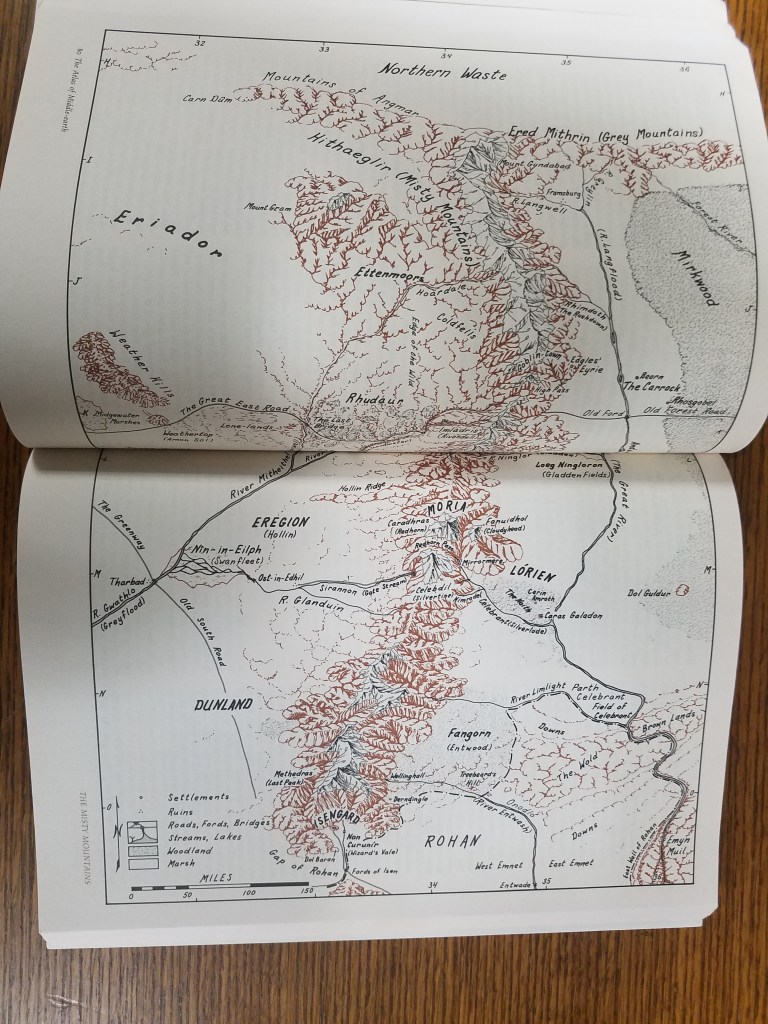
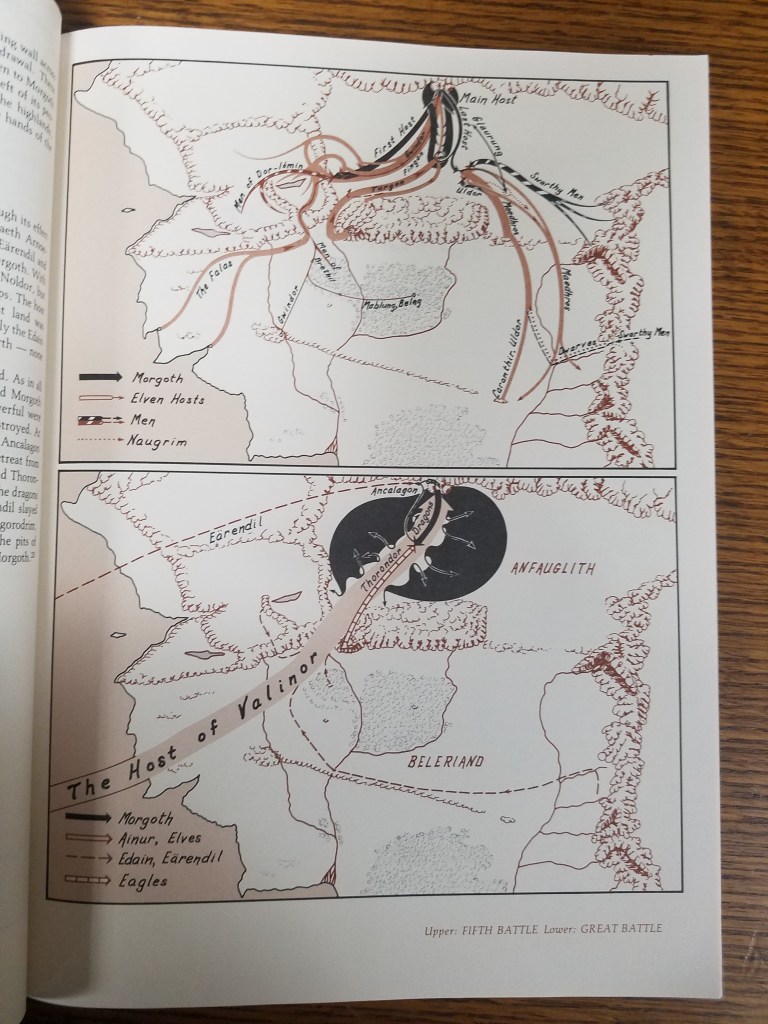
J.R.R. Tolkien’s stories pushed fantasy into the mainstream and have passed through the hands of generations of eager fantasy readers. The genre was forever different after The Lord of the Rings— and people still love Tolkein’s works!
Part of the allure of fantasy for many readers is the chance to escape to another, fully-formed world. This is one of the reasons that speculative fiction has become such a thriving genre and why games like Dungeons and Dragons are now more popular than ever– not just because of Stranger Things.
But when you construct an immersive world that people want to become a part of, you have to answer a lot of practical questions about the layout of your world. You are tasked with mapping a place that doesn’t physically exist.
Worry not, fantasy fan! It’s not an impossible job to map fantasy land– and it was job beautifully done by one of the University of Wisconsin’s own: Karen Wynn Fonstad.
Fonstad received her MA in Geography with a specialization in Cartography from the University of Oklahoma. She went on to become the Director of Cartographic Services at UW-Oshkosh and was heavily involved with Oshkosh’s city planning. In 1970, she stepped down from her position as Director in order to raise her two children. But during this time she worked on several exciting fantasy atlases: The Atlas of Middle Earth, The Atlas of Pern, The Atlas of the Land, The Atlas of the Forgotten Realms, and The Atlas of the Dragonlance World. Fans might recognize some of those names from Tolkien, D&D, Anne McCaffrey’s science fiction and others. Fonstad’s work meant a lot to fans of those worlds, who felt like the atlases were a way to connect to the worlds they loved so much.
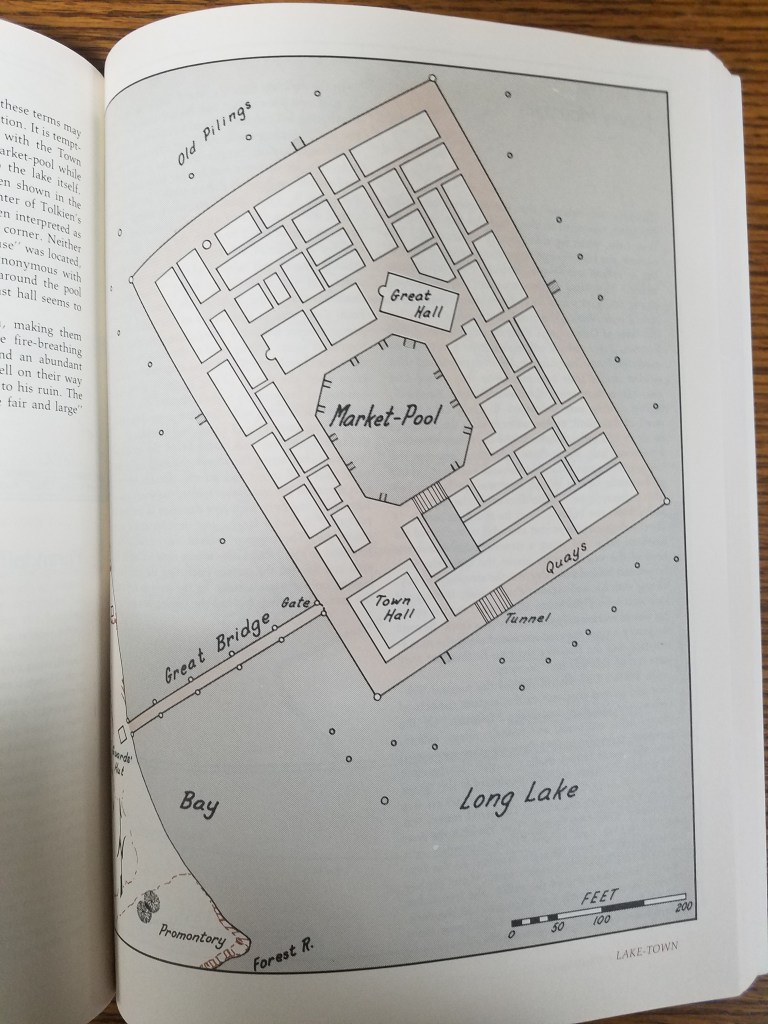
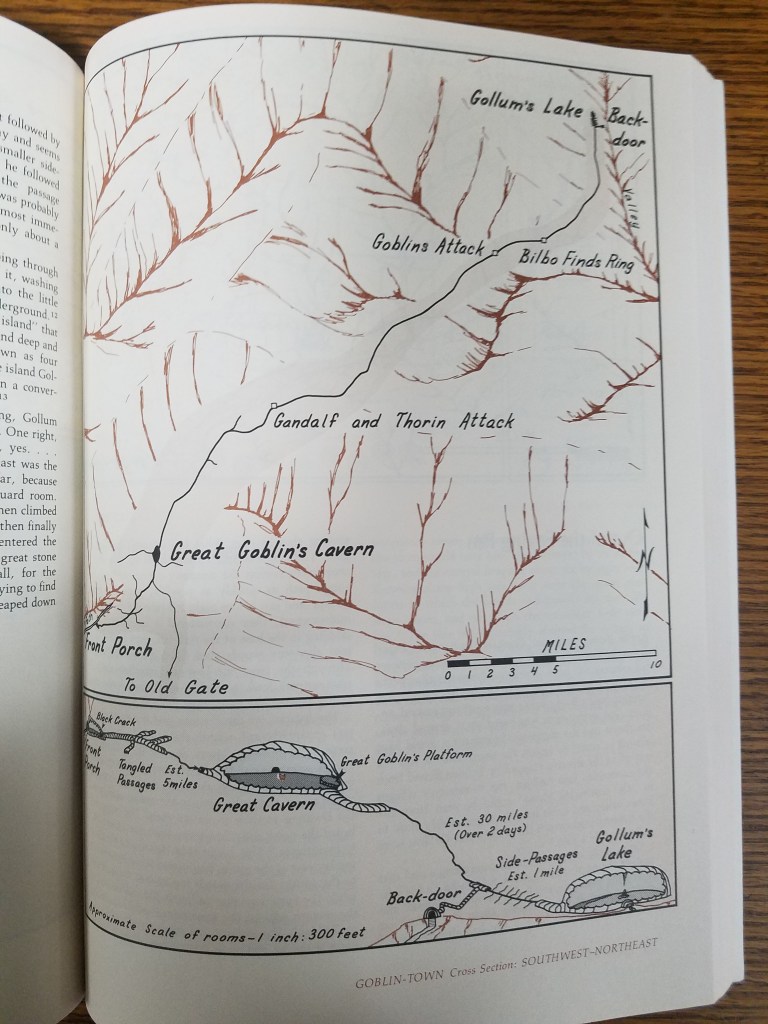
Fonstad passed away in 2005, but her work continues on in the hearts of those who were touched by her dedication to mapping fantasy lands. In the AGSL there are multiple atlases by Fonstad including her revised Atlas of Middle Earth, from which selections throughout this post were taken.
Imperial Russian Black Sea Atlas at the AGSL Part II
By Josephine Miller
Black Sea Atlas
The atlas became a significant work. It would be used by the Russian military for the next 30 years.[1] Manganari’s nautical charts were used as a base for the later editions published by the Imperial Navy. Even the Soviets used Manganari’s charts as a base in the 1920s, about eighty years after the original atlas was published. These later editions are held by the AGS Library. In the AGS Library’s possession are Black Sea and Azov nautical charts that date from the 1880s to the 1920s. Illustrations and corrections were added to later editions. These illustrations include lighthouses, large buildings, sea marks, and day marks to facilitate navigation. Newer measurements of compass declination were also added. However, much of the original Manganari charts remained in the later editions. His drawing of the coastlines, topography, and bathymetry remained as a base for future editions into the early Soviet era. The soil reports given from his nautical charts remained as well. Additionally, the map scales were kept in later editions.
As for the coastlines of the nautical charts, they were drawn according to astronomical and trigonometric calculations. This can be seen virtually all of the nautical charts of the Black Sea Atlas:

“Shore is determined by trigonometric means and many astronomical observations.” From Карта Части Сѣвернаго Берега Черного Моря отъ Одессы до Мыса Херсонеса (A Map of Northern Black Sea Coast, Odessa to Cape Chersonesos). Click the link to see the entire map!
Navigational routes, drawn as sea lanes, are essential to nautical charts. To aide navigation, landmarks and seamarks are given. Manganari plotted different kinds of lines to indicate valuable information for navigation. Each chart in the atlas has almost identical legends in regards to navigation. However, there is slight variations between charts due to mountains or cultural landmarks. These cultural landmarks are usually religious, such as churches and mosques. Here is the legend from the 1891 edition of the Northern Black Sea Coast.
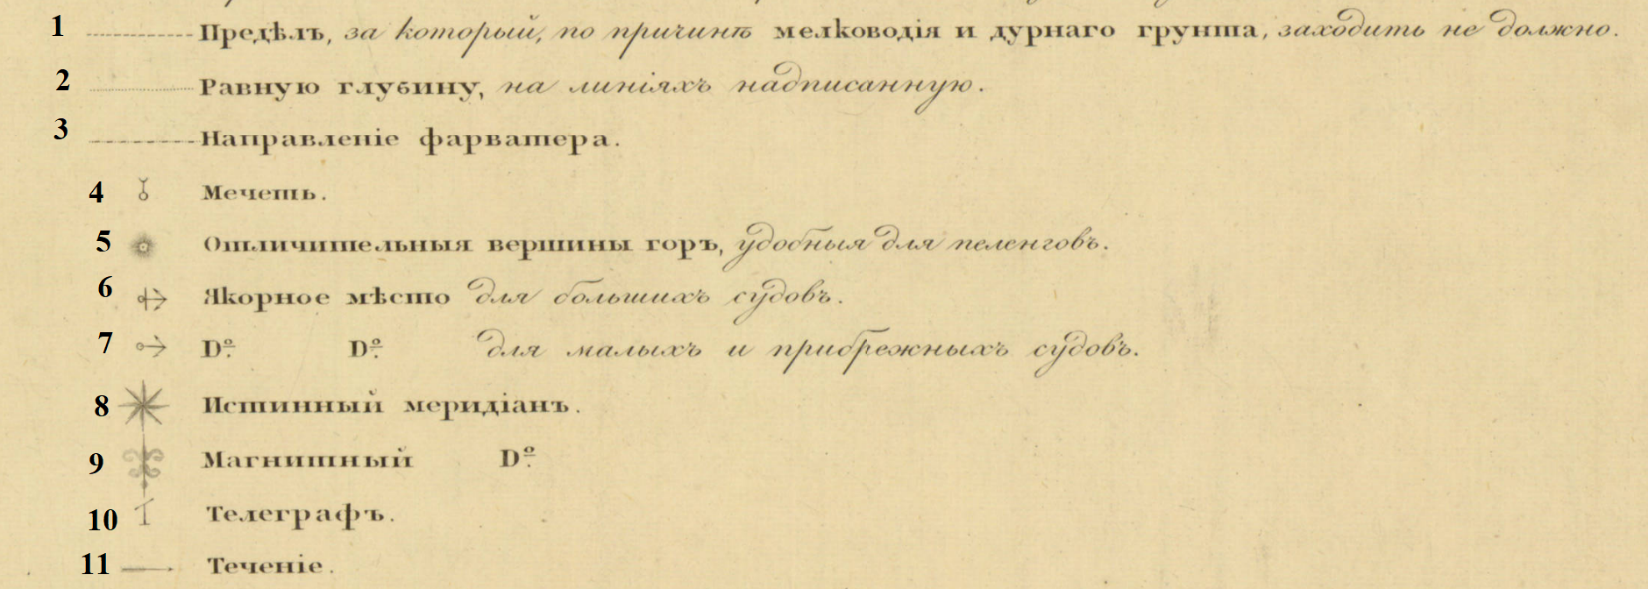
1. The limit for which, due to shallow water and bad soil, should not enter. 2. Equal depths on the plotted line. 3. Direction of fairway. 4. Mosque. 5. Distinctive mountain peaks, convenient for bearing. 6. Anchor place for large ships. 7. Anchor place for small and coastal ships. 8. True Meridian. 9. Magnetic Meridian. 10. Telegraph 11. Tide or Current.
One area of British influence in Russian cartography is measurement. A larger than life ruler, the impact of Peter the Great carried long after his death. His reign is reflected in the field of Russian cartography. Inspired by his tour of the West, he established in the Imperial Navy in 1696. Peter’s command to westernize Russian government brought Western cartography to Russia, military largely in mind. One major reform was to implement British measurements for military use. Consequently, almost two centuries later, the Russian Navy used the British Imperial measurements in its nautical charts. This can be seen on the AGSL’s charts. The Imperial measurements were used for distance and depth.
On this 1891 edition nautical chart of the northern Black Sea coast, the map scale uses British measurements:
On this 1891 edition nautical chart of the northern Black Sea coast, the map scale uses British measurements:
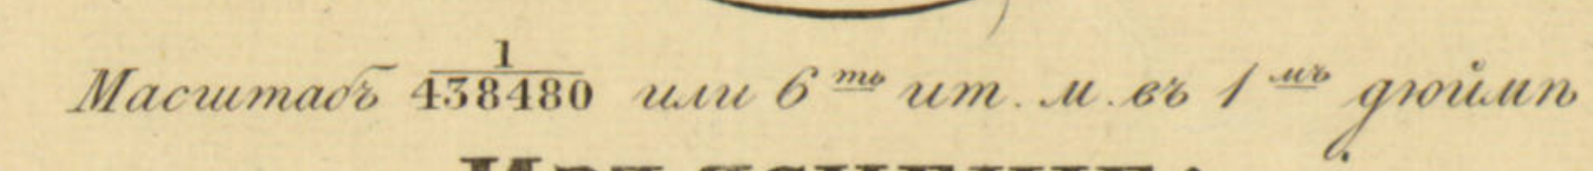
Map Scale of Карта Части Сѣвернаго Берега Черного Моря отъ Одессы до Мыса Херсонеса [Northern Black Sea Coast, Odessa to Cape Chersonesos].

Another example of British measurments is found on the same chart, depth.
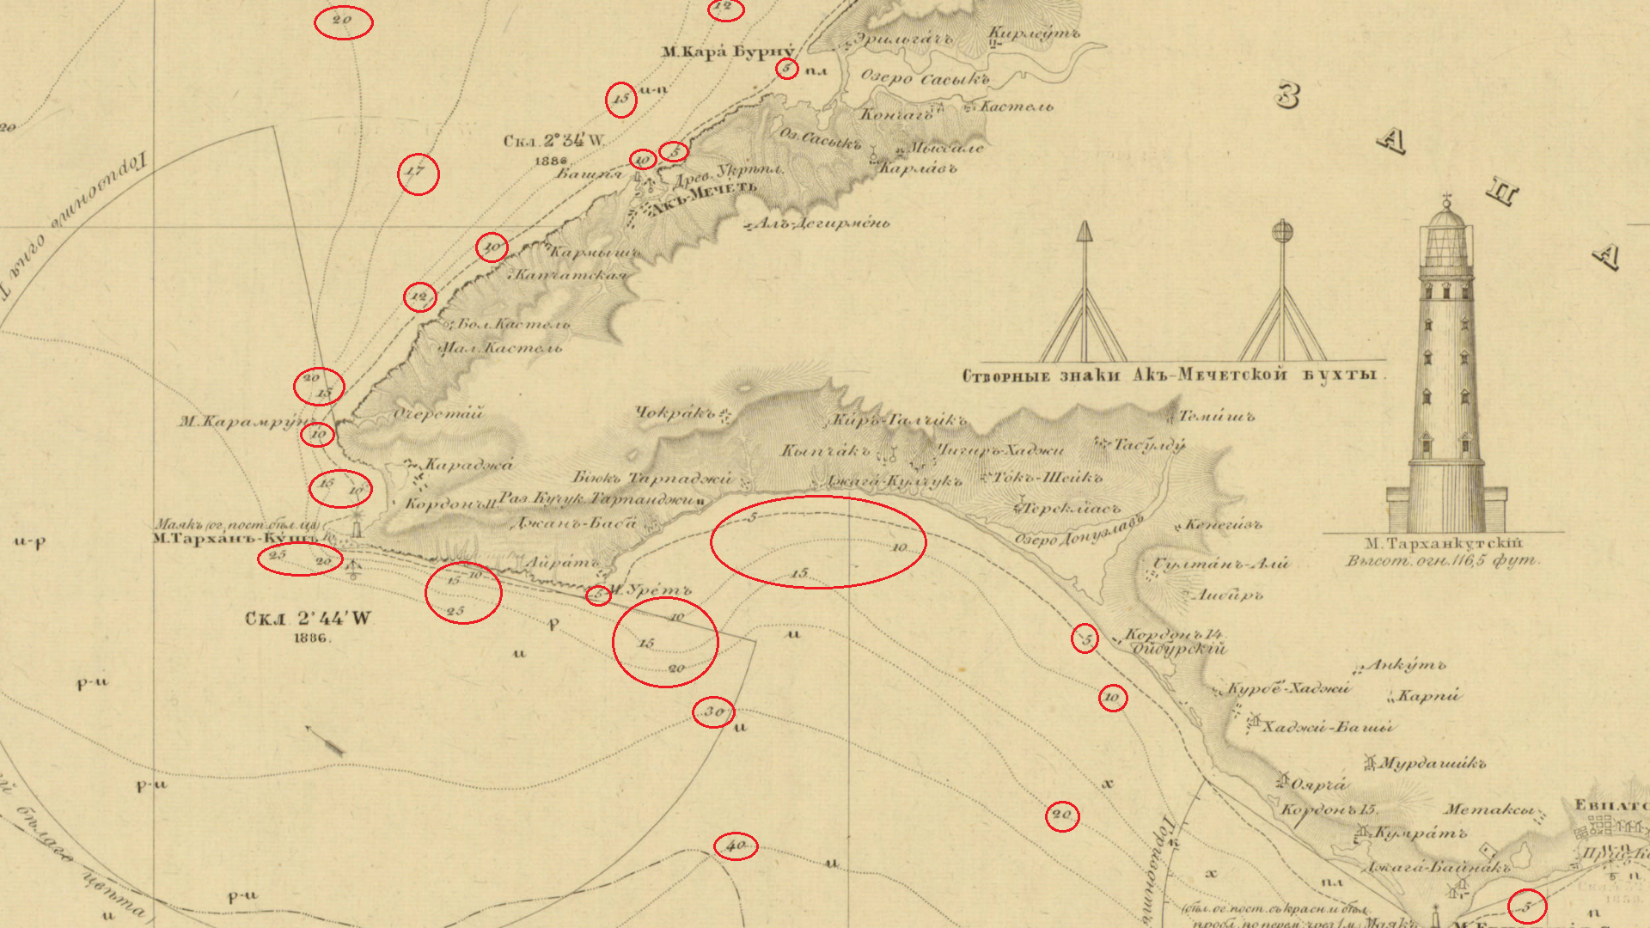
“Depth of sea height measured in six-foot English fathoms – rivers and estuaries in feet.”
Circled below are the depth marks.
From Карта Части Сѣвернаго Берега Черного Моря отъ Одессы до Мыса Херсонеса (Northern Black Sea Coast, Odessa to Cape Chersonesos). Click the link to see this map in our Digital Collections!
In addition to depth, Managanari recorded the soils of the sea floor.
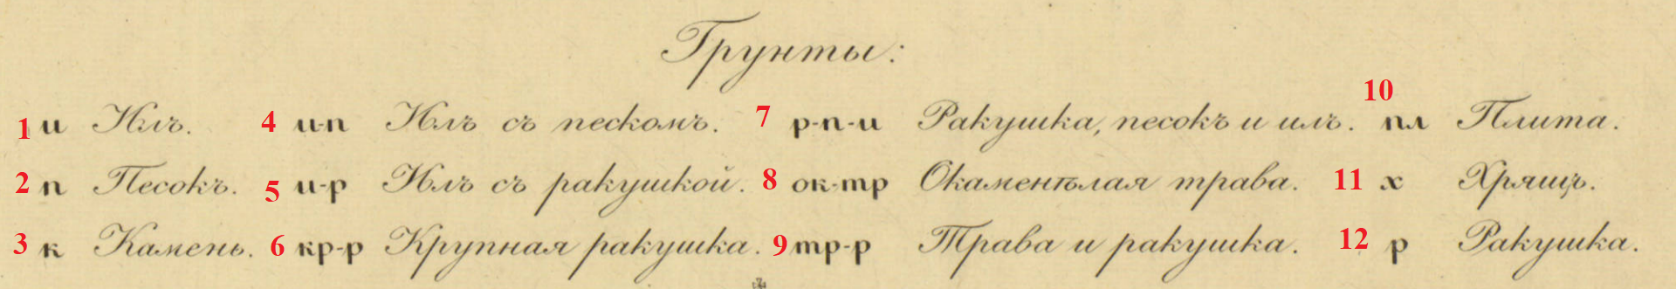
Карта Части Сѣвернаго Берега Черного Моря отъ Одессы до Мыса Херсонеса (Northern Black Sea Coast, Odessa to Cape Chersonesos). Click the link to see the whole map in our Digital Collections!
- Silt
- Sand
- Rock
- Silt with sand
- Silt with shells
- Large Shell
- Shell, sand in silt
- Petrified weeds
- Weeds and shells
- Plate
- Cartilage or Gristle
- Shells
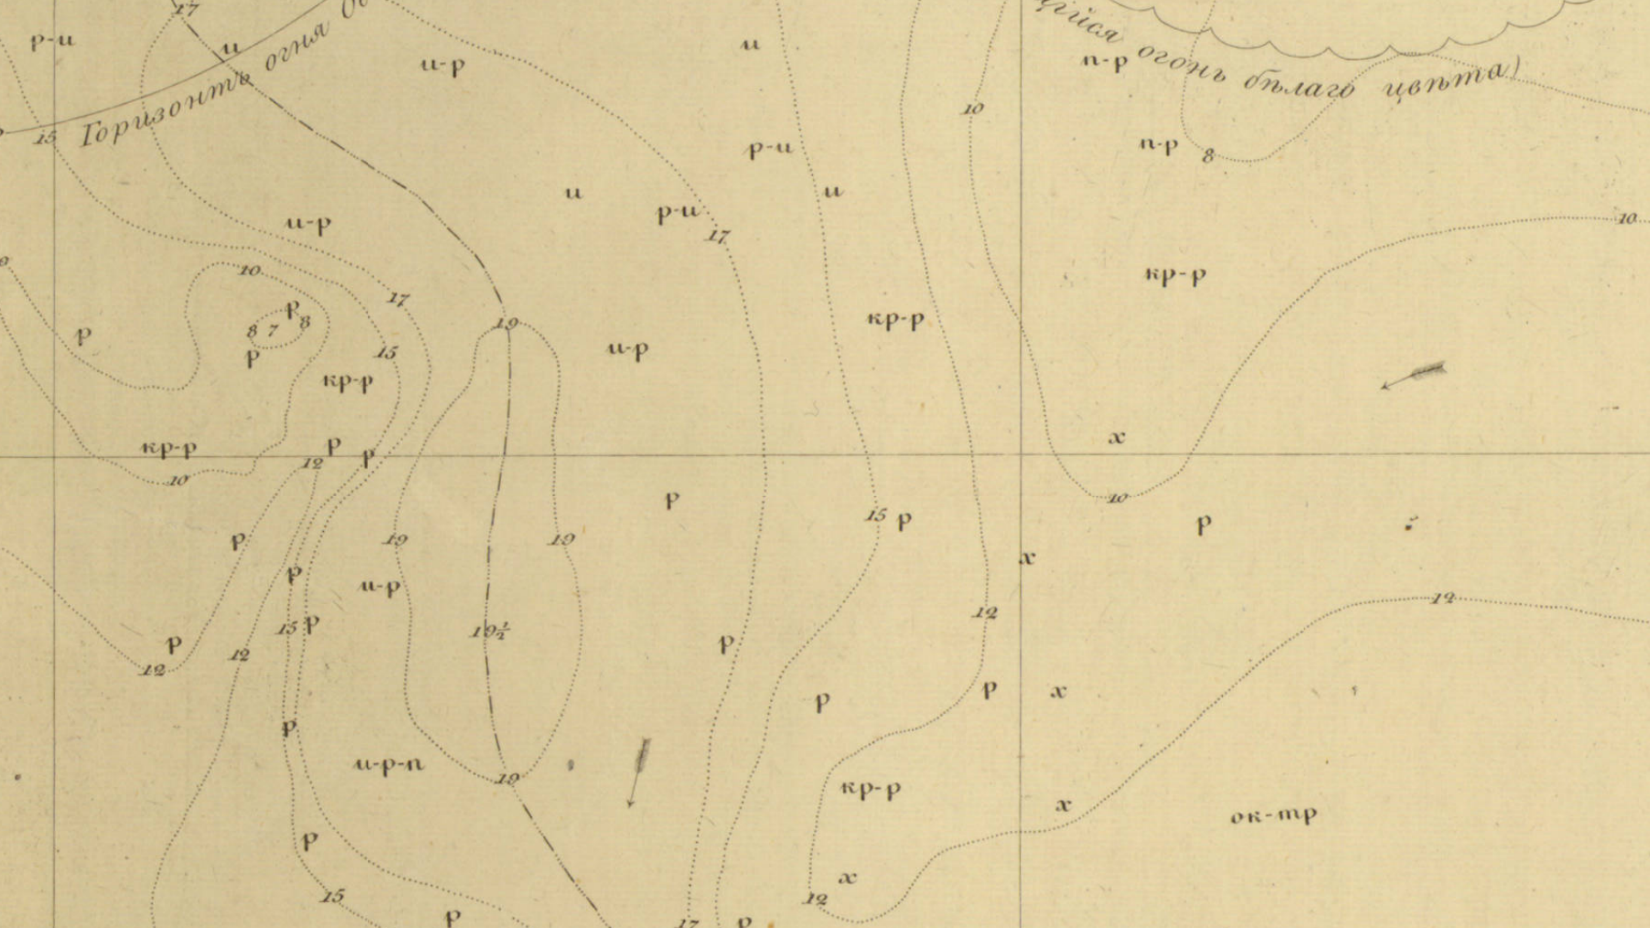
Sea floor on the chart. The letters represent soils as indicated by the legend.
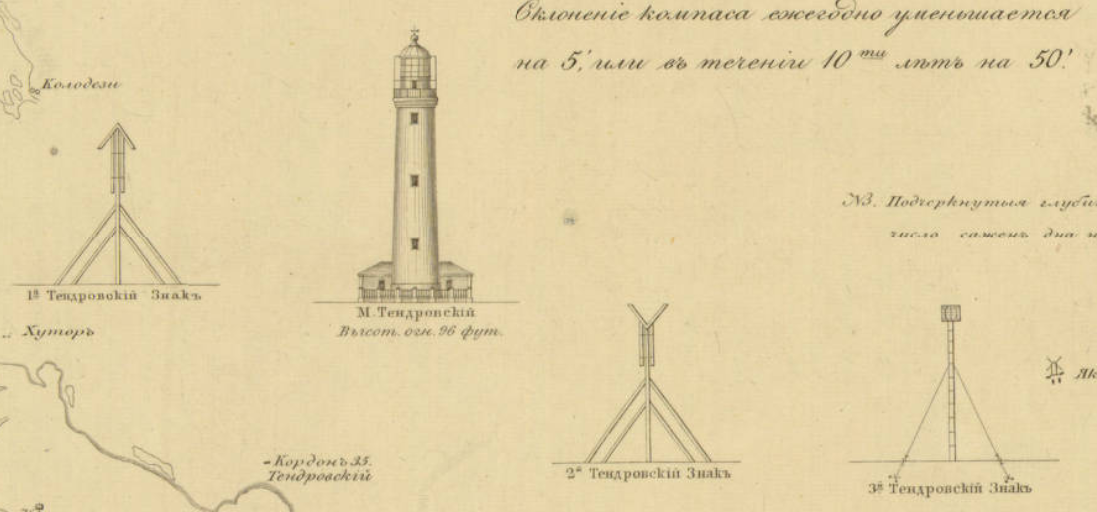
Later editions published after the Treaty of London (1870) include lighthouses and seamarks. Here is the Lighthouse of Tendra Bay on the Southwestern coast of Ukraine. It is noted as 96 feet. Beside it are seamarks. These landmarks aide navigation.
A significant factor to navigation is the prime meridian. In the early 19th century, the Russian militray did not use Greenwich as the prime meridian for its cartography. Instead, Manganari used the Pulkovo Meridian as the prime meridian, which was the practice in Russia at the time. The Pulkovo meridian is located at the Pulkovo Observatory in Saint Petersburg. In the spirit of the reforms in Alexander’s II reign, the later editions adopted Greenwich.

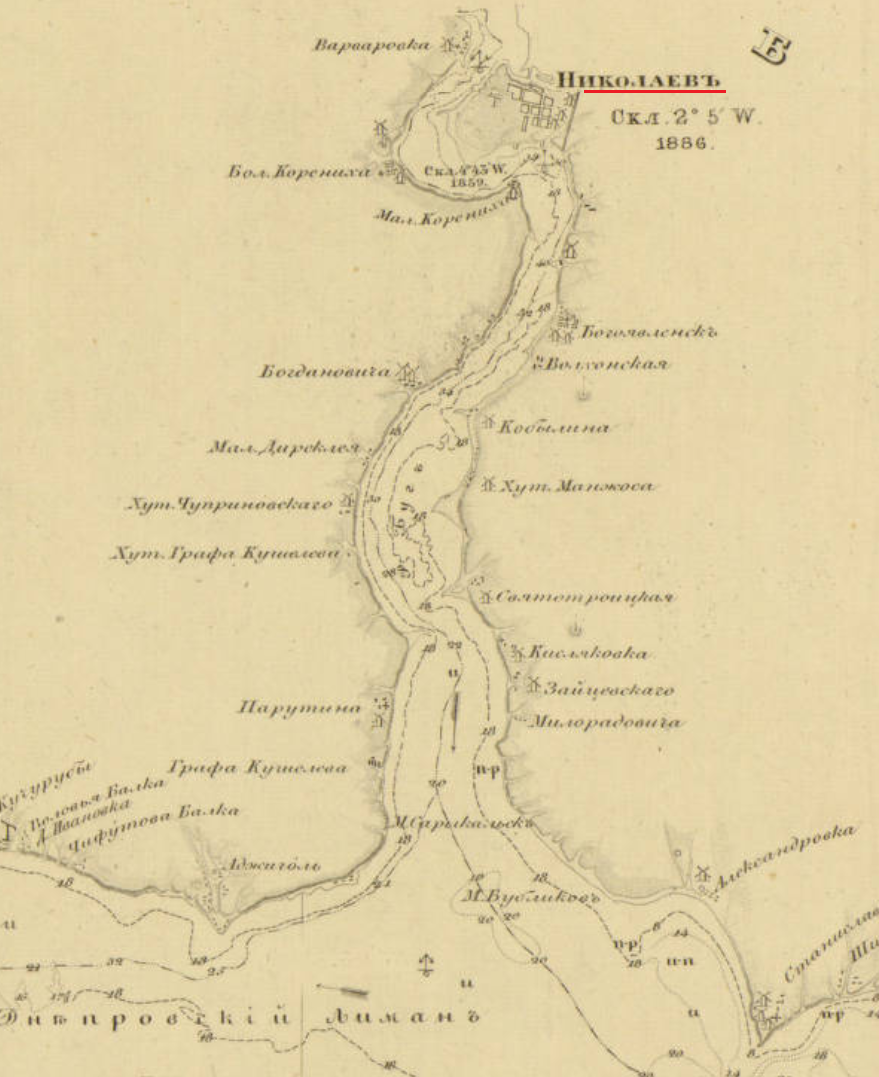
Nikolayev was a base of the Black Sea Fleet. It was also the location of the Depot of the Hydrographic Department of the Black Sea Fleet for the Imperial Navy. In1803, the depot was founded at the request of the Marquis de Traverse, Commander-in-Chief of the Black Sea Fleet at the time. It was established for the engineering needs of the fleet. There, the nautical charts of the Black Sea Atlas were drawn and compiled before engraving. Later editions of the charts were published in Nikolayev. [2]
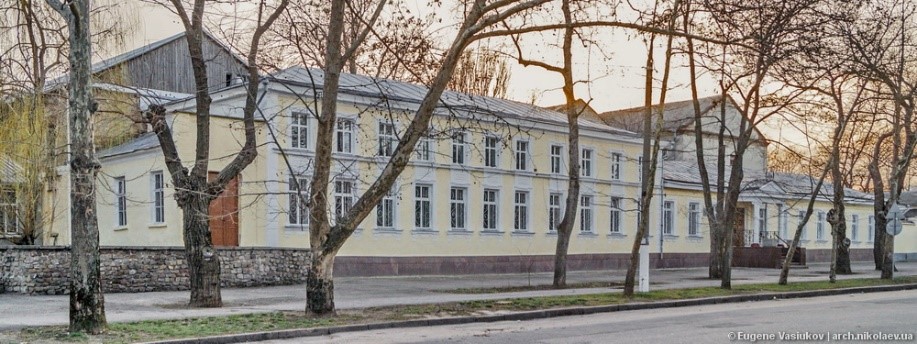
Map Depot of the Hydrographic Department, Black Sea Fleet, Imperial Russian Navy, Nikolyaev. Click the link to learn more!
Later editions borrow from Vice-Admiral Thomas Abel Brimage Spratt (1811-1888). Spratt had an extensive career in the British Navy as an officer, hydrographer, and geologist. He produced a repertoire of nautical charts for the British Admiralty. He was a fellow of the Royal Geographical Society of London, the Zoological Society of London, the Society of Antiquaries of London, the Royal Society of London. The Crimean War provided Britain with the opportunity to survey the Black Sea. The then Captain Spratt completed nautical surveys of the Black Sea during the war. In May of 1851, Captain Spratt was given command of the paddle steamer HMS Spitfire to survey the island of Crete. This was the ship he used in the 1850s for his surveying of the Black Sea as it is noted on the nautical charts of the later editions.
The conditions of the Treaty of Paris (1856) is a primary reason why the Russian Navy would use Spratt’s maps in their own nautical charts of the Black Sea. Given that the Russian Navy could not have fleet in the Black Sea after the Crimean War, the navy could not perform its own surveying in the Black Sea. This situation lasted until the abrogation of the Black Sea clause by the Treaty of London in 1870. For the latter half of the 1850s and through the 1860s, Russia was without a fleet in the Black Sea to do the surveying required for nautical charts. Thus, the Russian navy had to find other sources for the information that they could not gather themselves in the time period. One source would be the Spratt’s surveys. By 1870, when Russia could rebuild the Black Sea Fleet, the most recent Russian survey of the Black Sea was Manganari’s atlas. However, the atlas had been published in 1841-1842 with surveys from the 1820s and 1830s. Spratt’s work was more recent dating to the 1850s. For that reason, Spratt’s work was included in the later editions of the 1880s and 1890s.
The legacy of Captain Manganari carried through one century into the next. His charts for the Black Sea Atlas that he surveyed in the 1880s would be used as a basemap for later editions. Even the Soviets used Managanari’s charts in the 1920s, almost century after Manganari published the Black Sea Atlas. The Black Sea has historically been signifcant for trade and militrary power. It has always has been a politcally contentious region, and remains so to this day. For this reason, the nautical charts of the Black Sea Atlas reflect the political situtiation and its military conflicts in the 19th century.
[1] Ibid.
[2] Васюков, Евгений ; Архитектура Николаева. Депо карт. [Vasi͡ukov, Evgeniĭ ; Nikolayev Architecture. Map Depot.] http://archmykolaiv.com/depo-kart/.
Imperial Russian Nautical Charts of the Black Sea Atlas at the AGSL Part I
By Josephine Miller
The Crimean War: Loss of the Black Sea Fleet and Reform
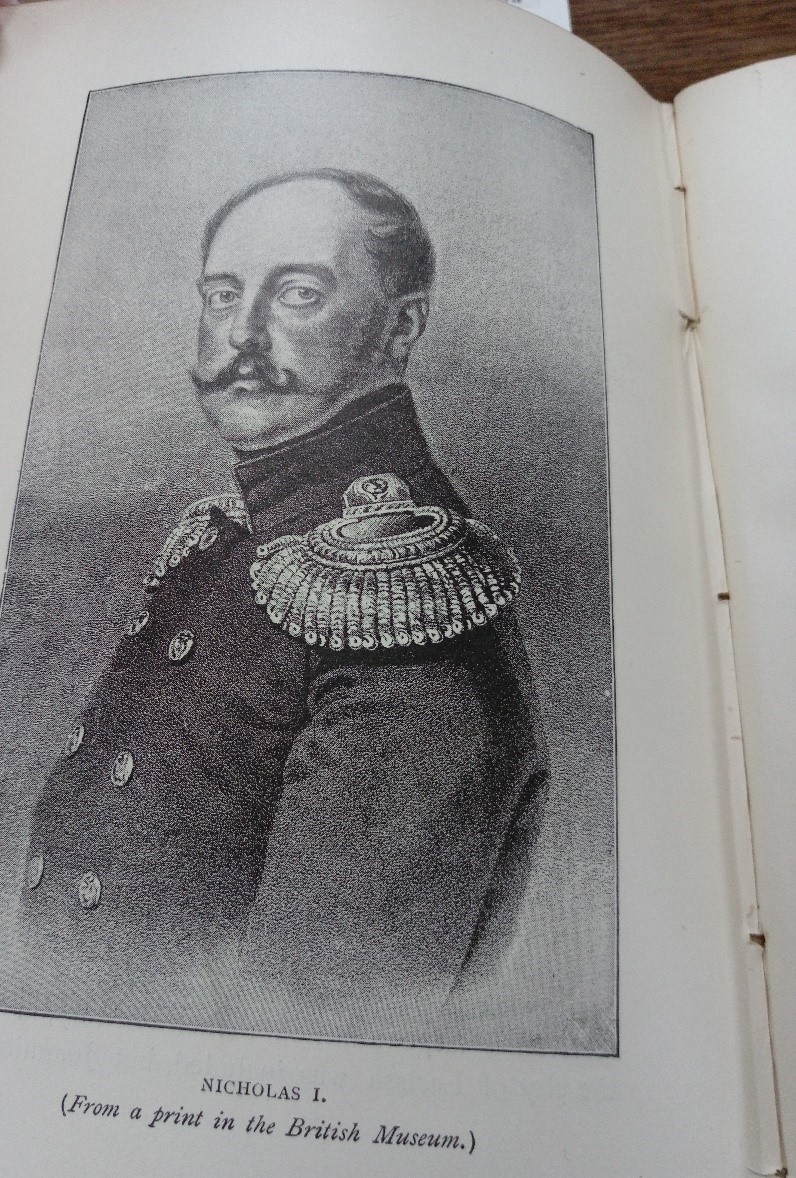
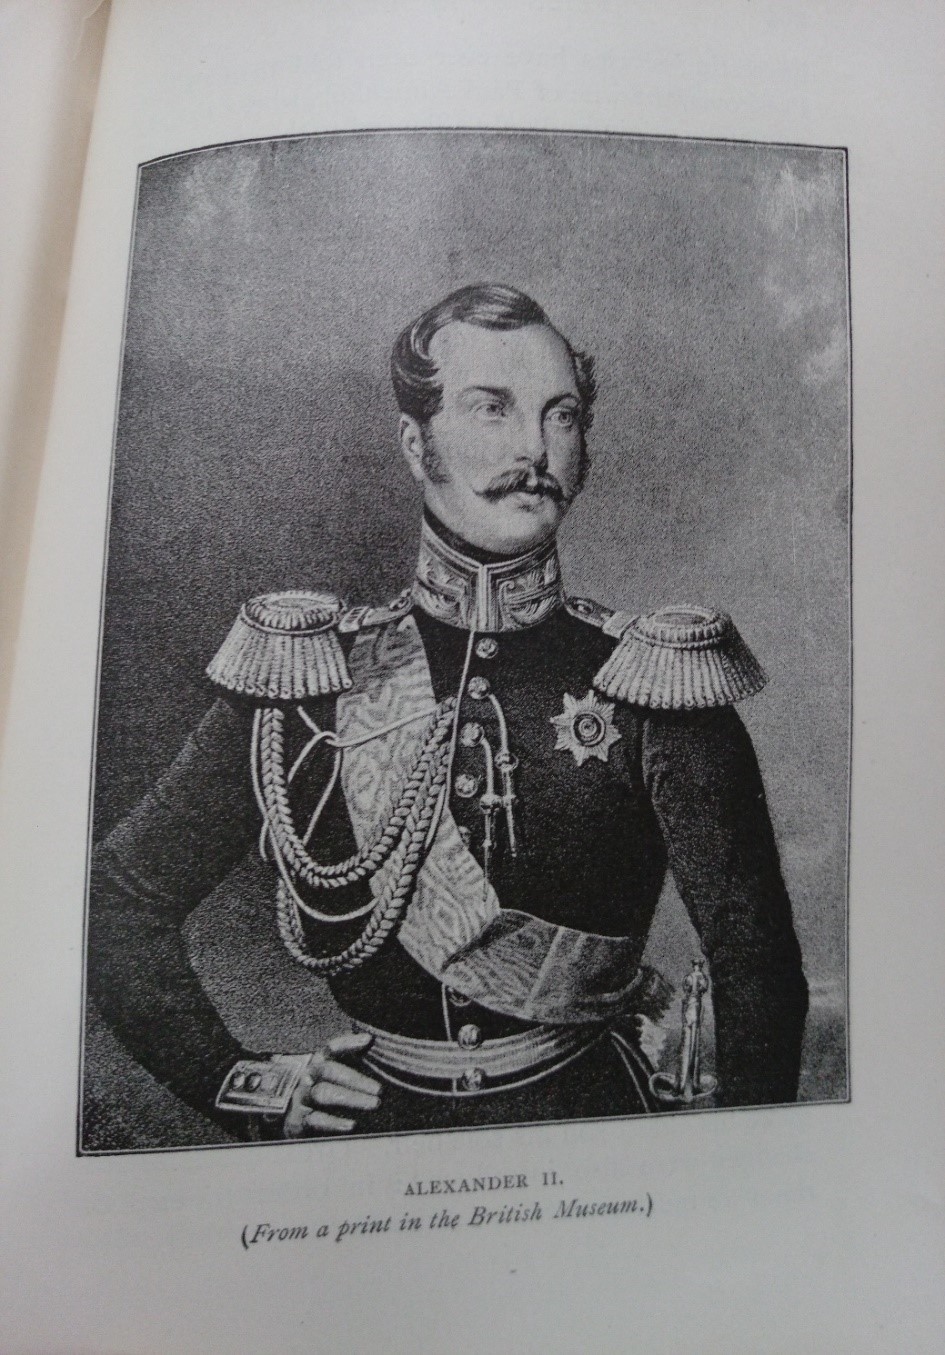
Tsar Alexander II (1818-1881) ascended to the throne on February 19 1855. He succeeded his father Tsar Nicholas I, who died at the age of 58 while Russia was losing the Crimean War (1853-1856). The war was fought between the Russian Empire and the alliance of the Ottoman Empire, Great Britain, France, and Sardinia. Alexander II came to the throne at the age of 36 at the end of the war. In the beginning of his reign, the young tsar was forced to face to the defeat of the Russian Empire. The Treaty of Paris was signed on March 30 1856, officially ending the Crimean War.
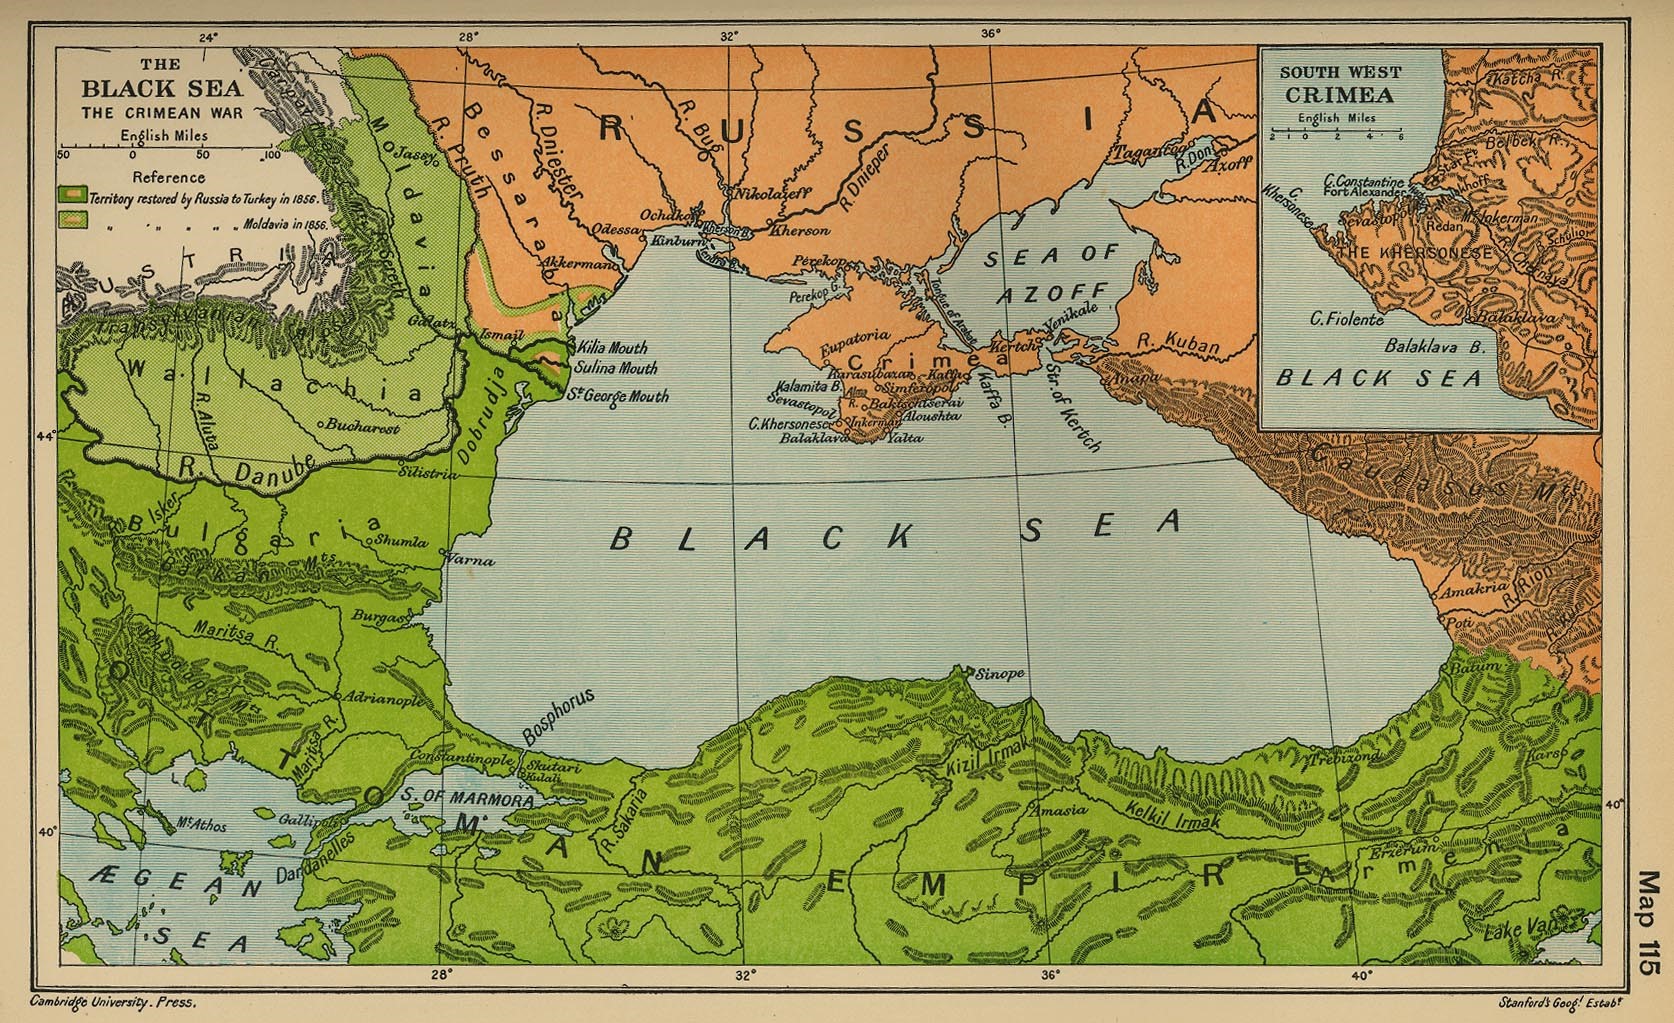
In the treaty, Russia ceded the mouth of the Danube and some of Bessarabia to the Ottomans. Additionally, Russia accepted the neutralization of the Black Sea. Neutralization meant not maintaining a navy or coastal fortifications in the Black Sea. In addition, Russia withdrew from the Danube Principalities of Moldavia and Wallachia and accepted an international commission to oversee navigation of the Danube. Russia also forfeited its claim as protectorate of Orthodox Christians in the Holy Land and in the Ottoman Empire. The Crimean War was a great defeat for the Russian Empire, so much so that one rumor circulated that Nicholas I had poisoned himself. The war signified the decline of Russia’s influence in Southeastern Europe and the Near East. [1] As Russia was losing the war and Nicholas I approached death, he requested his funeral to be modest and the period of mourning to be as brief as possible. [2]
The defeat of Crimea was pivotal moment for Russian history. Notably, the Black Sea has historically been of great political importance for Russia, given its warm water ports. The defeat made a deep impression on the young Tsar Alexander II. He began his reign having to deal with the consequences of his father’s reign. Nicholas I had been a conservative autocrat who believed it was his sacred duty to uphold tradition. Under Nicolas I, Russia remained frozen in time. His rule is regarded as a conservative reaction to the Enlightenment. This reaction or rejection is best explained by his doctrine on Official Nationality (Теория официальной народности), which was based on the Triad “orthodoxy, autocracy, and nationalism” (Православие, самодержавие, народность).
The conservative disposition of Nicholas I is seen as the primary reason for the defeat in Crimea by the reformers. Before the war, Russia and its military enjoyed the positive reputation it had earned in its victory over Napoleon. However, while Nicholas I focused on upholding the tradition of the Triad, the West advanced scientifically and militarily. Consequently, when the war broke out, Russia faced the more advanced and modern armies of the West. The war revealed how lacking and inefficient the Russian military was in comparison to the West. The inefficient bureaucracy of the military, the lack of modern technology, and corruption were all examples of the inadequacies of the military. The outdated Russian military was frozen in the Napoleonic era, while the Allies had advanced into the Victorian era.
The industrialization in the West created a technological gap between Russia and the West, in particular, Russia and Great Britain. Great Britain was Russia’s primary imperial rival at the time. Technologically, the world had changed quickly in the middle of the 19th century. The period saw new technological innovations such as railroads, telegraphs, improved steam engines, and improvements in steel and iron. Significantly, Great Britain had the capability to import food and raw materials from around the world, allowing the mass production of consumer goods. Furthermore, the expanding of education in Western society accommodated this industrialization; Russia, on the other hand, lagged behind in all of these areas.
Lagging behind proved to be Russia’s disadvantage in the war. The fighting in the Crimean War revealed these disadvantages in the Russian military. Russia’s fleet of sailing ships could not fight against the steamships of Britain and France. Moreover, the Russian military relied on serfs for soldiers. Serfs could not provide the needed gunpowder and shells for battle. Ultimately, Russian soldiers marched into battle with smoothbore muskets, only to face the long-range artillery fire of the allies. [3]
In the aftermath of Crimea, reform found supporters from both the Slavophiles and the pro-Western factions. Both had been greatly upset by the defeat. The Slavophiles saw war against the Ottomans as a crusade for Orthodox Christianity and for Constantinople. Whereas, the Westernizers were dismayed by Russia losing its preeminent status as a European power that it had earned after the Napoleonic wars.
Alexander II began his reign as a proponent of reform, both militarily and politically. His most famous reform was the abolishment of serfdom, earning him the title the Tsar-Liberator or Alexander the Liberator. Alexander II was not the first tsar that wanted to end serfdom, but the Crimean War provided the opportunity. The serf army proved to be ineffective. If Russia were to modernize it would need to industrialize, which would also include a citizen army. The institution of serfdom inhibited both modernization and industrialization. Serfdom kept the Russian economy agrarian and stifled the innovation needed for industrialism. In the following decade, Alexander II enacted political and military reforms in order to modernize Russia and its military.
Revival of the Black Sea Fleet
Nonetheless, the treaty of Paris limited naval ambition due to the demilitarization stipulation in the treaty. Opportunity would arise in 1870s for the Black Sea Fleet. On September 1, 1870, Emperor Napoleon III surrendered to Prussia. During the Franco-Prussian War, Russian remained officially neutral. However, according to the memoirs of Count Dmitry Milyutin, Field Marshall and Minister of War Alexander II sent St. George Crosses to Prussian officers and a congratulatory telegram to King Wilhelm I after Prussian victory. Notably, Wilhelm I was the maternal uncle of Alexander II. Additionally, Russian officers served in the Prussian army. [4]
The Franco-Prussian War led to the establishment of the German Empire. Upon unification, King Wilhelm I of Prussia became German Emperor. Otto von Bismarck, Chancellor of the new German Empire, wanted to gain favor with Russia due to the mutual threat of Polish nationalism. Bismarck sent Count Constantin von Alvensleben to Russia in order to come to an agreement on cooperation against Polish rebellion. [5]
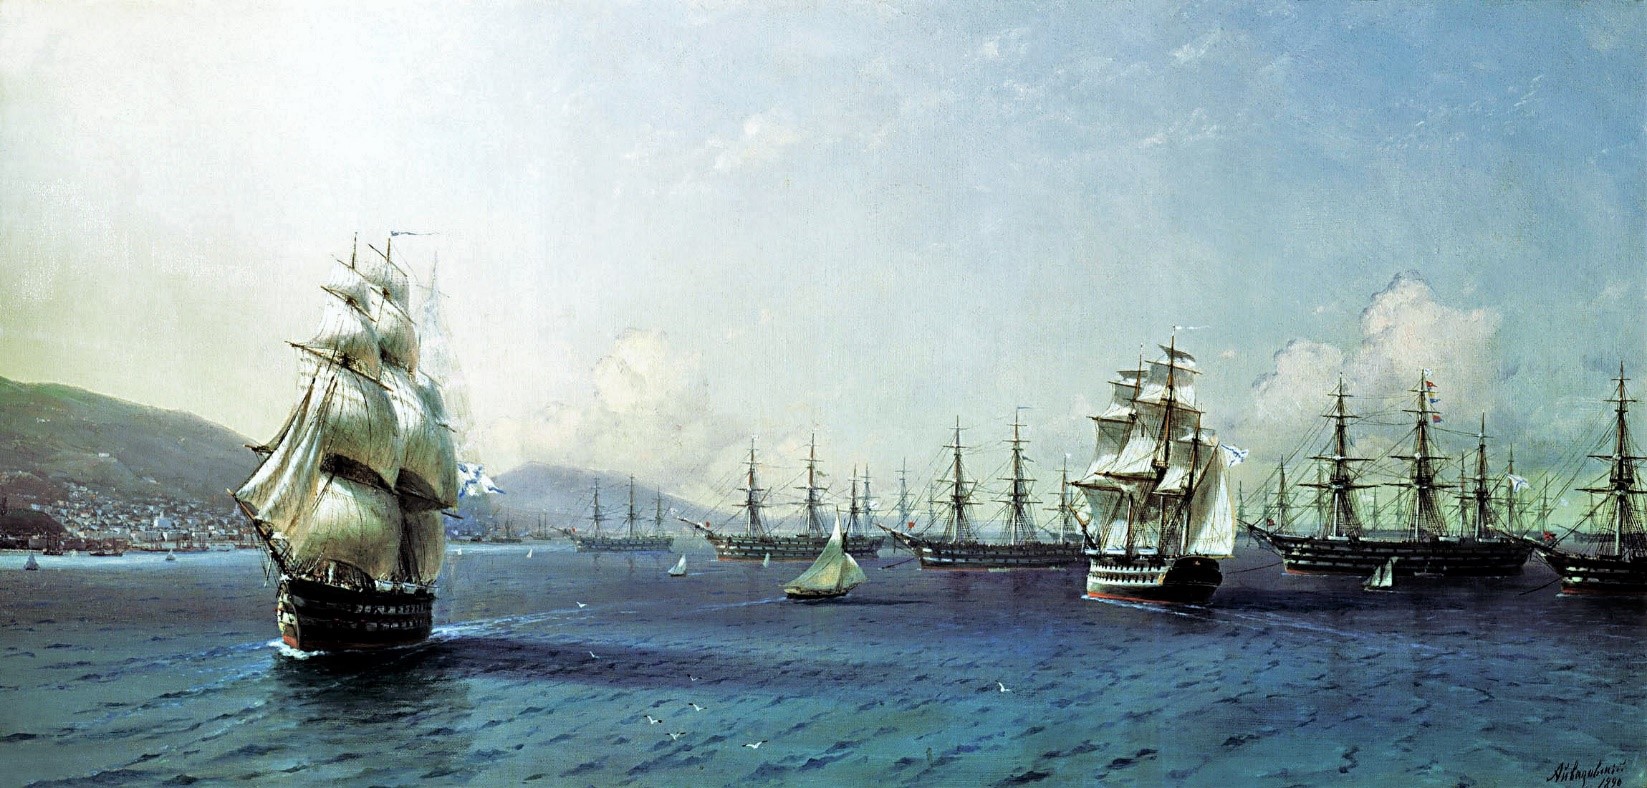
Black Sea Fleet in the Bay of Theodosia, just before the Crimean War, 1890, Ivan Aivazovsky,
Feodosiya National Gallery I. K. Aivazovsky
German rapprochement aided Russia in a more important foreign policy objective for Russia: the Black Sea. In 1870, Prince Alexander Gorchakov, Foreign Minister, used France’s defeat to denounce the Black Sea clause of the Treaty of Paris (1856). Gorchakov’s denouncement included the refusal to uphold the clause. In his justification, Gorchakov cited to Turkey violations of the treaty and he argued that the conditions of warfare have become more dangerous since 1856 due to the more destructive armaments. Bismarck supported Gorchakov on the Black Sea clause. Though Britain protested, the European powers agreed to it through the Treaty of London in 1871, which abrogated the Black Sea clause of the Treaty of Paris. This allowed Russia to rebuild the Black Sea Fleet and military fortifications on the Black Sea. [6]
Egor Pavlovich Manganari (Егор Павлович Манганари)
The Atlas of the Black Sea (Атлас Чёрного Моря) was published between 1841 and1842. The surveying for the atlas was led by Captain-Lieutenant Egor Manganari (1796-1868). He was the eldest son of Panayot Manganari, (also known as Pavel Manganari in Russian). Panayot Manganari was a Greek nobleman and immigrant to the Russian Empire from the Greek island Chios. He immigrated to Russia due to conflict with the Ottomans, taking advantage of the Catherine the Great’s invitation to settle Greeks in the Southern Russian Empire. He married Alexandra Timofeevna and they had six children: three daughters, Maria, Ekaterina, and Anastasia, and three sons who served as officers in the Black Sea Fleet, Egor, Ivan, and Mikhail. The family first lived in Yevpatoriya and later in Nikolayev. [7]
Egor Manganari served in the Black Sea Fleet of the Imperial Russian Navy as a naval officer and hydrographer. He attended the Black Sea Navigational School in Nikolayev. There he studied Russian, English, classical subjects, and subjects related to geography such as mathematics, geodesy, navigation, and cartography.[8]
In 1813, he entered the Black Sea Fleet as a Navigation Assistant. By 1816, he received the rank of First Officer Midshipman and was later promoted to Lieutenant in 1821. He was appointed commander of the rig Nikolai (Николай) where he produced an inventory the Dnieper Estuary and the Bug River. His work was highly praised, earning him the Order of Saint Anna, 3rd Class, and the commission to survey the Azov and Black Sea. He commanded the Nikolai until 1827, when he received the command of the yacht Golubka (Голубка). The expedition of the Black Sea was launched in 1826 and continued for ten years. Manganari still participated in the Russo-Turkish War (1828–29), for which he was awarded the Order of Saint Vladimir, 4th Class. In 1833-1834, during the Caucasian War, he also did hydrographic surveys of the Caucasus, for which he was awarded the Order of Saint Stanislav, 2nd class. [9]
By 1838, he had been promoted to lieutenant-colonel and completed his survey of the Black Sea and Azov Sea. His nautical charts were supported by the Admiral Mikhail Lazarev, Commander of the Black Sea Fleet. After the Black Sea expedition concluded, he was granted permission by the Navy to publish them. The nautical charts were brought to Saint Petersburg to be engraved and published as an atlas. After the publication of the atlas, Manganari was awarded the Order of Saint George, 4th class. Manganari continued to do hydrographic surveying of the Black Sea after the publication of the atlas. In 1849, he received the rank of major-general and was appointed as the director of the Lighthouses of the Black Sea and Azov Sea. Manganari remained at that post until he retired in 1856. [10] [11]
[1] Nicholas V. Riasanovsky and Mark D. Steinberg, A History of Russia, (New York: Oxford University Press, 2011), 333-336.
[2] Kaputina, Tatiana Aleksandrovna. “Nicholas I.” In The Emperors and Empresses of Russia: Rediscovering the Romanovs, (Armonk, New York: M. E. Sharpe), 292.
[3] Russia in the Nineteenth Century: Autocracy, Reforms, and Social Change, 1814-1914, (Armonk, New York: M.E. Sharpe) 85.
[4] Ibid. 161.
[5] Nicholas V. Riasanovsky and Mark D. Steinberg, A History of Russia, (New York: Oxford University Press, 2011), 380.
[6] Russia in the Nineteenth Century Autocracy, Reforms, and Social Change, 1814-1914, (Armonk, New York: M.E. Sharpe) 161.
[7] Выдающиеся морские гидрографы братья Манганари. Часть I. Николаевский Базар. [Outstanding Marine Hydrograph Brothers. Part I, Nikolayev Bazar].
[8] Ibid.
[9] Ibid.
[10] Ibid.
[11] Üçsu, Kaan. “Cartographies of the ‘Eastern Question’: Some Considerations on Mapping the Sea of Marmara and the Black Sea in the Nineteenth Century.” In Philosophy of Globalization, (Berlin/Boston: De Gruyter, 2018) 259-260.
To the Lighthouse: Representations of Lighthouses on Maps
By Lauren Maddox
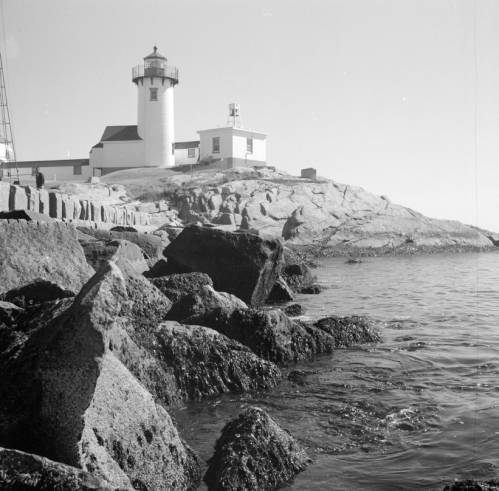
Click the link to see Clarence W. Sorensen’s photo of a lighthouse in Gloucester, c. 1934-1969 in our Digital Collections
Lighthouses have been guiding us home over the rough sea from our earliest maritime beginnings– but our understanding of lighthouses and how we represent them on maps and nautical charts has changed drastically since these beginnings. While references to early lighthouses exist, including Homer’s claim that Palamedes devised a system of lit beacons to guide sailors, the first “regularly maintained” lighthouse in antiquity was on Cape Incihisari. J. Saxby Wryde, however, claims in his British Lighthouses: Their History and Romance that the most celebrated lighthouses in antiquity were built 400 years after this. The Colossus at Rhodes was erected in 278 B.C. and destroyed by an earthquake in 224; the remains were sold as brass and carted away on camels by a merchant. In 270 B.C., the famous Lighthouse of Alexandria was constructed in honor of Ptolemy Philadelphus on a small island in the Bay of Alexandria.
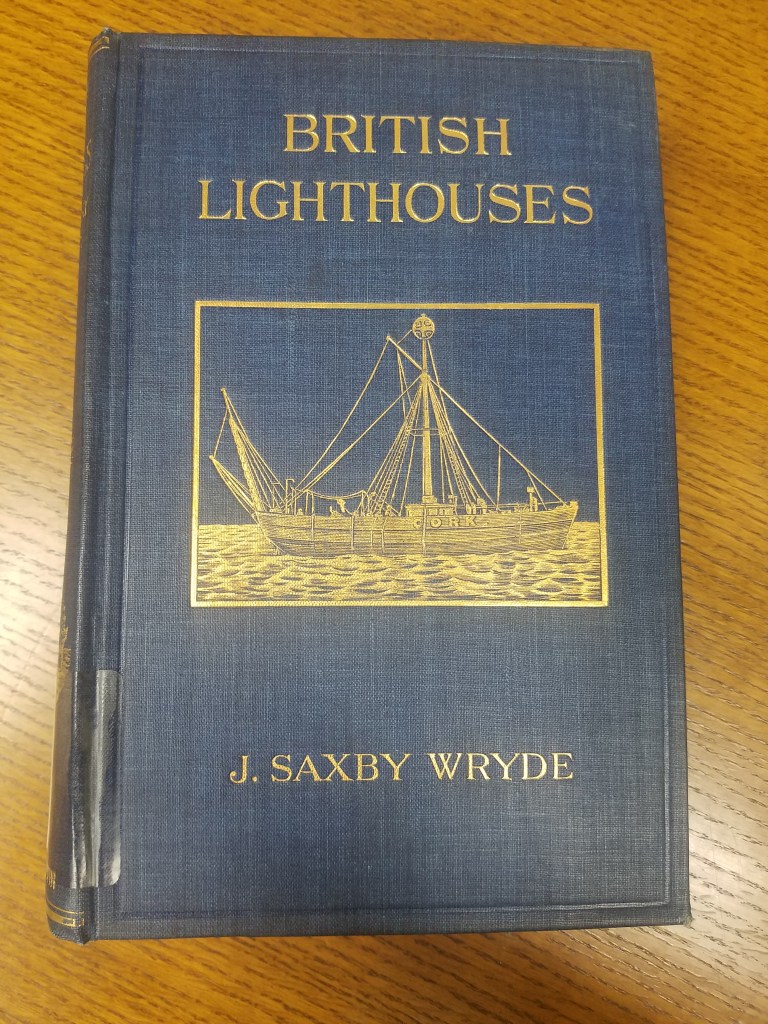
Click the link for details about the 1913 Edition of British Lighthouses 
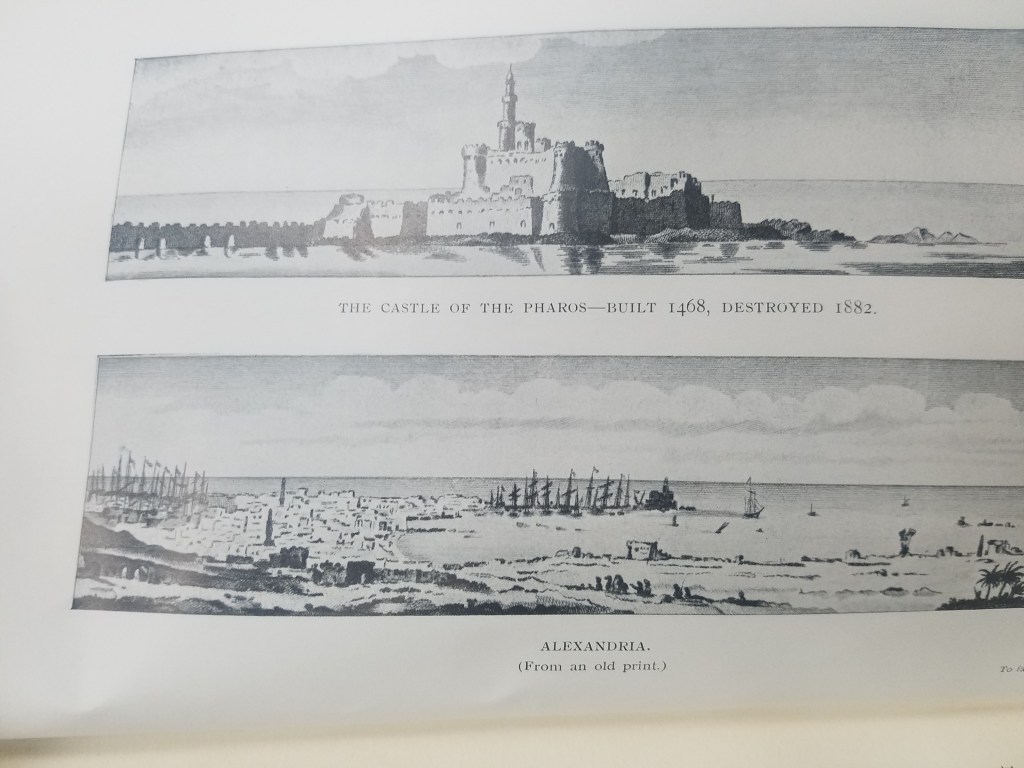
Illustration of the Lighthouse of Alexandria
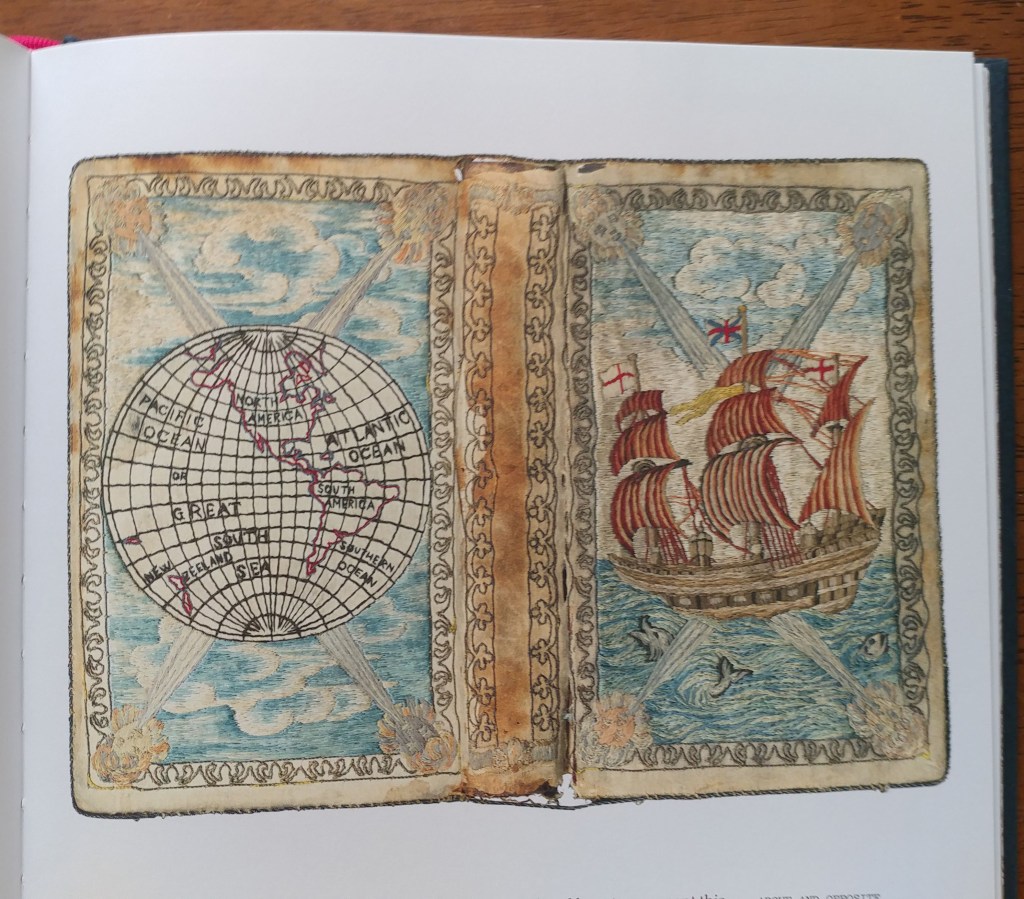
The function of lighthouses has also evolved over the years; in antiquity, lighthouses were only expected to indicate the location of ports. Lighthouses as we understand them today act as warnings for boats approaching reefs and rocky shores. This understanding of lighthouses as way markers is reflected on ancient maps. The Lighthouse of Alexandria is depicted pictorially in Braun and Hogenberg’s 16th century atlas Civitates Orbis Terrarum–the lighthouse is given the same attention as the city’s obelisk or its ruins; its existence is simply recorded and labeled with a single word: pharus for lighthouse. The lighthouse has obviously done its job, though; ships are shown moving towards the lighthouse and the port it is indicating. One ship is even flying St. George’s Cross, the British flag used by crusaders that was later adopted as the national flag in Medieval England.
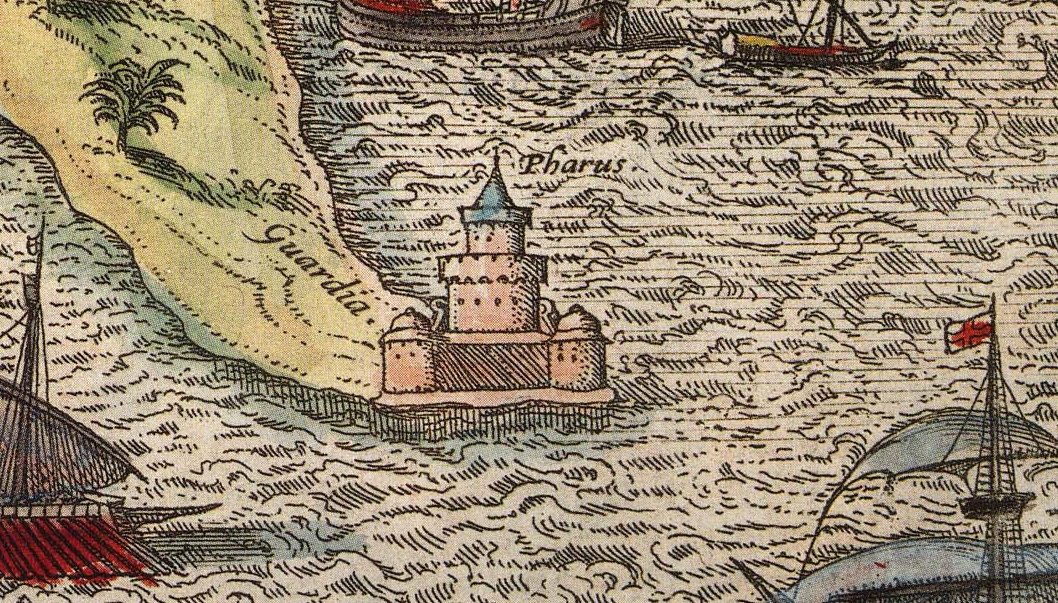
Click the link to see the Atlas the illustration of The Lighthouse of Alexandria is in 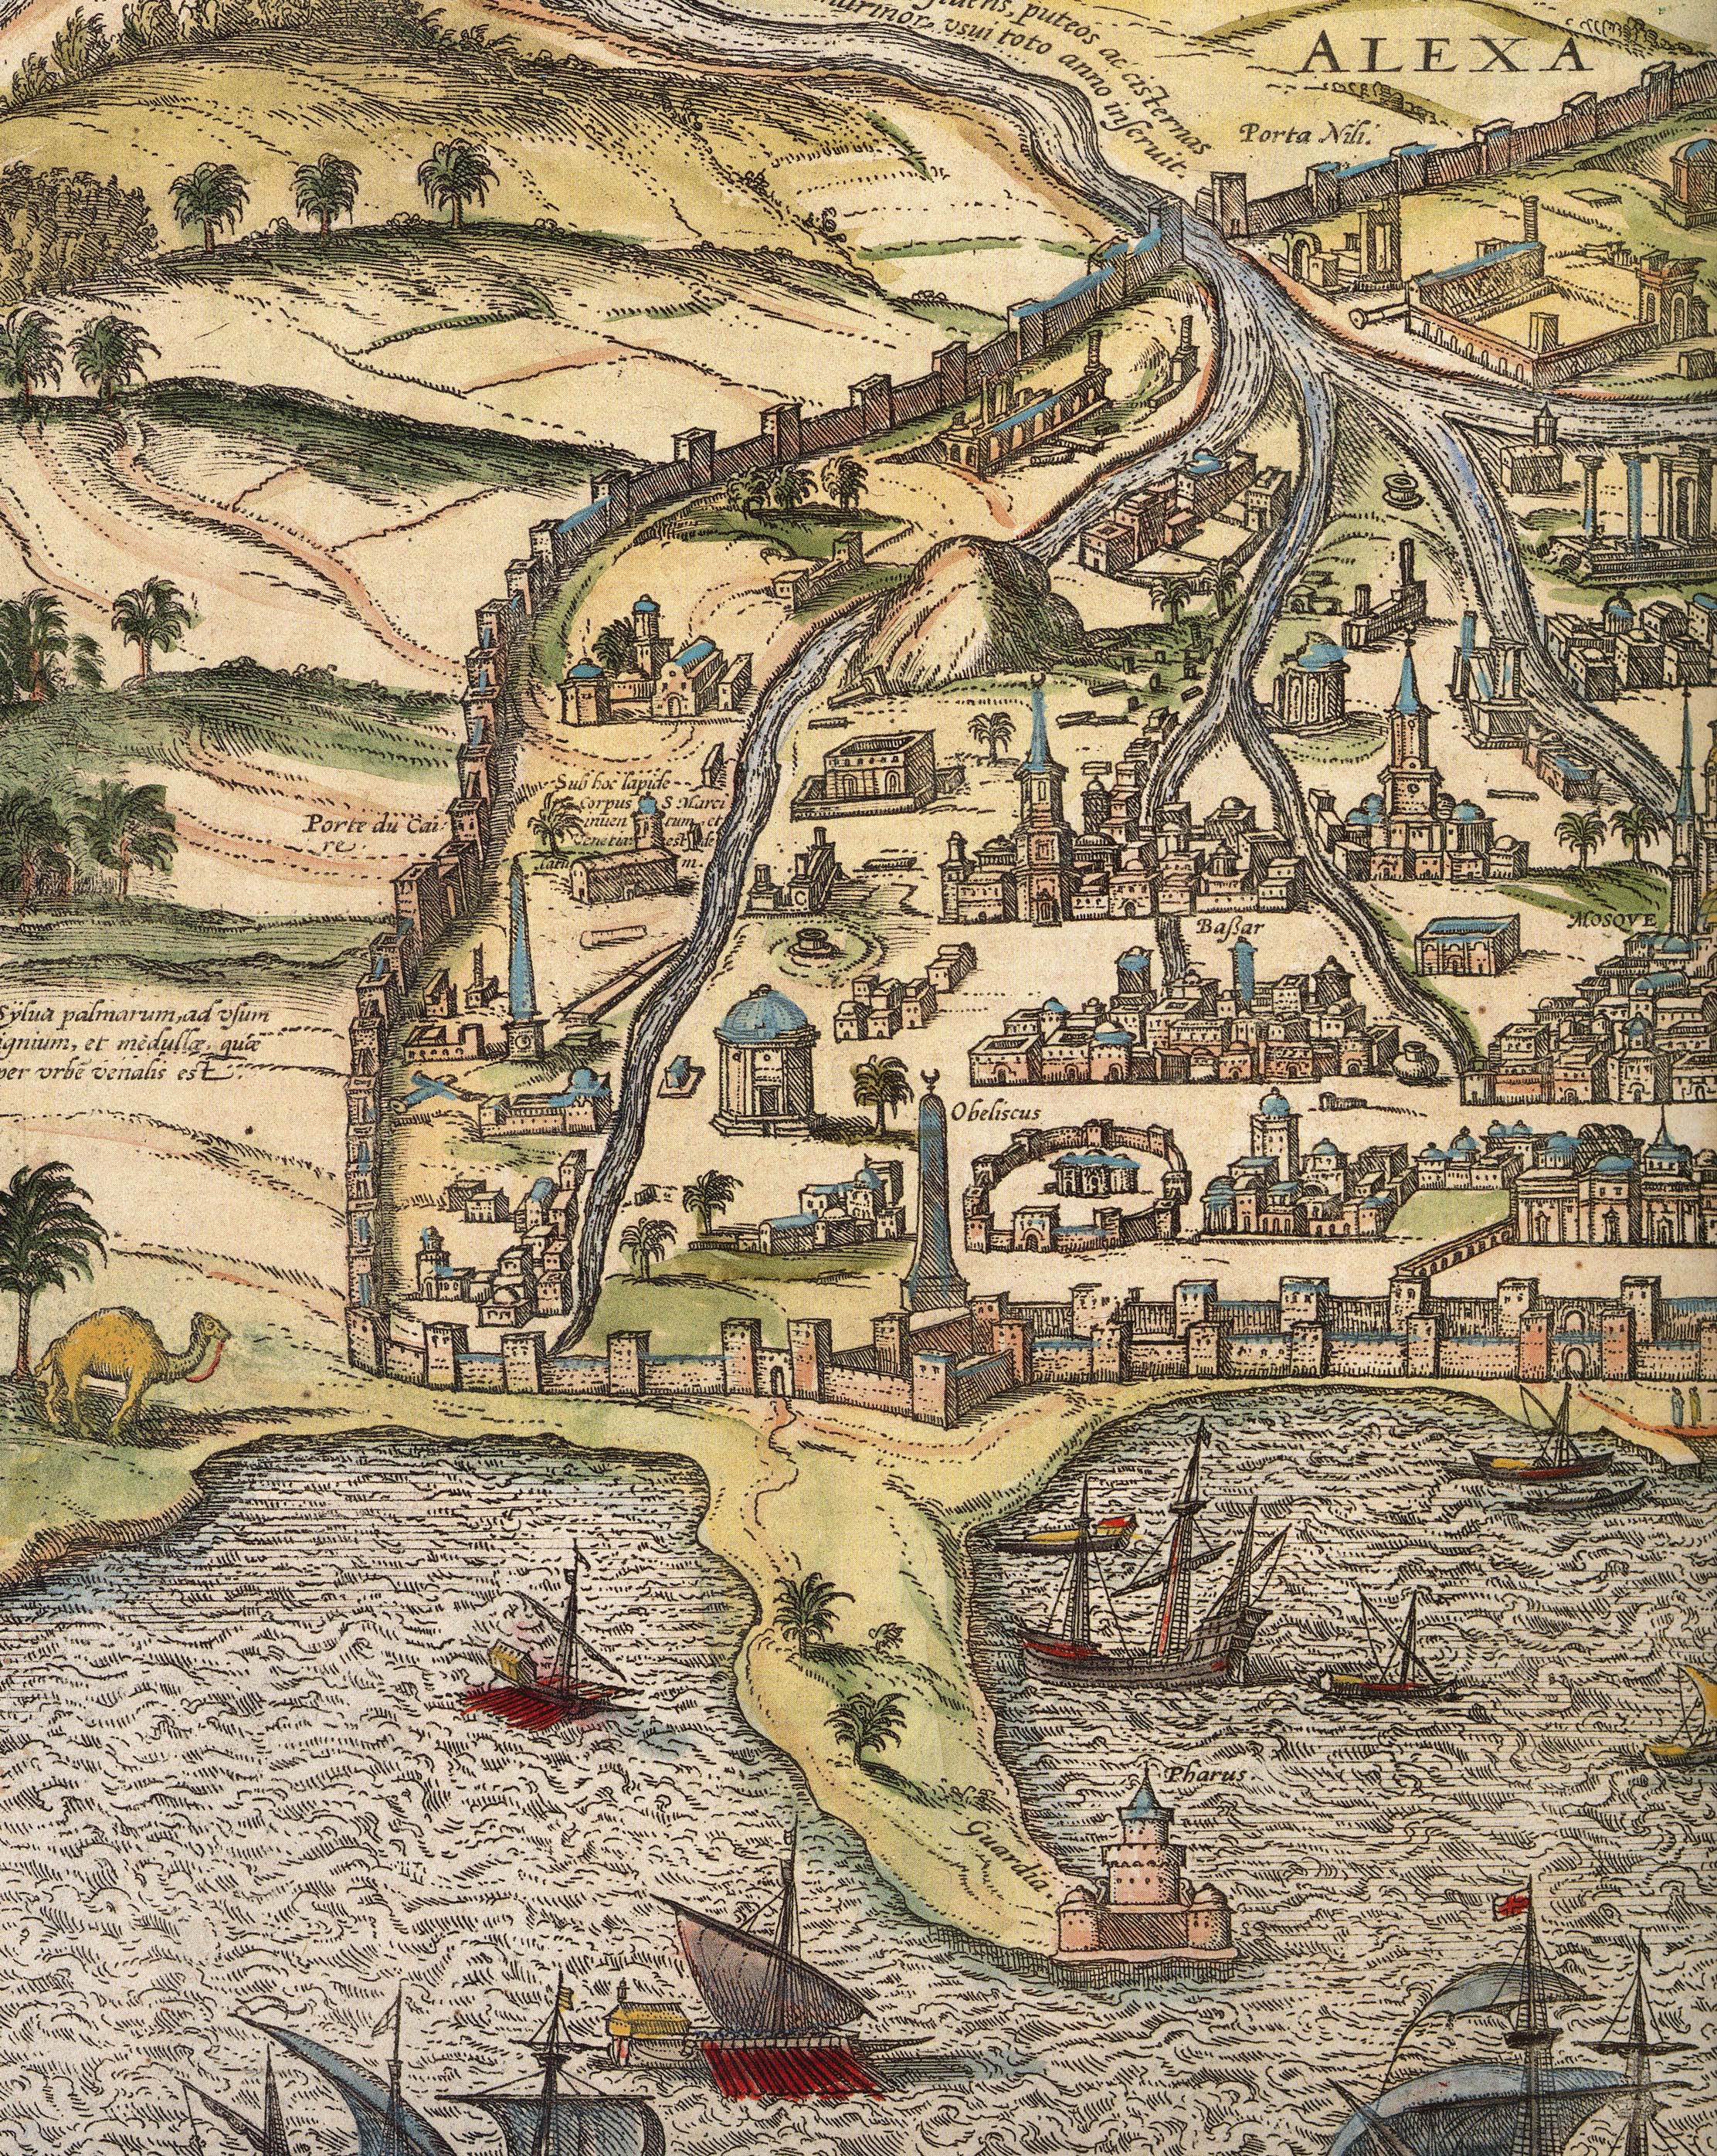
Alexandria
The Lighthouse of Alexandria was also doomed to be destroyed by earthquakes, but the bricks were used to construct the Citadel of Quaitbey. UWM professor Caroline Seymour-Jorn donated her photo collections to the AGSL , including several photos from 1996 visit to Egypt of the citadel.
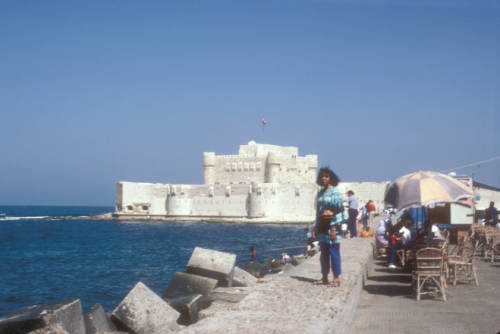
Click the link to see this photo of Alexandria, Egypt: View of Quaitbey Citadel courtesy of Caroline Seymour-Jorn in our Digital Collections
The Roman Empire adopted the Greek pharos and began building them across Italy and the Empire, including the Tower of Hercules in A Coruña, Spain and Dover. The lighthouse in A Coruña is still functional, but many Roman lighthouses were abandoned in the Middle Ages and replaced. As travel and trade by sea became more and more prevalent, the need for lighthouses grew.
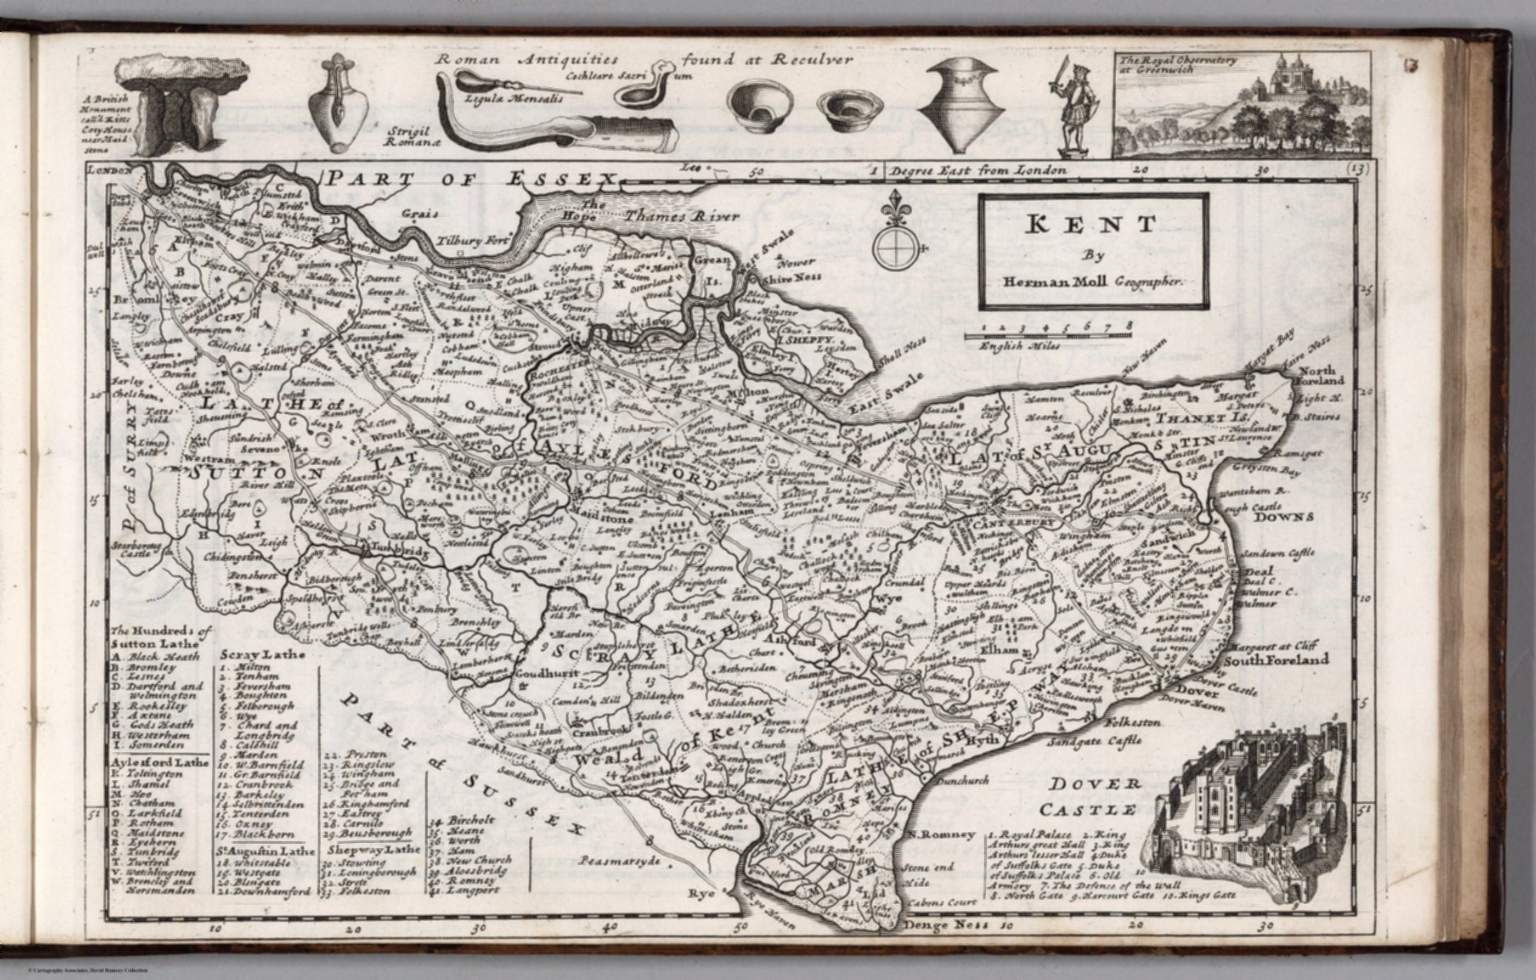
Click the link to see the 1724 Map of Kent by Herman Moll in our Digital Collections 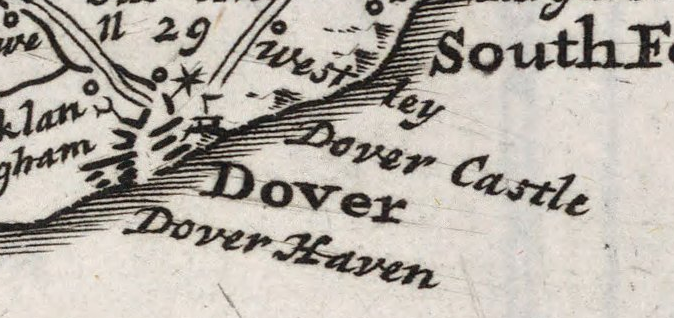
Dover, lighthouse indicated pictorially
Most lighthouses constructed during this time are no longer operational, but the Hook lighthouse in Ireland continues to be used. The building has been in operation for over 800 years and is now managed by the Commissioners of Irish Lights. Lighthouses in England were privately owned and operated during the Middle Ages and beyond. Because there was no regulation or standard policy, lighthouse keepers began to abuse their posts, stealing ship cargo and demanding payment from sailors. This problem became so pervasive that the Lighthouse Act of 1836 was passed in the hopes of making coasts safer for ships coming to port.
In the 18th century, lighthouse construction advanced to match the needs of a growing transatlantic trade. Bigger, better lighthouses were being built and were now being used as more than way markers; they could warn incoming ships and regulate boat traffic. In 1716, the first American lighthouse was built on the Boston Harbor; many more began to spring up in the subsequent years, and in 1851 Congress passed an act to facilitate the creation of the US Lighthouse Board, which would eventually be dissolved to make room for the Lighthouse Service. The AGSL has many of the Service’s records, including records of their history, finances, regulations, and buoyage and lighthouse systems.
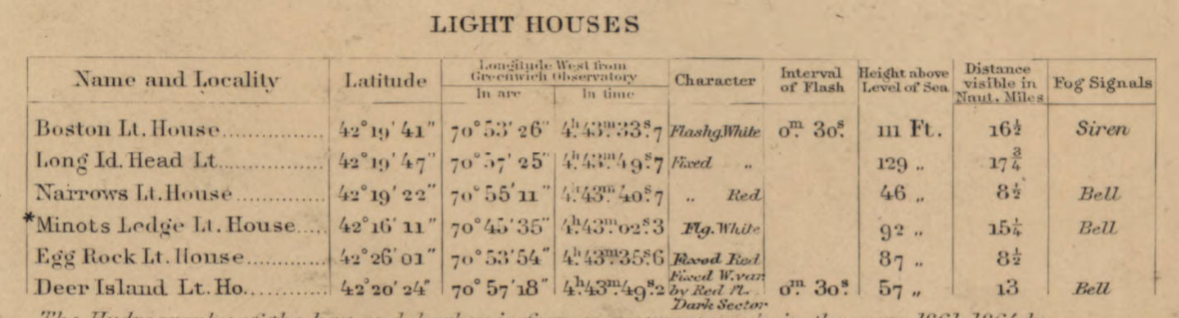
Click the link to see the Boston Light Referenced on 1889 Map of Boston Harbor in our Digital Collections
With lighthouses increased utility and presence on coastlines, their representation on maps began to shift. Instead of being just illustrations or seamarks, lighthouses began to take on a new navigational importance. Diagrams of lighthouses, recordings of the range of their lights, and more exact buoy locations became a common part of maps.
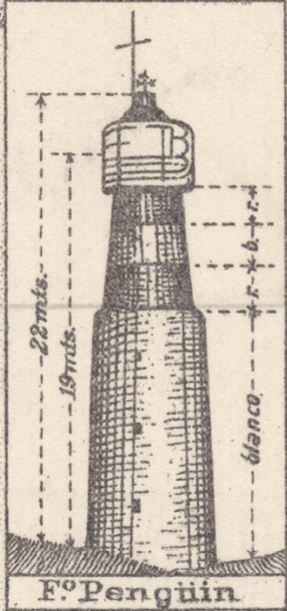
Click the link to see Lighthouse detail from 1926 map of Puerto Deseado, Argentina in our Digital Collections 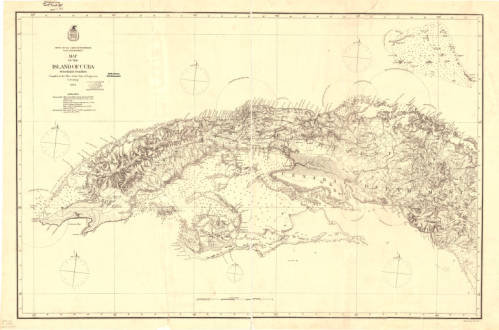
Click the link to see the Map with Lighting information for Cuba 1874 in our Digital Collections 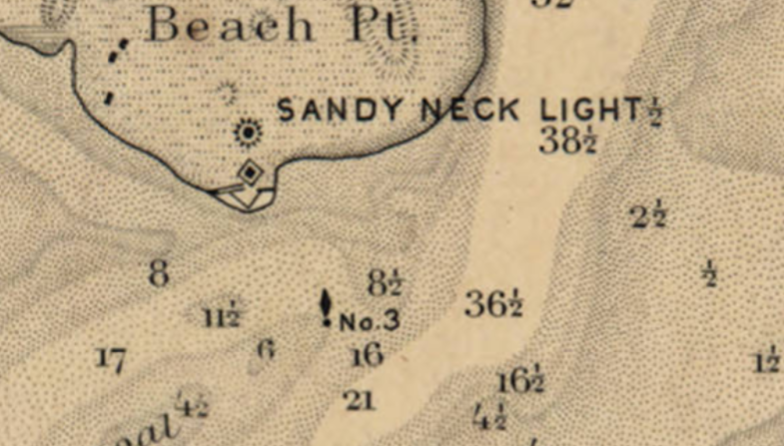
Click the link to see the Lighthouse and Buoy on Map of Barnstable Harbor, Massachusetts 1880 in our Digital Collections 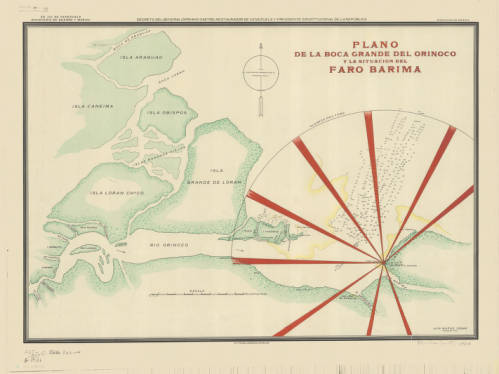
Click the link to see the Lighthouse depicted in 1906 Map of Rio Barima, Venezuela in our Digital Collections
Now lighthouses have a romantic air as well as a practical use; writers and artists work to capture the lighthouse. To the Lighthouse by Virginia Woolf comes to mind. And here, in Milwaukee, where the AGSL lives, we have our share of lighthouses on our Great Lake Michigan.

The Island of California
By Lauren Maddox
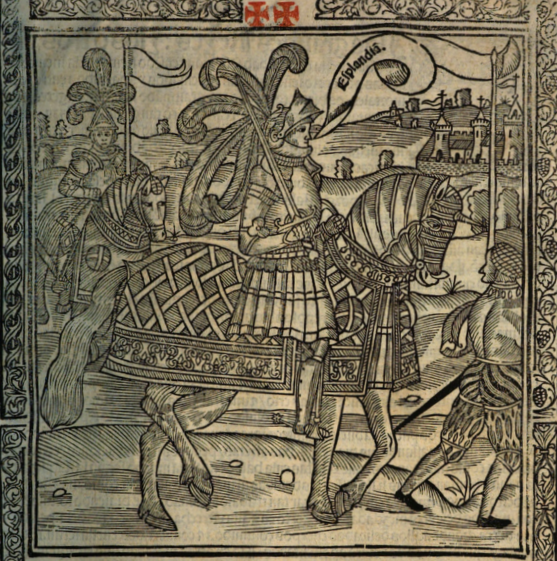
Illustration from La sergas de Esplandián
“Know that, on the right hand of the Indies, there is an island called California, very near to the Terrestrial Paradise;” this description, found in Chapter 157 of Las sergas de Esplandián, names a California at least sixteen years before Cortez spotted the coast of the land he would name California. The Spanish romance, which was a sequel to Garci Rodríguez de Montalvo’s better-known and better-received Amadis de Gaula, was largely forgotten despite being the first mention of a place named California. Esplandián was considered an inferior sequel and faded into insignificance; it’s greatest claim to fame is its brief appearance in Don Quixote’s library in Cervantes’s comical romance. And even that reference was unflattering. The curate chose to burn Esplandián instead of Amadis de Gaula because, he said, we should not “spare the son for the virtues of the father.”
So, Las sergas de Esplandián was a failed romance that was quickly forgotten. But, as the first recorded use of California, it stands to reason that this forgettable Spanish romance could have inspired Cortez when he encountered the lowest tip of the Baja California Peninsula, 775 miles from where the peninsula joins the mainland. As far as Coretz could tell from his ship, he had found an island on the right hand of the Indies, very near to the Terrestrial Paradise.
The misconception that California was an island would persist throughout the 16th century, and resurface with new, incorrect maps released in the 17th and 18th century. In 1539, Cortez’s navigator Francisco de Ullou ventured northward into California and discovered it was a peninsula, debunking the theory that California was an island just six years after the first sighting of the peninsula. Somehow, the legend persisted despite fairly correct representations of the peninsula being published as early as 1569.
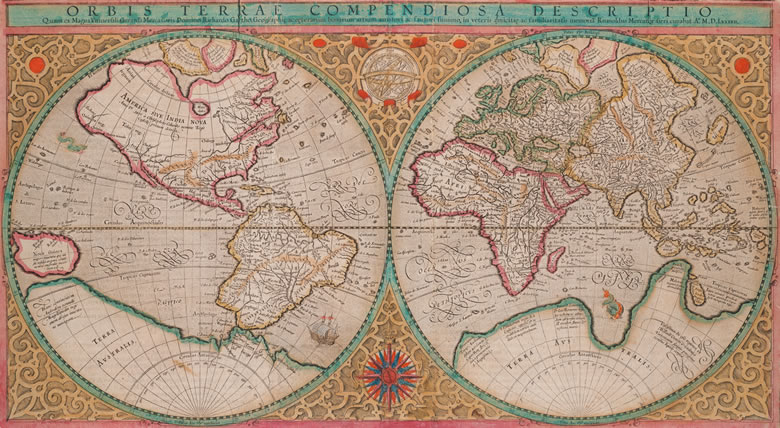
Mercator’s 1569 edition of Orbis terrae compendiosa descriptio from Envisioning the World: The First Printed Maps 1472-1700 Click the link to see this map in our Digital Collections
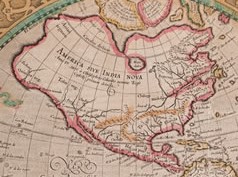
America in the Mercator Map
Many cartographers incorporated Ullou’s discovery of the peninsula into their maps, including this 1569 world map by Gerard Mercator. If you look closely at America, you can see the Baja California Peninsula clearly and correctly attached to the mainland. This representation wouldn’t stick–the Baja California Peninsula would be confused for an island again after Juan de Fuca’s voyage at the turn of the century. In 1592, de Fuca claimed to have found a strait he thought could be the Northwest Passage with a large island at its mouth. Only one account of this discovery survived, and the location of de Fuca’s strait was confused with California, reviving the representation of California as an Island.
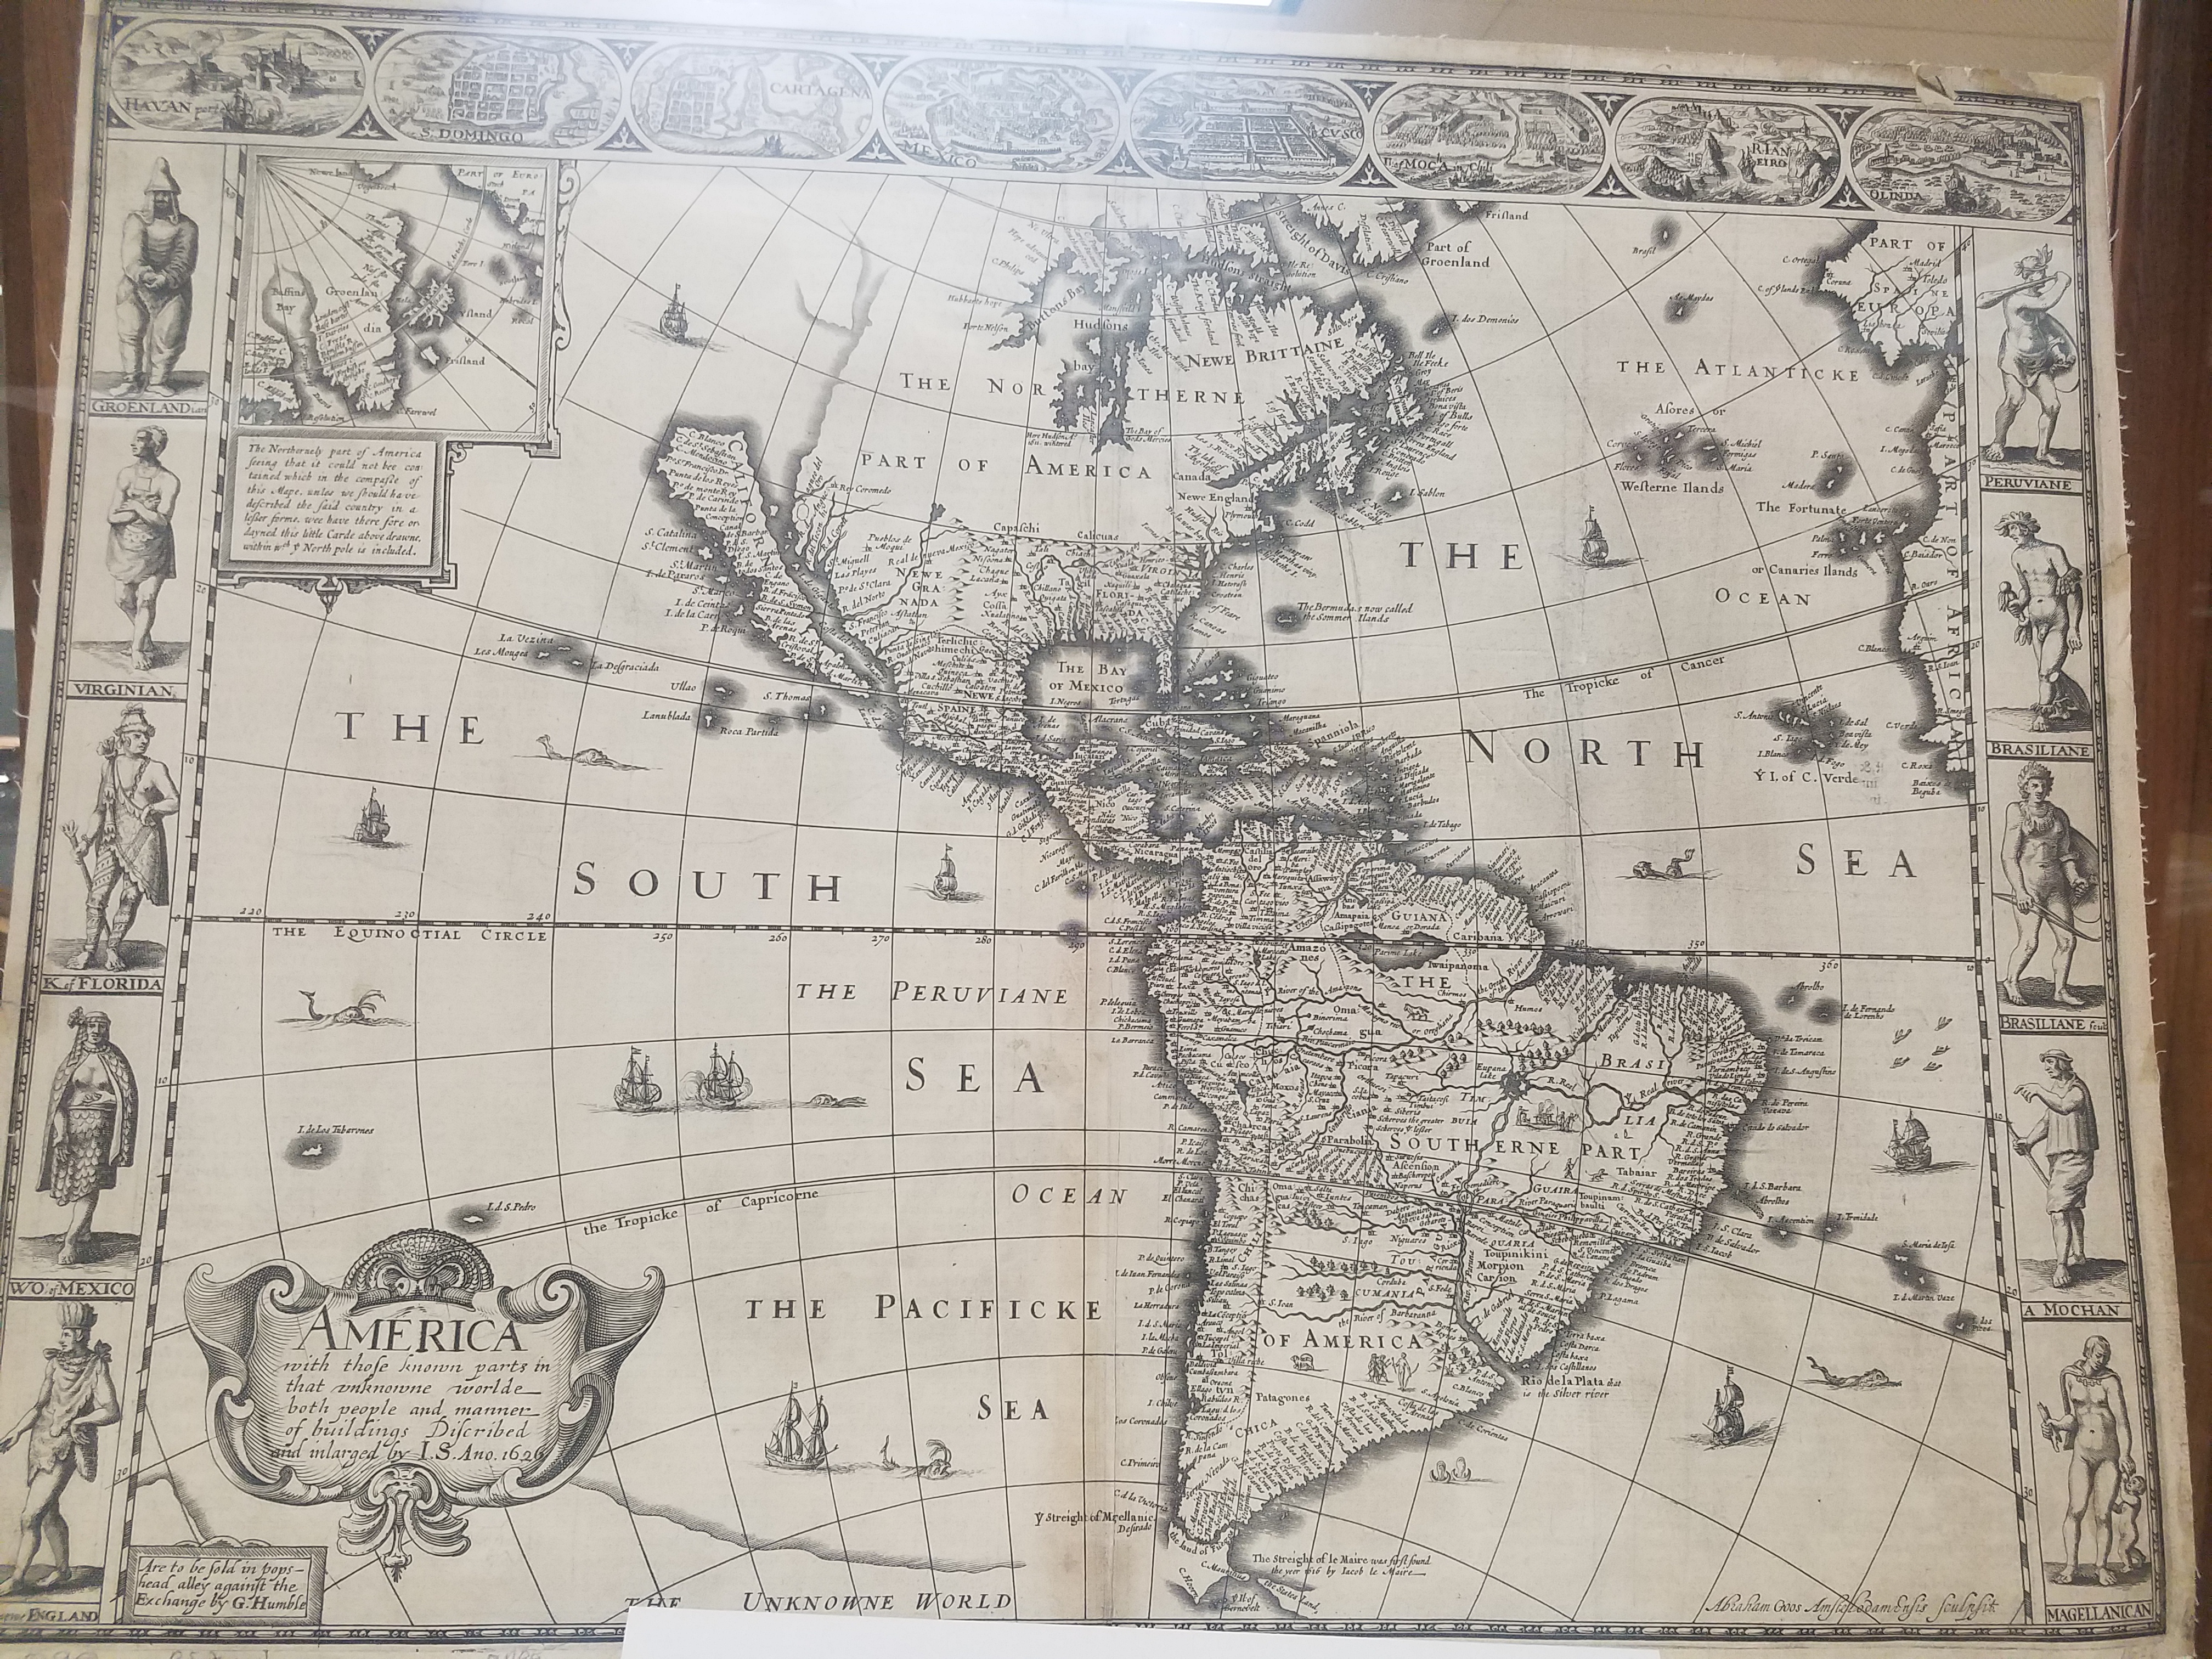
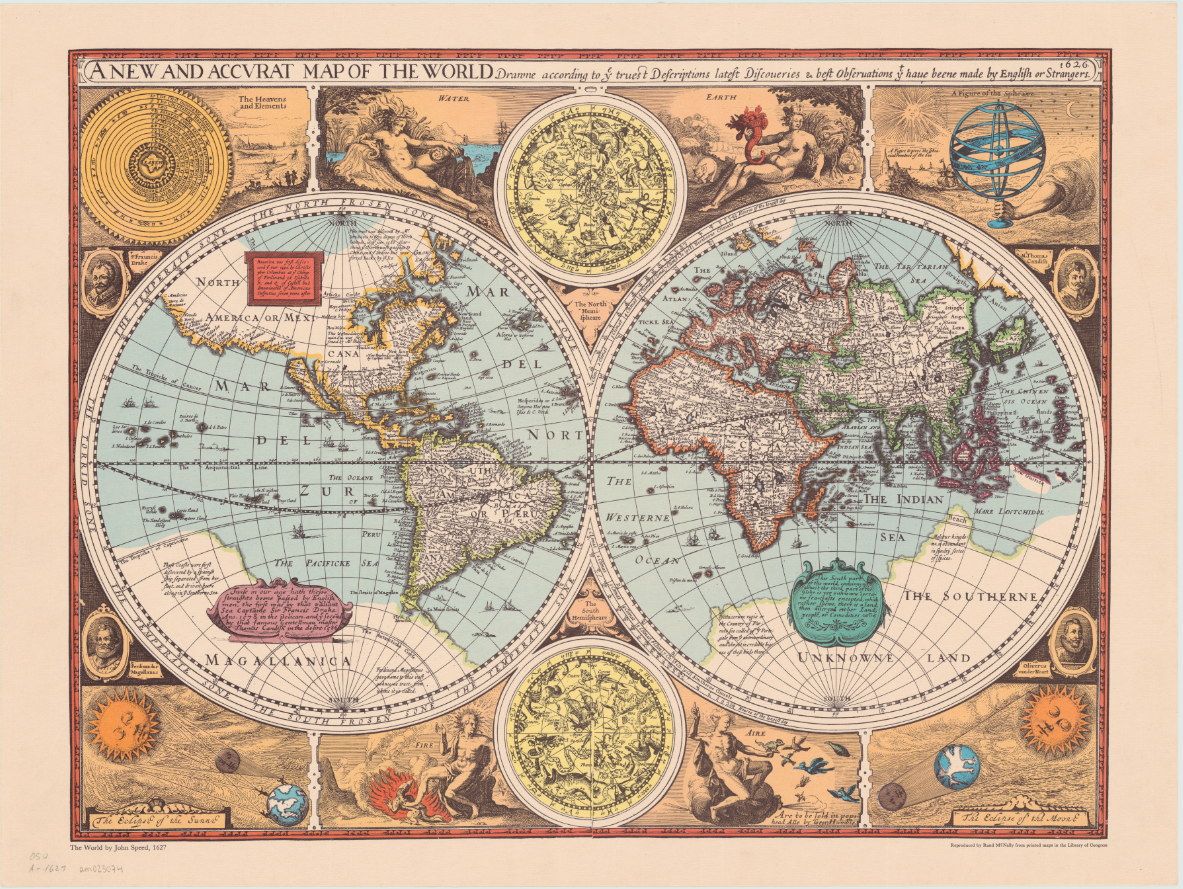
An overland expedition in 1602-1604 should have disproved de Fuca’s claim to have found a Northwest Passage, or at least cleared up any confusion about whether the Baja California Peninsula was the island he had claimed to see at the mouth of the strait. Despite Juan de Onate’s reports, the northern terminus of the Gulf of California was left vague on maps by the Spanish so that Cortez’s claim to the territory in 1533 could invalidate Drake’s later claim in 1579. Several maps released after Mercator’s map and de Onate’s reports show the peninsula detached from the mainland. One of the first atlas maps to depict California as an island was English mapmaker and historian John Speed’s America with those Known Parts in that Unknowne World both People and Manner of Building from 1626 or 27. This representation of America, seen again his A new and accurat map of the world reproduced by Randy McNally in 1966, also includes a fairly accurate mapping of the United States’ East Coast.
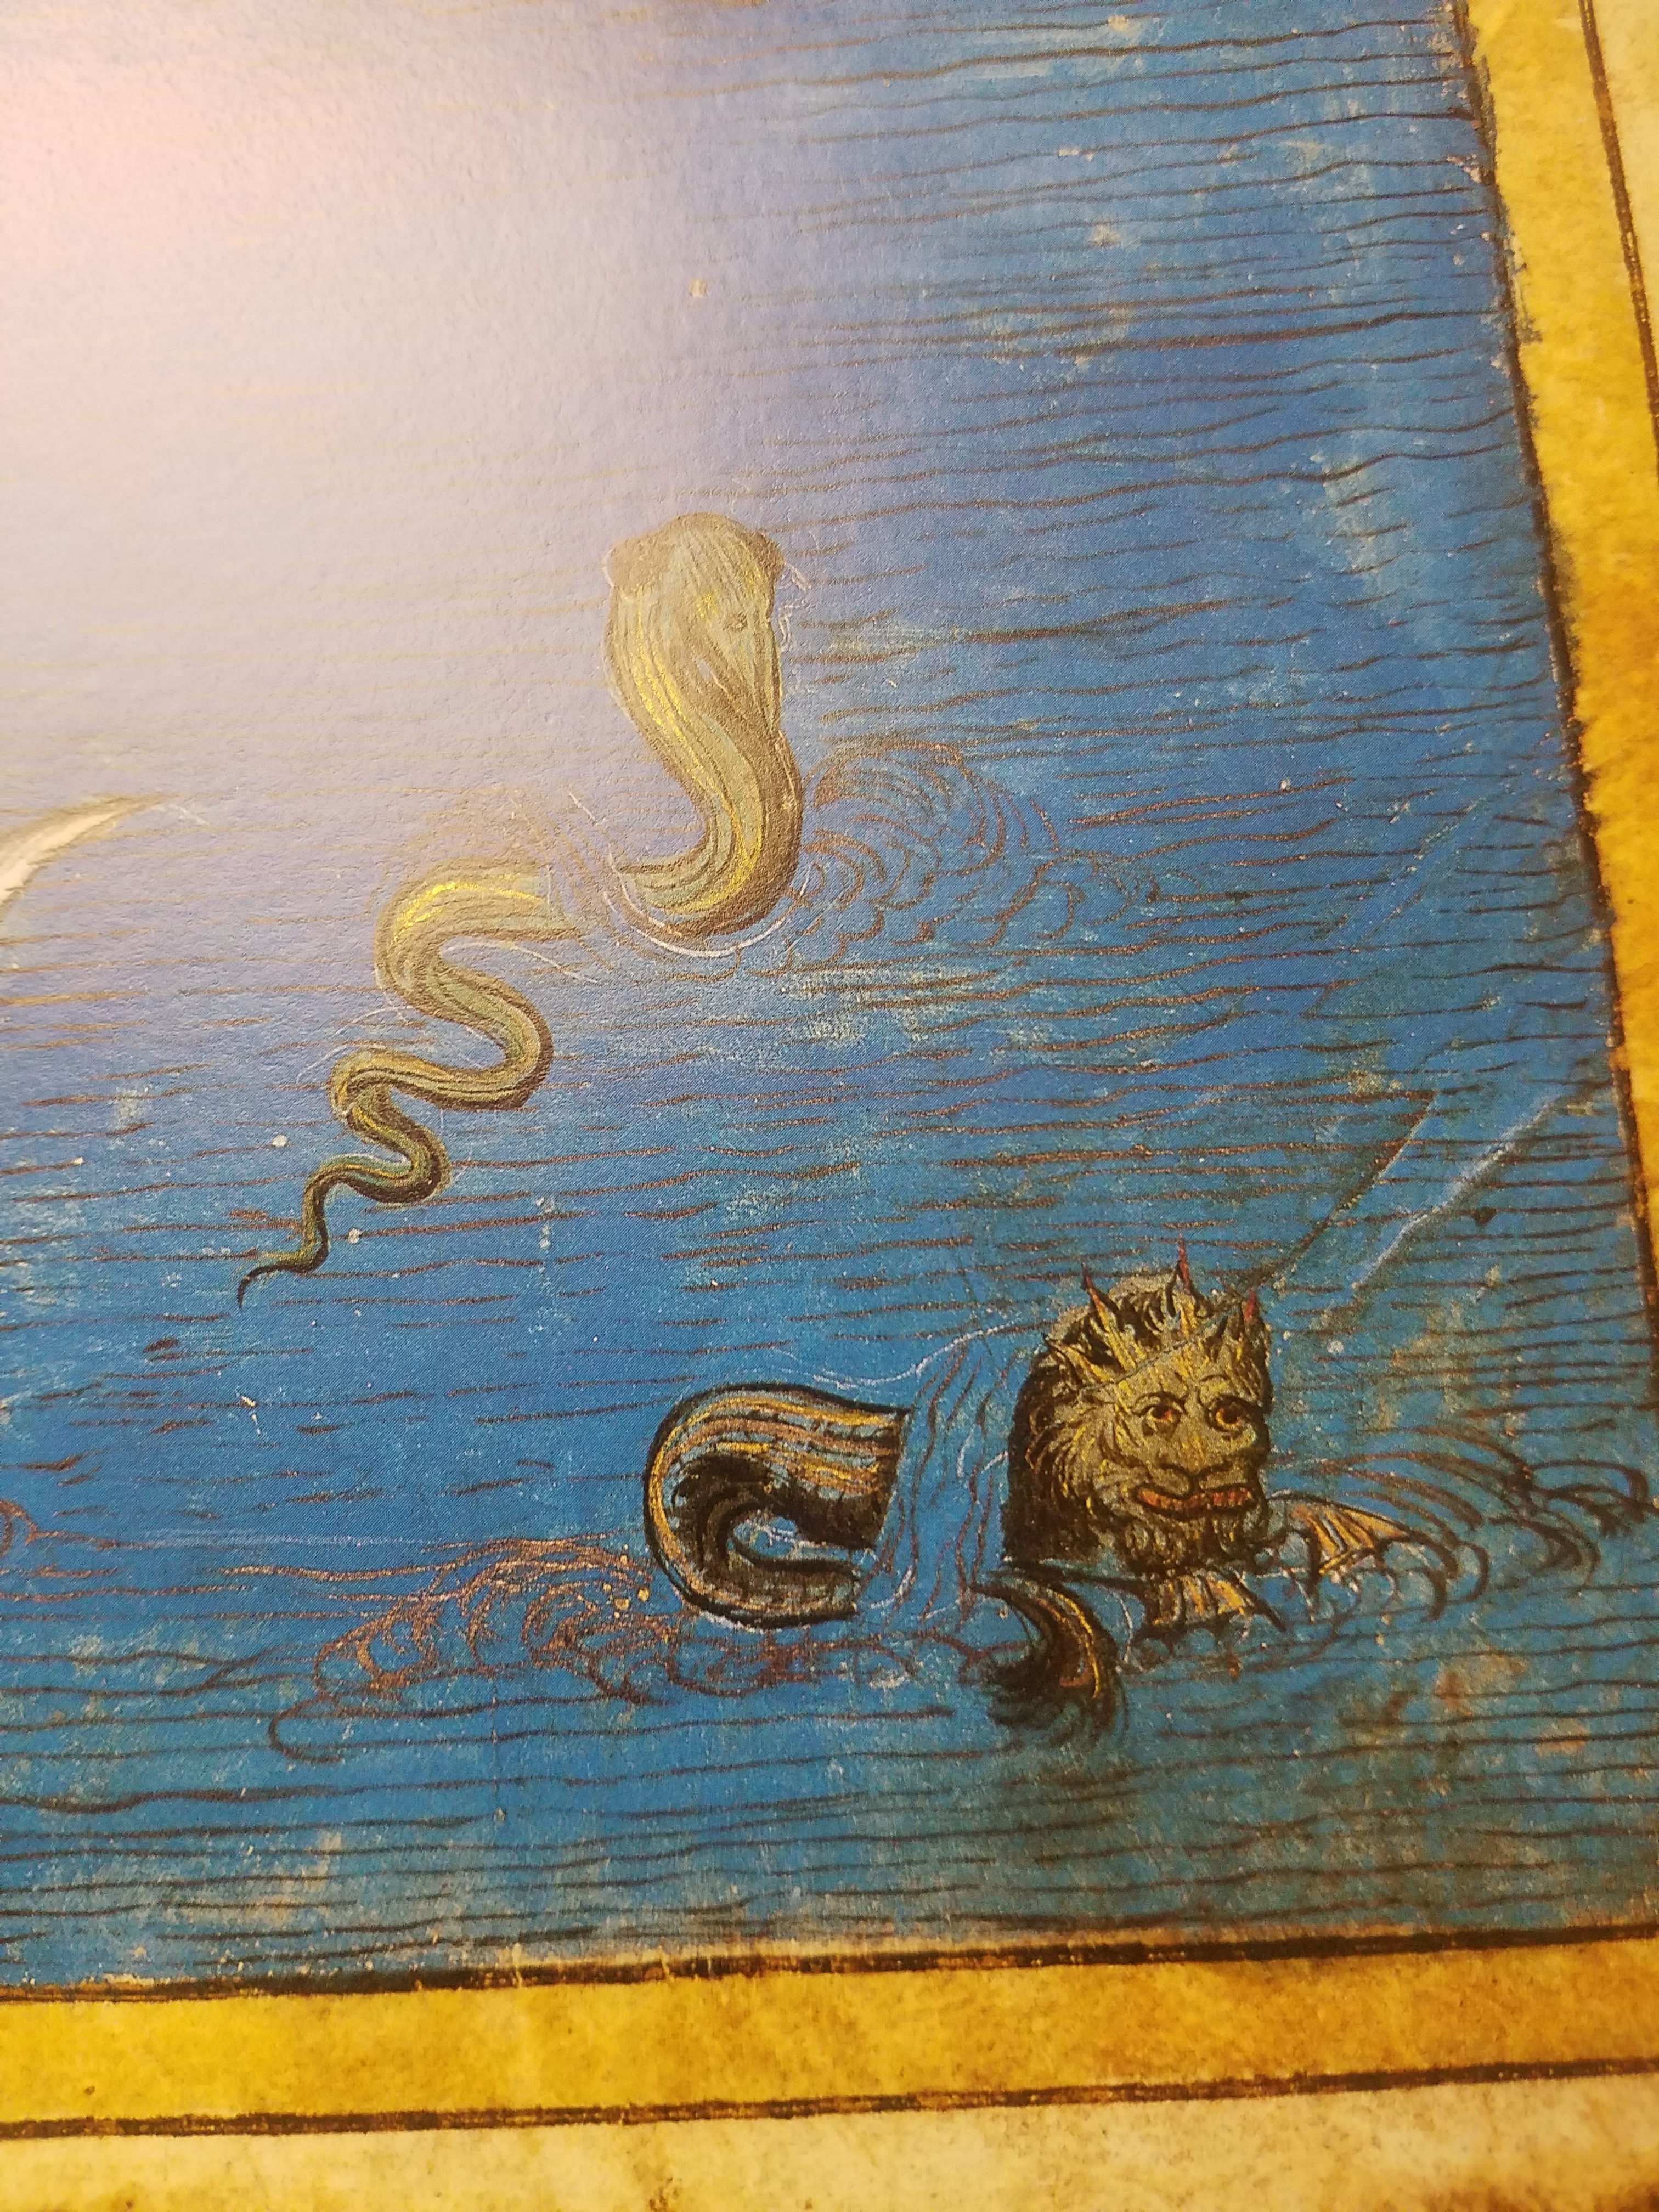
William Trevethen’s 1666 Americ descriptio nova depicts the Island of California once again. The Trevethen map also places Sir Francis Drake’s Nova Albion on the island; Nova Albion was actually a part of continental Mexico, and the English claim to Nova Albion was their foothold into claiming further continental territory, which is why the Spanish worked so hard to invalidate that claim. Nova Albion is now Point Reyes, which is just Northwest of the San Francisco area. The region North of the Island of California is marked “terra incognita” with a sea monster lurking in the waters to indicate the unknown and unexplored continent.
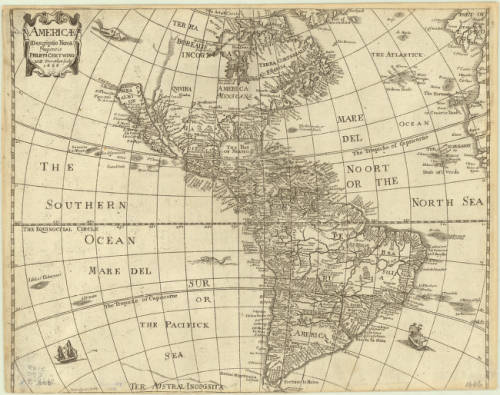
Click the link to see the Americ descriptio nova 1666, published in 1670 edition of Peter Heylyn’s Cosmography in our Digital Collections
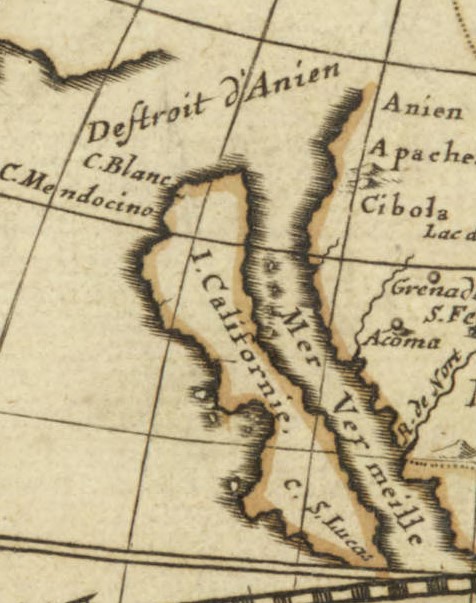
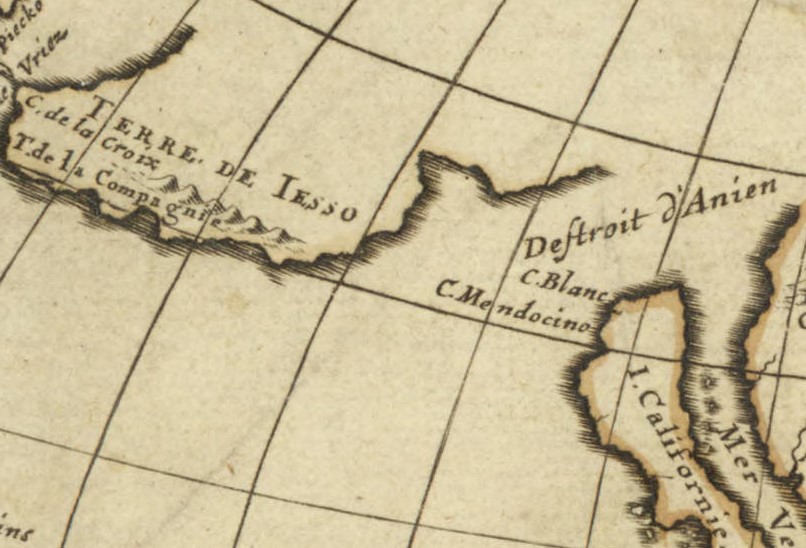
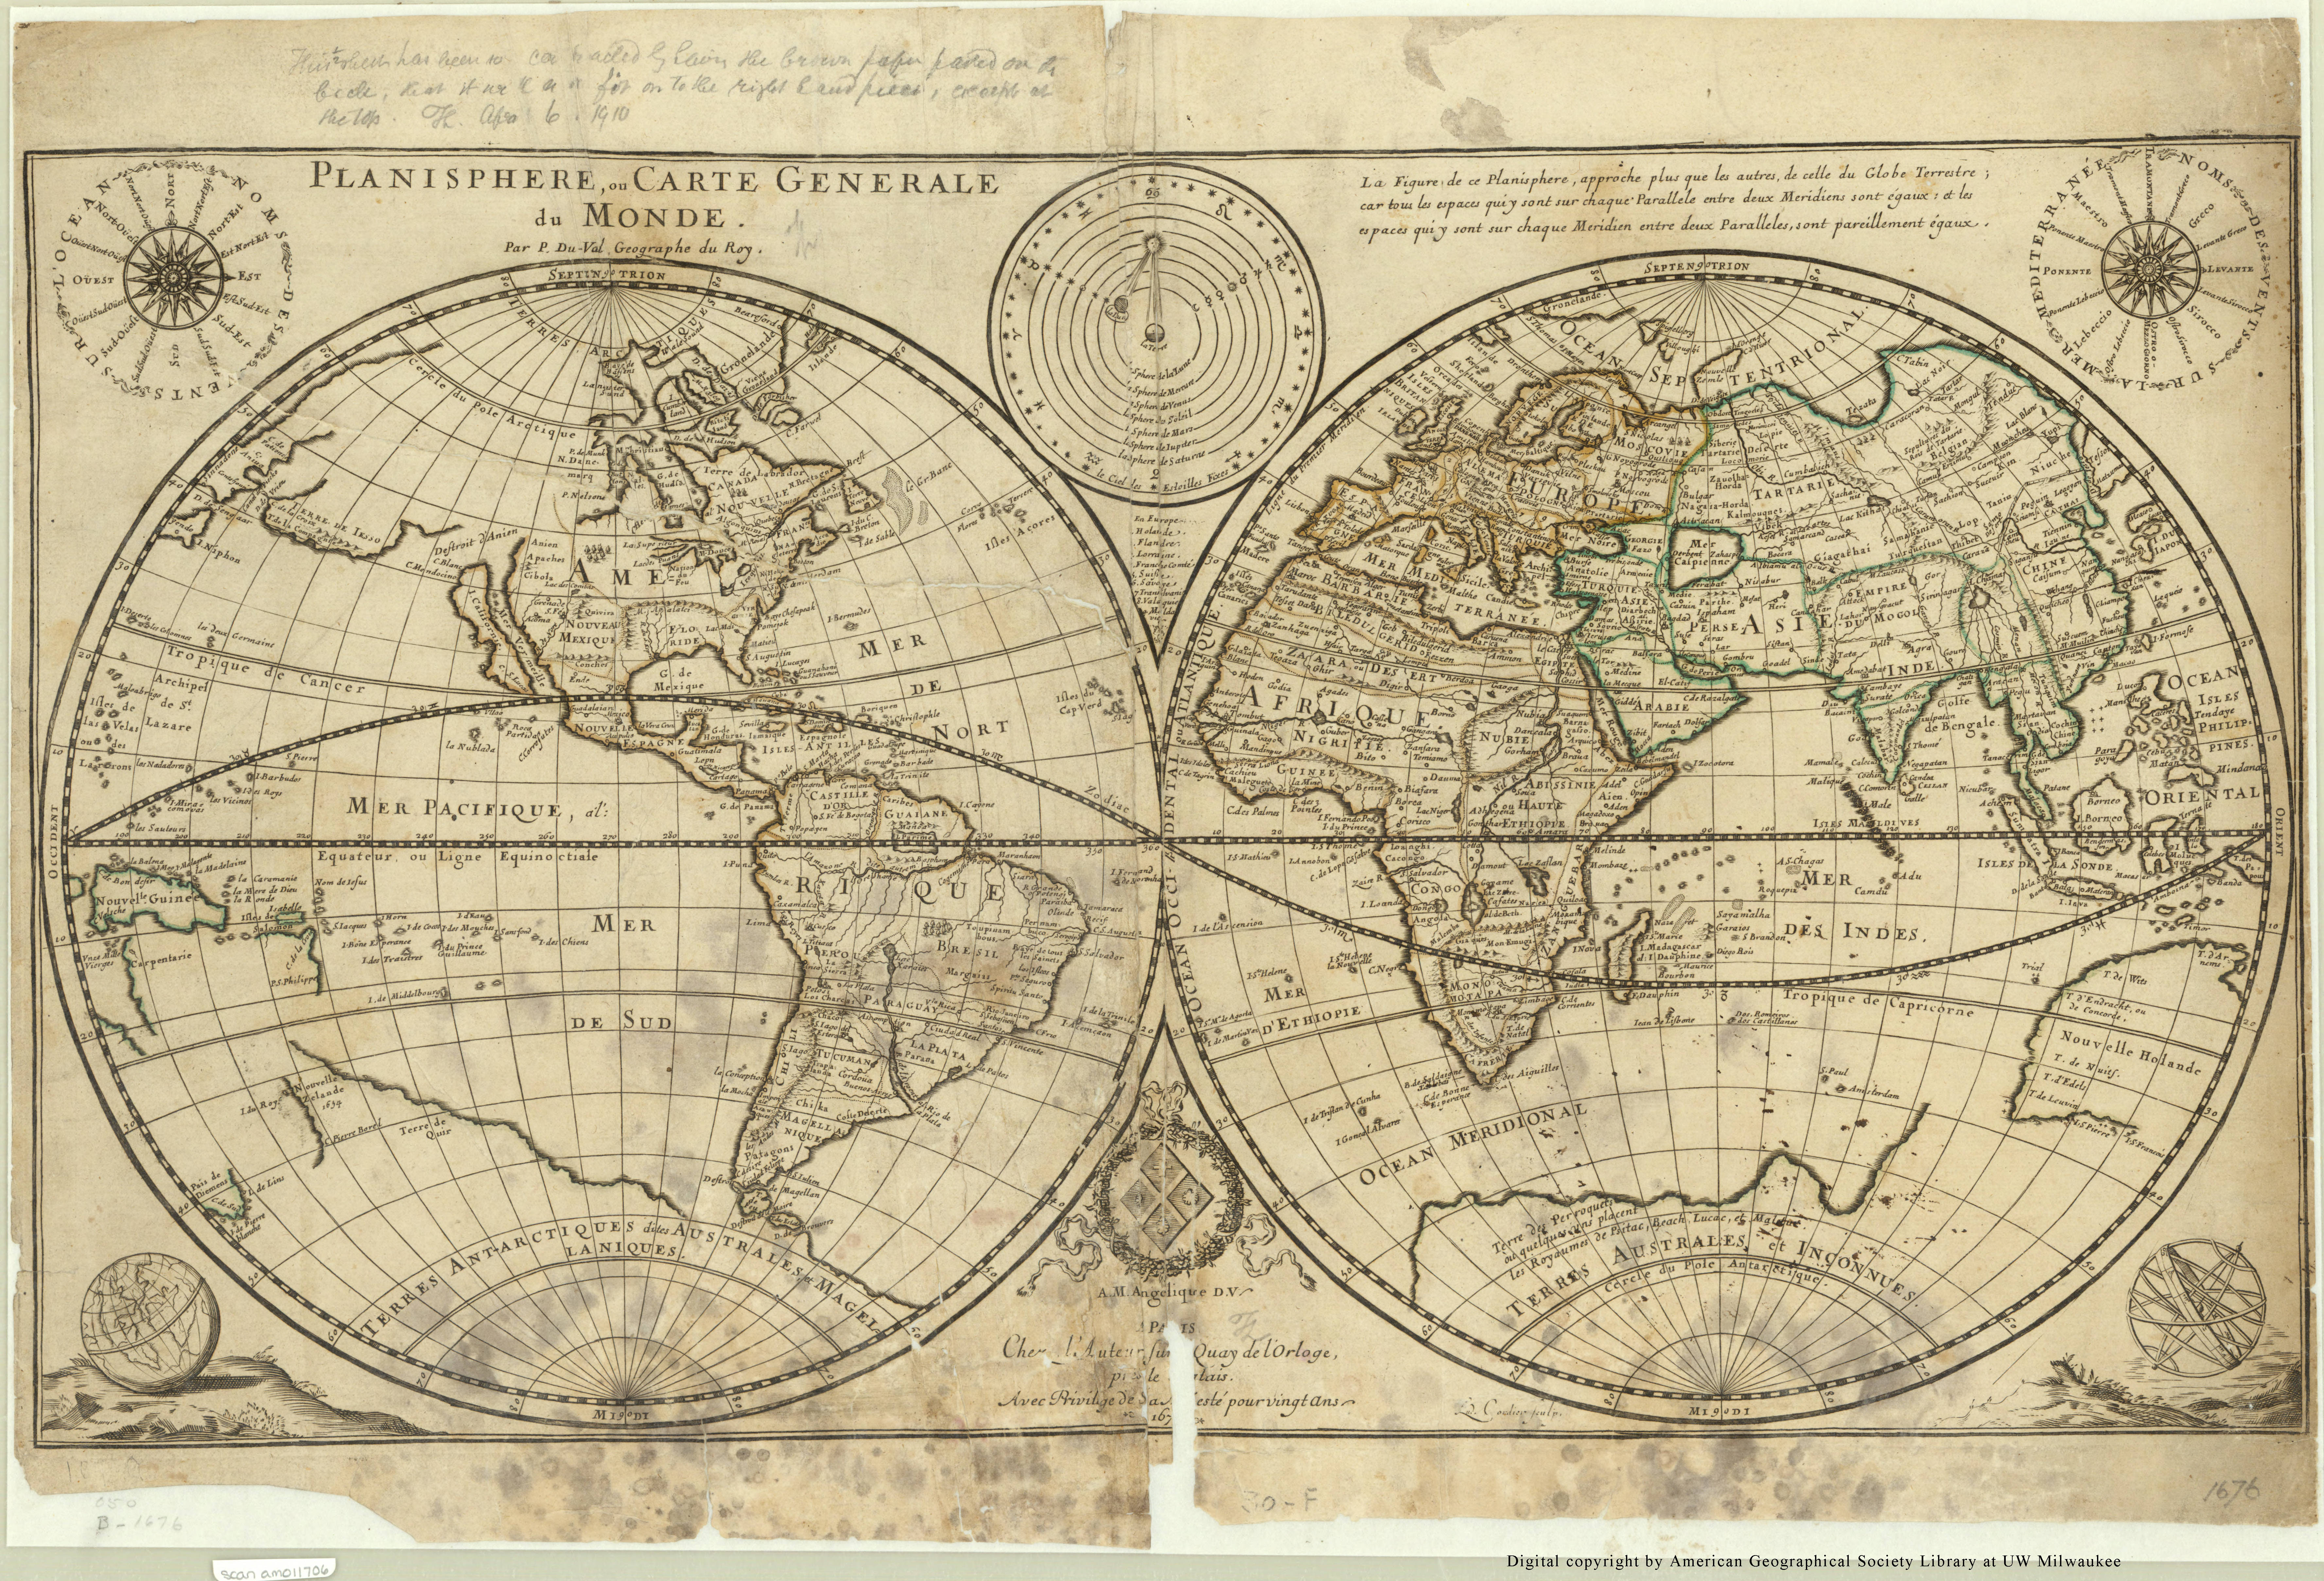
A 1677 world map in the AGSL collection by Pierre Duval includes the Island of California at the mouth of an approximately placed strait. This map also includes a vague coast line marked “terre de Iaso” just Northwest of California. The “terre de Iaso” was thought to be a region where Japan connected to North America.
L’America Settentrionale, another 1677 map by Guillaume Sanson, leaves the unexplored areas of North America blank to indicate the unknown, but clearly includes the island of California. Remarkably, the French maps do not include Nova Albion.
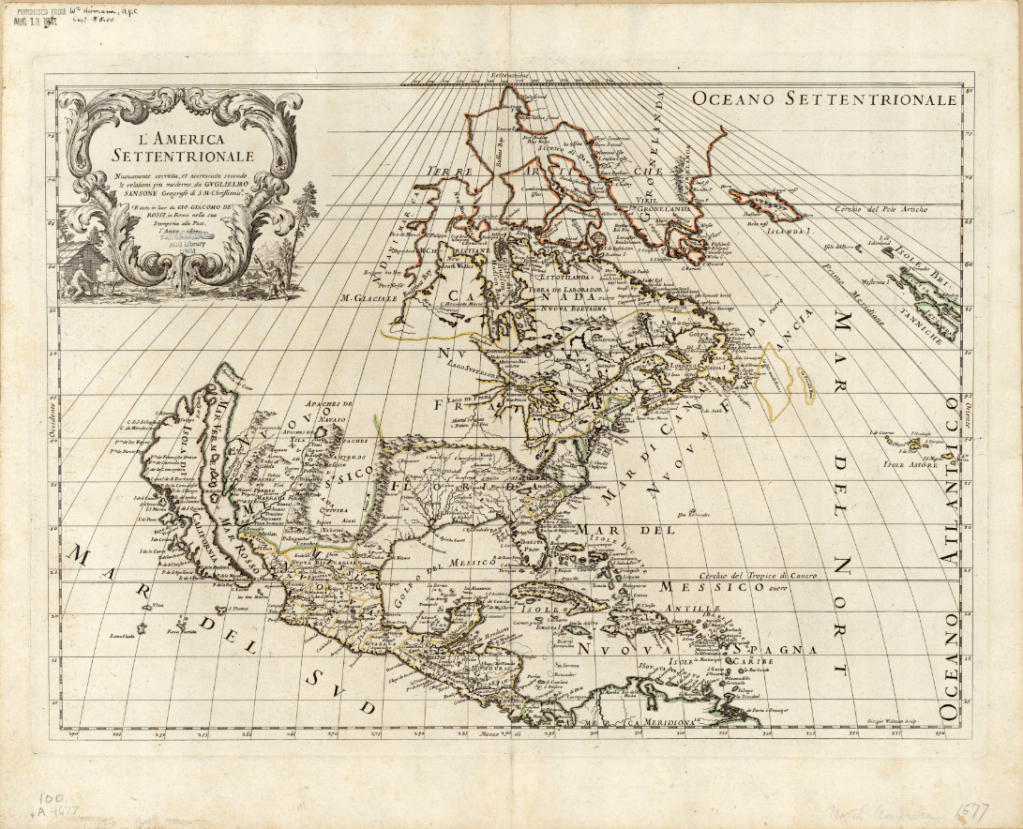
Click the link to see Guillaume Sanson’s 1677 Map of America in our Digital Collections
At the end of the 16th century, Dutch cartographers Gerard and Leonard Valck produced another map depicting California as an island. The Valck map, like the 1677 Duval map, includes a reference to an area connecting North America and Asia. On the Valck map, it is referred to as the “Terra Esonis.” The Valcks only include the vague coastline of the fabled connection, leaving a blank space– perhaps to leave room for future discoveries. The map includes detailed records of place names and waterways, as well as an illustrated cartouche depicting a pair of “Americans” surrounded by bountiful crops and exotic animals.
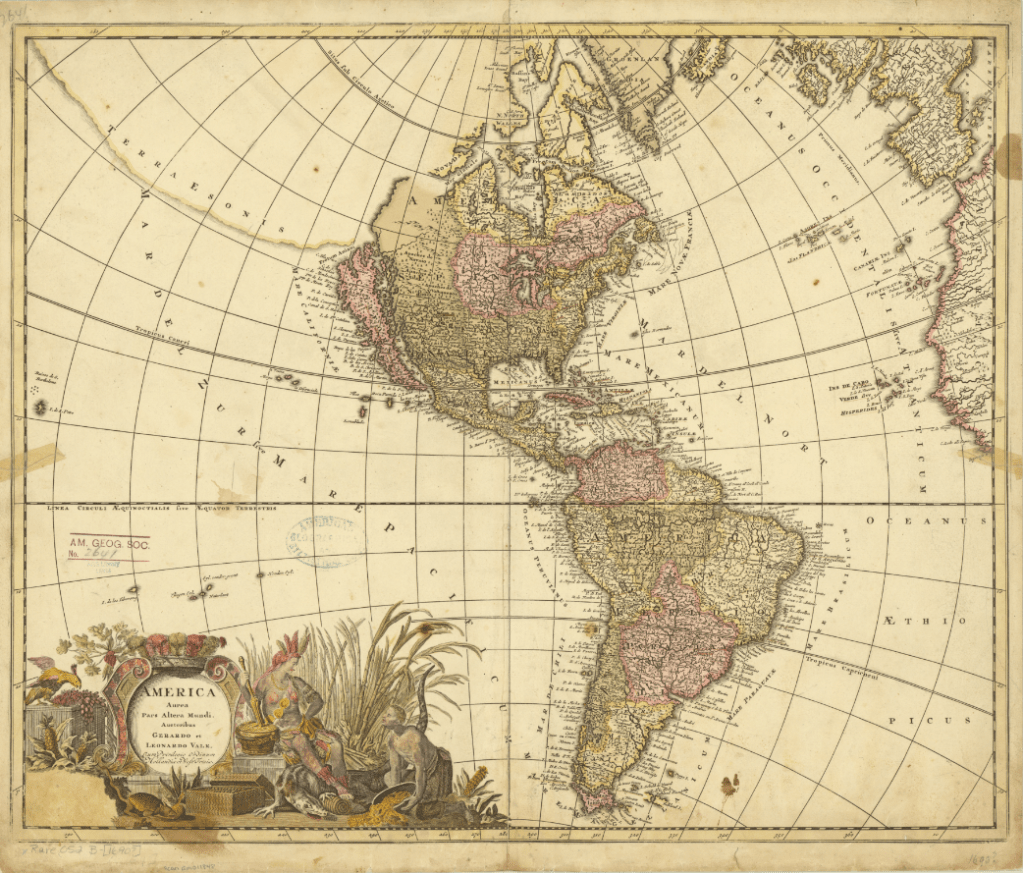
Click the link to see the Valcks’ 1690 Map of America in our Digital Collections
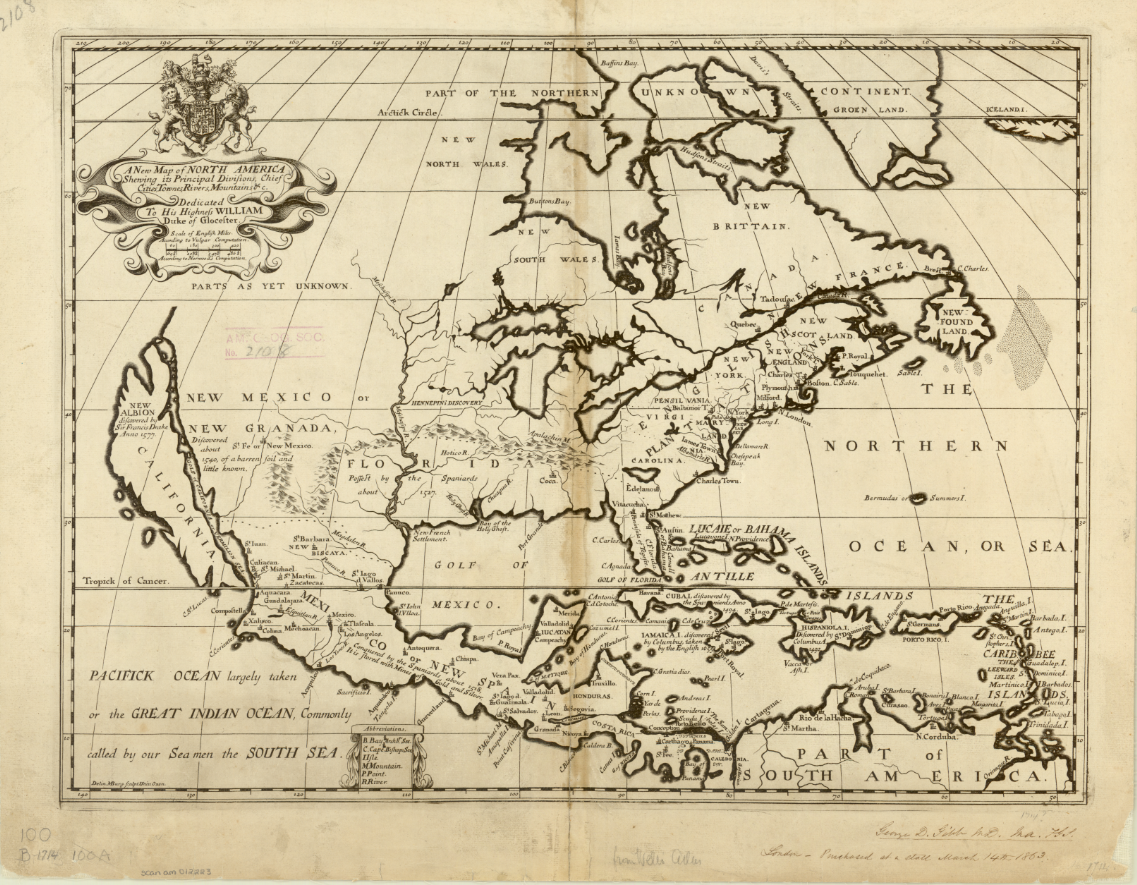
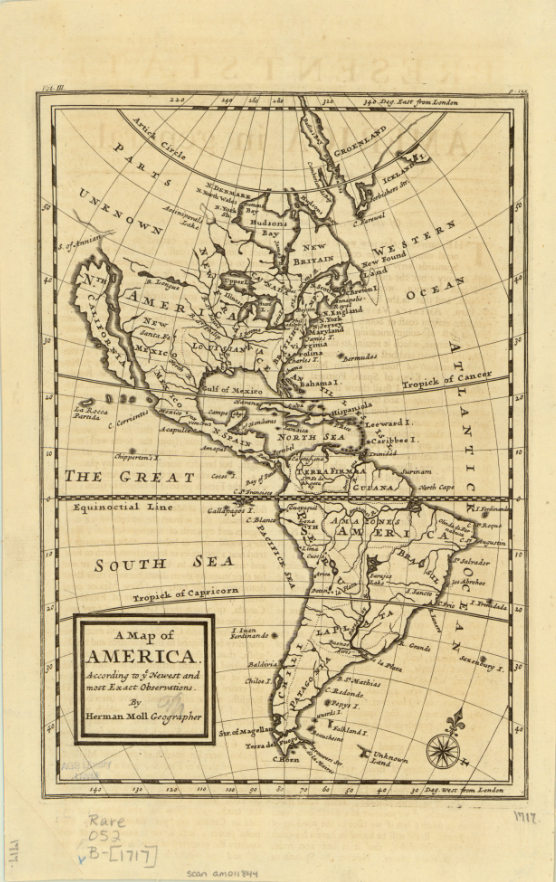
This map was produced just eight years before Eusebio Francisco Kino’s series of overland expeditions, which would finally confirm that the Baja California Peninsula was indeed a peninsula. Kino, a Jesuit missionary and cartographer, believed that California was an island until he began to explore deeper into the continent. He initially intended to establish a route between Jesuit missions in Sonoran and Baja California on his expeditions from 1698-1706, but also reported and confirmed the land connection and reestablished the existence of the Baja California Peninsula. The Jesuit order generally accepted his claims, but Europeans were slow to incorporate the peninsula into their own maps because of conflicting reports from Juan Mateo Manje, who joined Kino on several expeditions. Maps created into the 18th century by Europeans still recorded the Island of California’s existence; these two English maps were created just a few years after Kino’s final confirmation of the peninsula’s land connection. The first map, Michael Burgher’s 1714 A New Map of North America, depicts the topography of the area, as well as records of new discoveries, settlements, and claimed and unclaimed territory. The 1717 Map of America by Herman Moll has a similar focus, but includes South America.
The latest map in the AGSL collection depicting California as an island is Matthaeus Seutter’s 1740 map. The hand-colored map is filled with notes and ship routes, as well as two detailed cartouches depicting local peoples and their conversion to Christianity. Seutter’s map also references an Ocean of California surrounding the island and several sketches of aquatic plants.
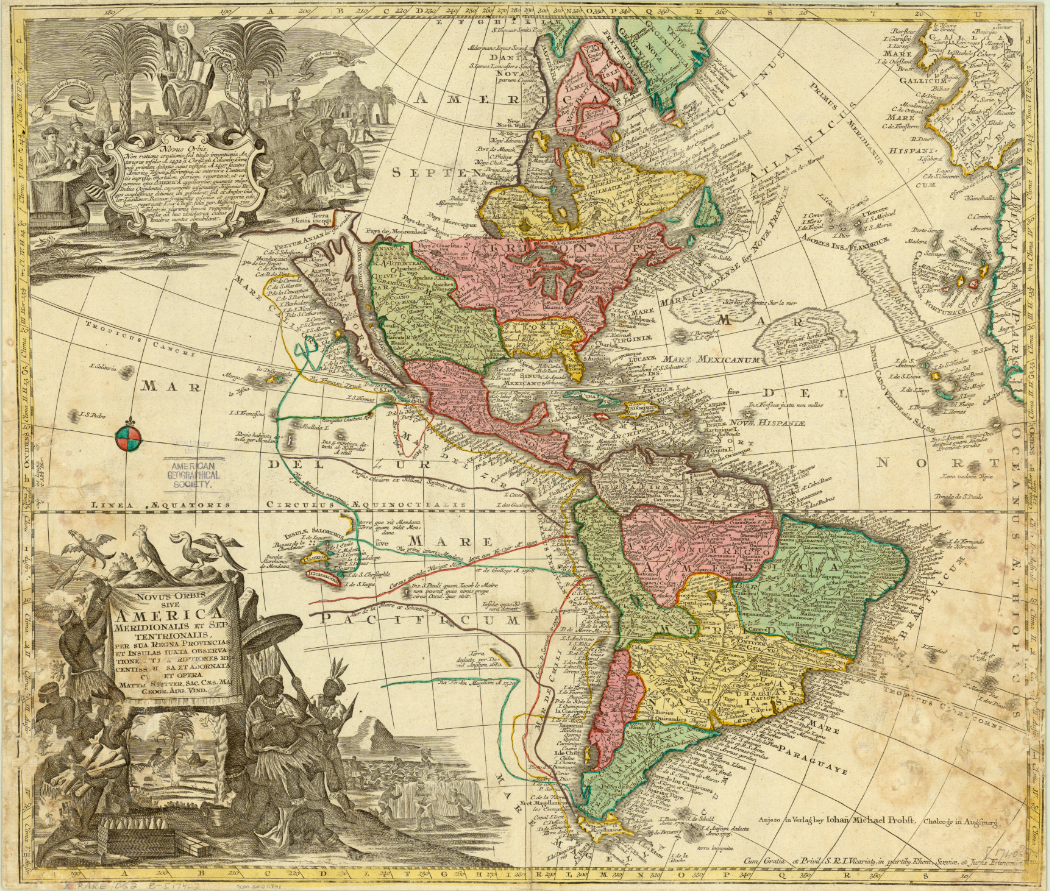
Click the link to see the 1740 Seutter Map in our Digital Collections
Montalvo’s lost romance tells stories of a bountiful and fertile island ruled by women adorned in gold and jewels, and the Queen Calafia who fell in love with a Spanish man and forfeited her power, treasures, and land to their king for the chance to marry him. In Las sergas de Esplandián, the island of California is full of potential coveted by conquering Europeans. In many ways, this fiction became reality– California became an island, first by misconception, and then deception as the Spanish maneuvered to maintain their claim on the land and prevent English settlement. And in our collections, we have 200 years of maps recording one of cartography’s longest-lived errors.
