Nautical charts
Humboldt Bay, California 1850s
by Angie Cope
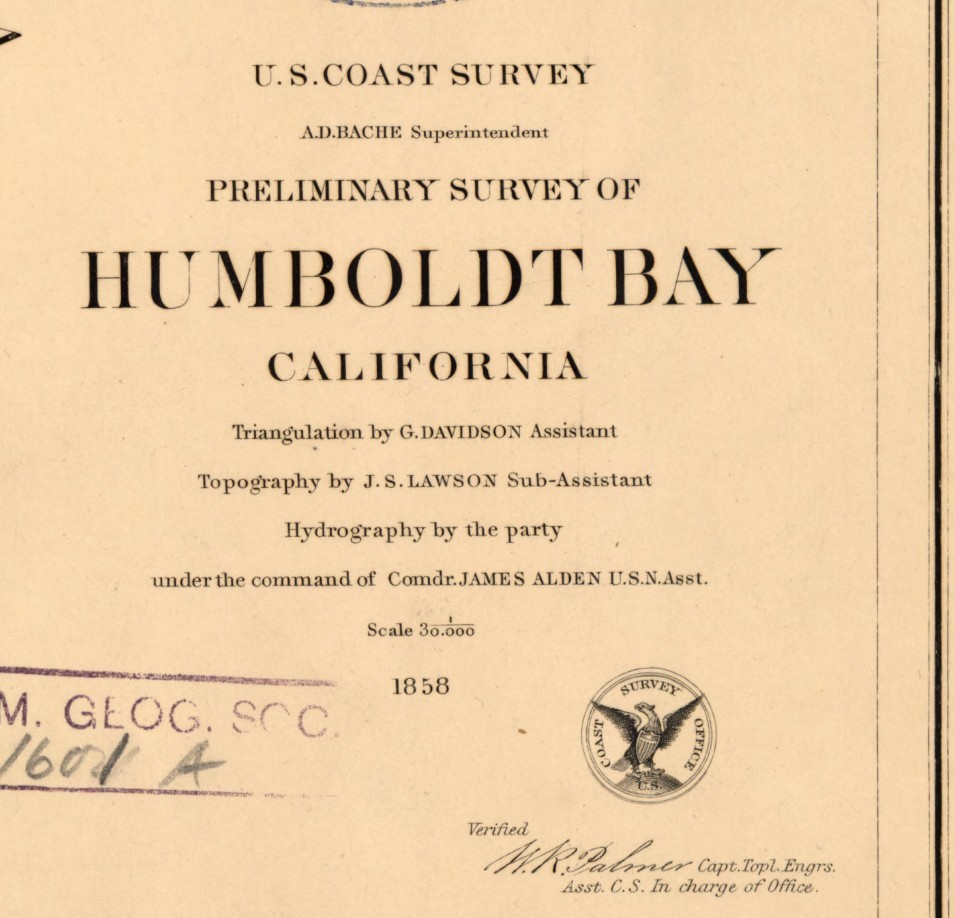
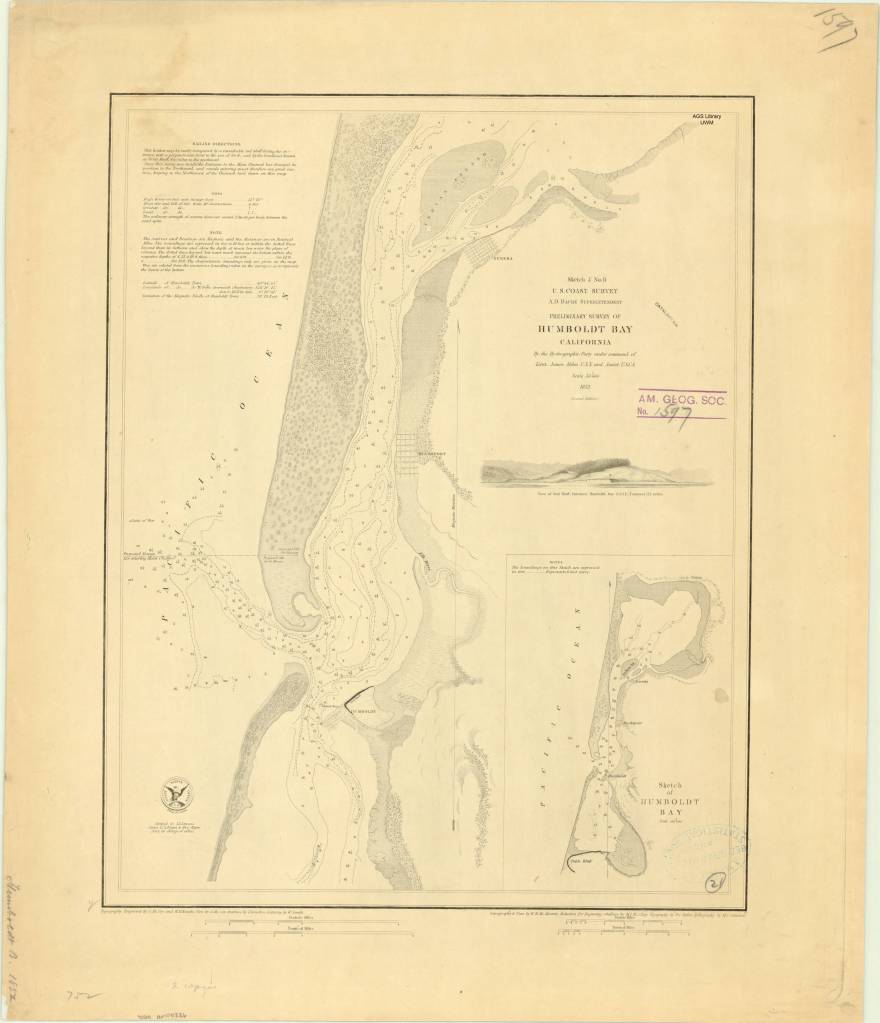
Preliminary survey of Humboldt Bay, California / U.S. Coast Survey, 1858.
Rare Map: Chart CS Pacific Humboldt Bay 1858
https://collections.lib.uwm.edu/…/collec…/agdm/id/6097/rec/1

Humboldt Bay is a natural bay located on the rugged North Coast of California between San Francisco Bay and Puget Sound. The Bay is home to more than 100 plant species, 300 invertebrate species, marine and land mammals, hundreds of fish species, and more than 200 species of birds.
The Wiyot people were the first to inhabit the Humboldt Bay region, estimated to have arrived around 900 A.D. Their name for the bay is Wike or Wiki. Indian villages shown on this 1858 map are circled in pink.
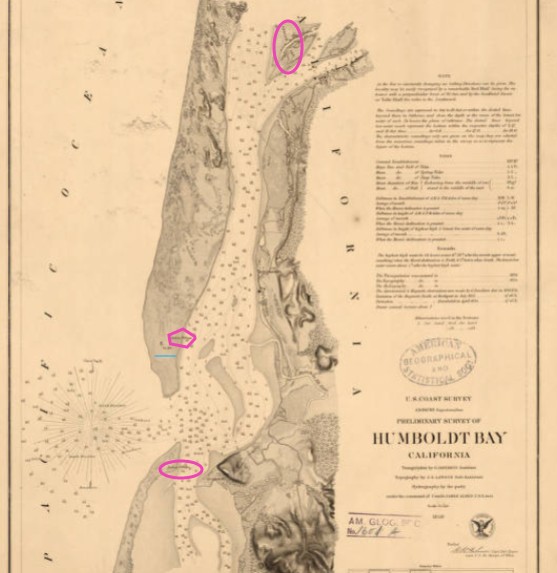
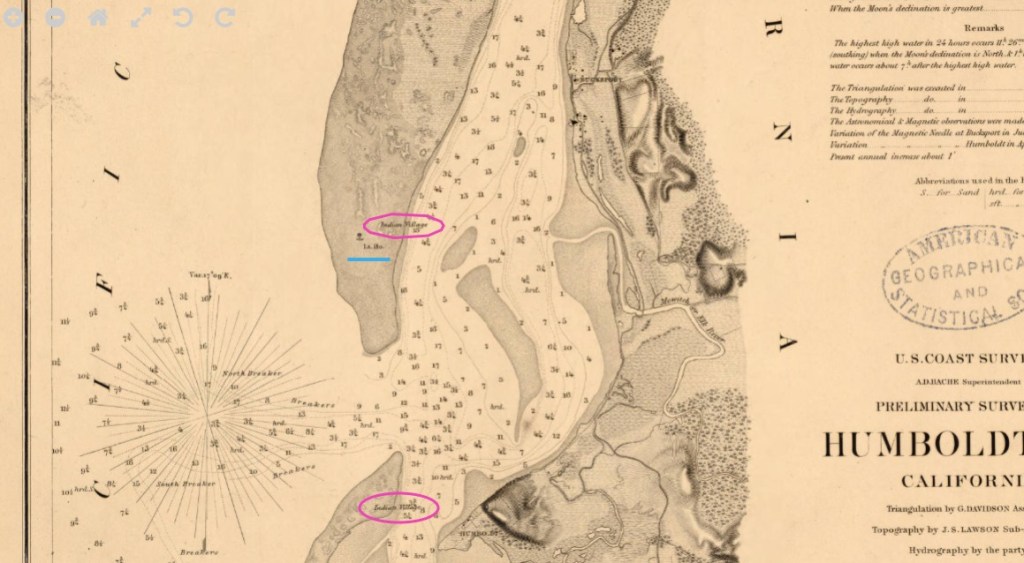
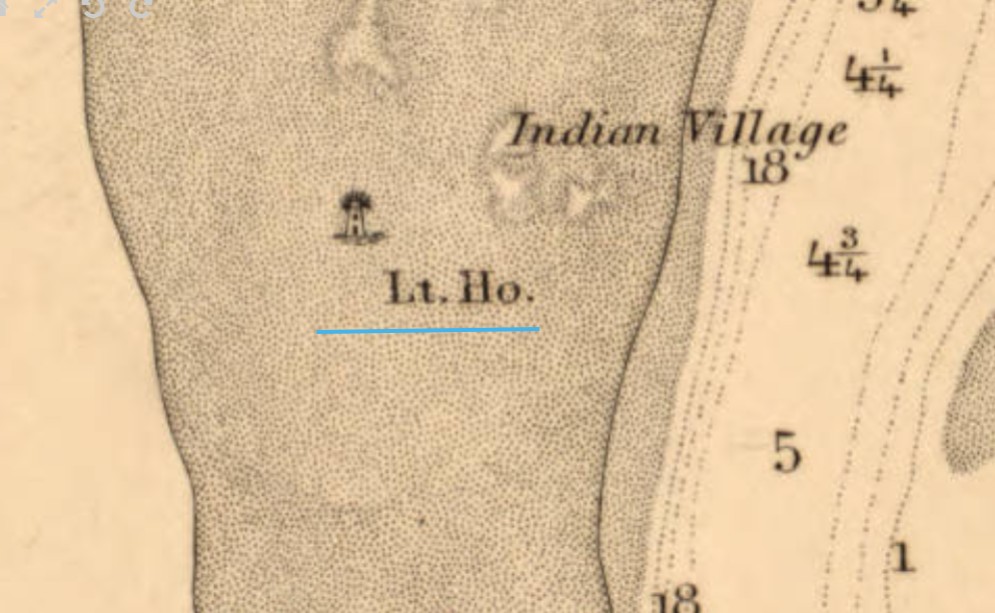
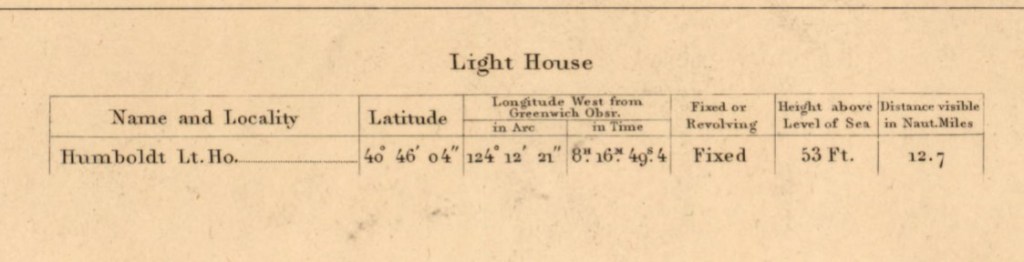
Beginning in the 1850s, settlers used the bay for shipbuilding and the export of lumber. In 1856 the Humboldt Harbor Light was built on the north spit (underlined in blue).
Interesting factoid: There is a memorial to the USS Milwaukee in Eureka, California on Humboldt Bay. In 1917, the USS Milwaukee ran aground while trying to tow a beached submarine. Remnants of the wreck are still visible today at low tide.
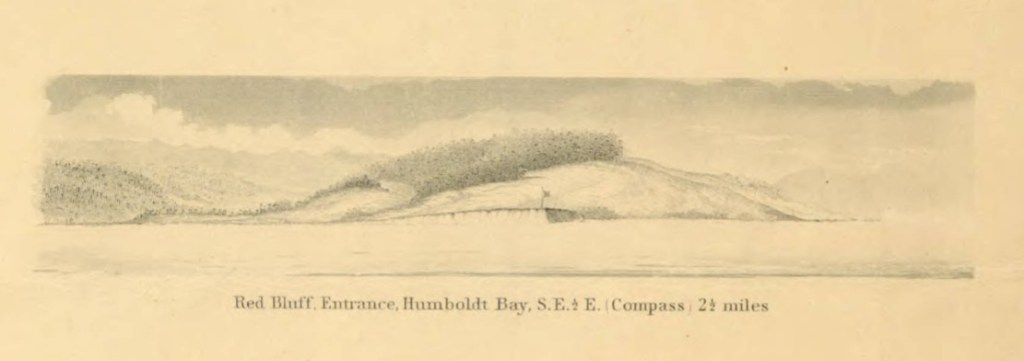
Illustrated view: Red Bluff entrance, Humboldt Bay, S.E. 1/2 E. (compass) 2 1/2 miles
From: Reconnaissance of the western coast of the United States : middle sheet : from San Francisco to Umpquah [sic.] River, 1854
https://collections.lib.uwm.edu/digital/collection/agdm/id/6717/rec/17
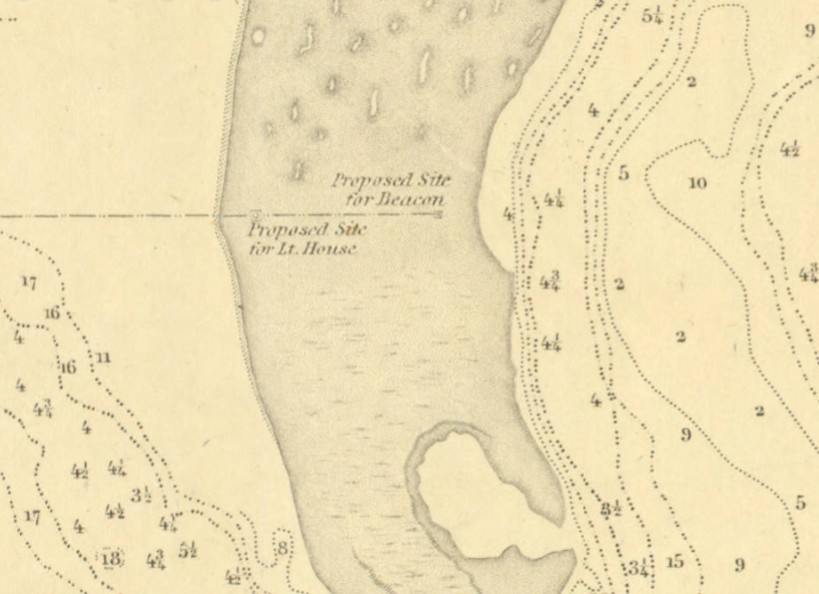
Preliminary survey of Humboldt Bay, California / U.S. Coast Survey, 1852
https://collections.lib.uwm.edu/digital/collection/agdm/id/4778/rec/1,
Shows the proposed site for the light house built in 1856.
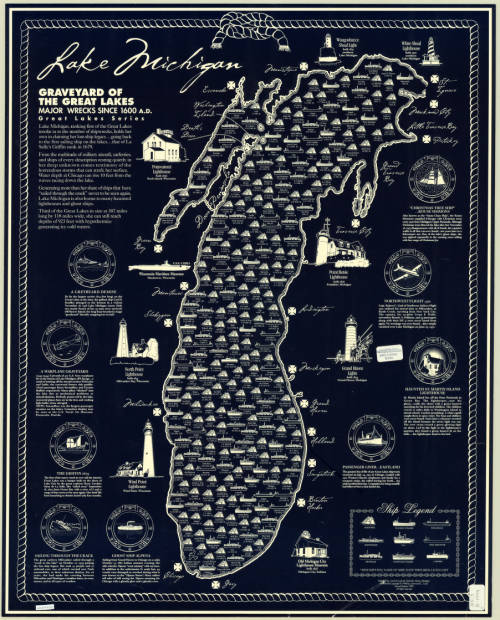
Get Wrecked: Shipwrecks on the Great Lakes
By Lauren Maddox
As the weather warms up here in Milwaukee (slowly but surely) we start fantasizing about our coming summer on Lake Michigan; soon we’ll be able to walk along the beach without our coats on, go out on the water, maybe even swim if the water isn’t too cold. It’s time for swimsuits and sunscreen again! But underneath the surface and the veneer of summer fun, Lake Michigan is hiding something.
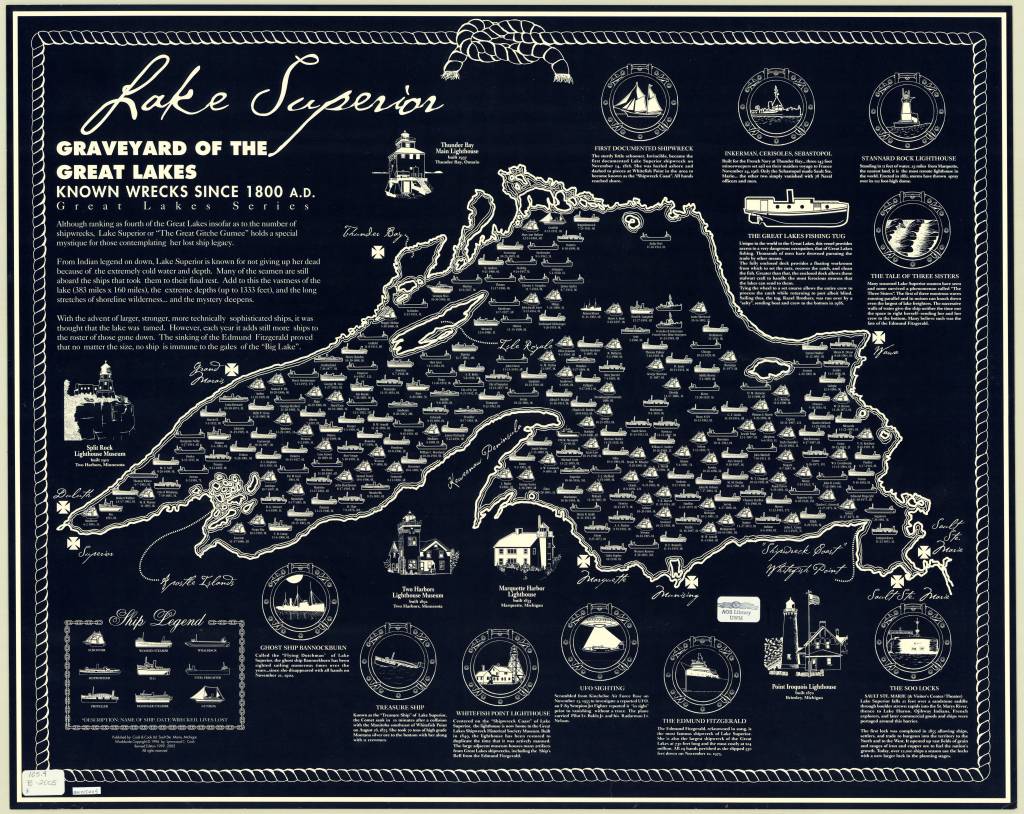
2005 Map of Lake Superior’s Known Wrecks Since 1800. Click the link to see this map in our Digital Collections!
The Great Lakes Shipwreck Museum is north of Paradise, Michigan at the Whitefish Point Light. The Whitefish Point Light, first lit in 1849, is the oldest operational lighthouse on Lake Superior. Lake Superior, the most infamous of all the Great Lakes for its rocky, hard to navigate shoreline, is the final resting place for more than 550 shipwrecks– 200 of which happened in Whitefish Bay. The museum, which was founded in 1978, memorialized the tragic loss of the SS Edmund Fitzgerald, which was capsized by gale force winds in November, 1975. Since it was founded, the Museum has been a place where visitors can learn about the maritime history of the Lakes and the many shipwrecks that have occurred there.
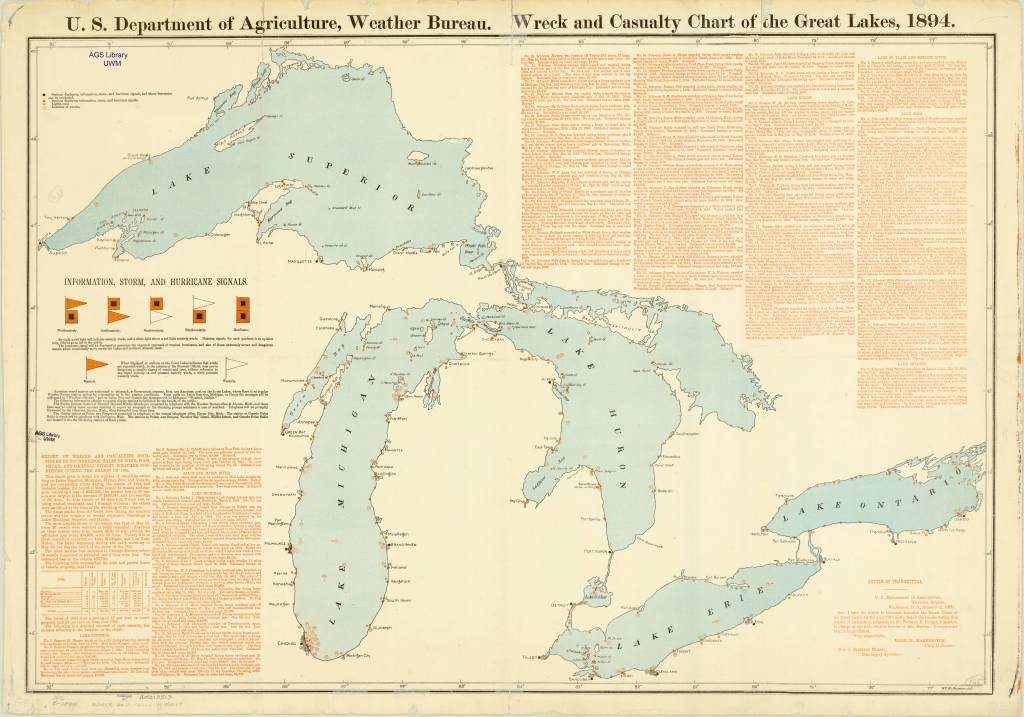
Wreck and Casualty Chart of the Great Lakes, 1894. Click the link to see this map in our Digital Collections!
Thanks to the organizations like the Great Lakes Shipwreck Museum and the Great Lakes Shipwreck Historical Society, shipwrecks in Lake Superior are still being recovered. These shipwrecks were tragic events, but the debris left behind is part of our water-faring history that many organizations hope to safe keep for future generations.
The James McBride, sunk in 1857. The first ship to carry cargo from the Atlantic to port on Lake Michigan. Click the link to learn more! 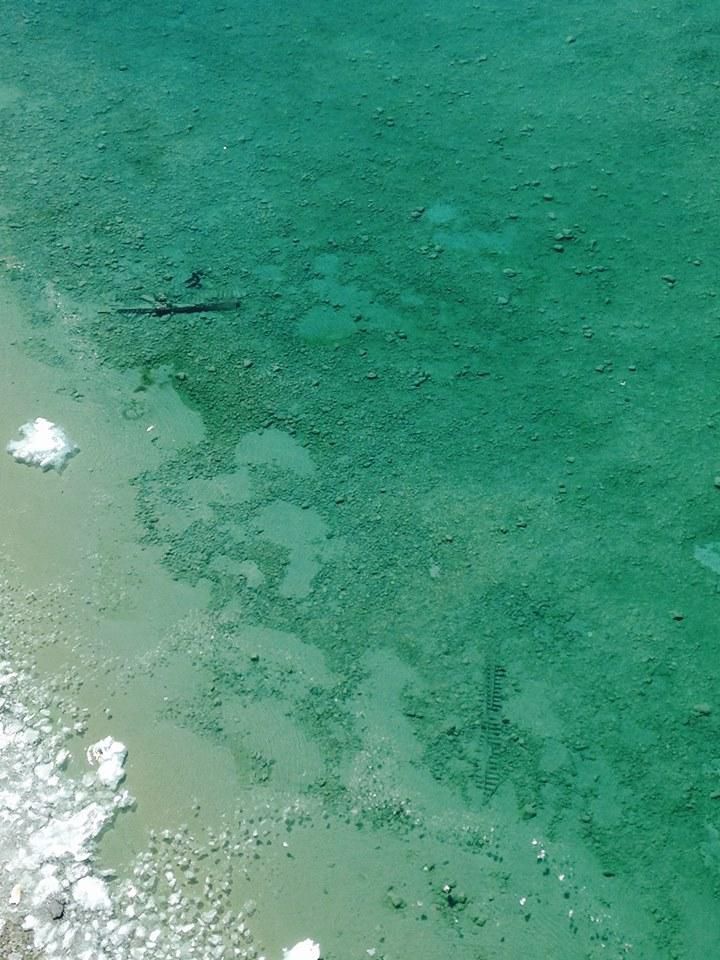
Unidentified Shipwrecks on Lake Michigan. Click the link to learn more! 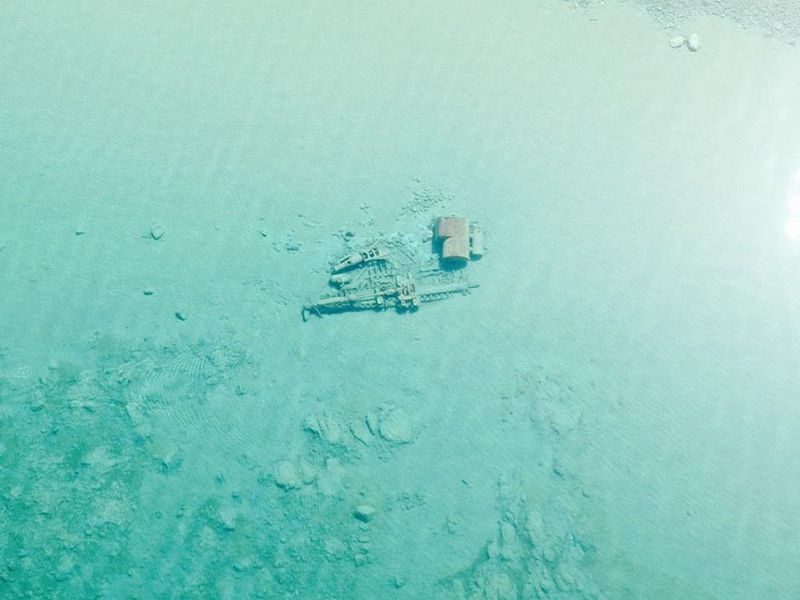
The Rising Sun, sunk in 1917. All passengers and crew rescued. Click the link to see this photo on the Smithsonian Magazine website!
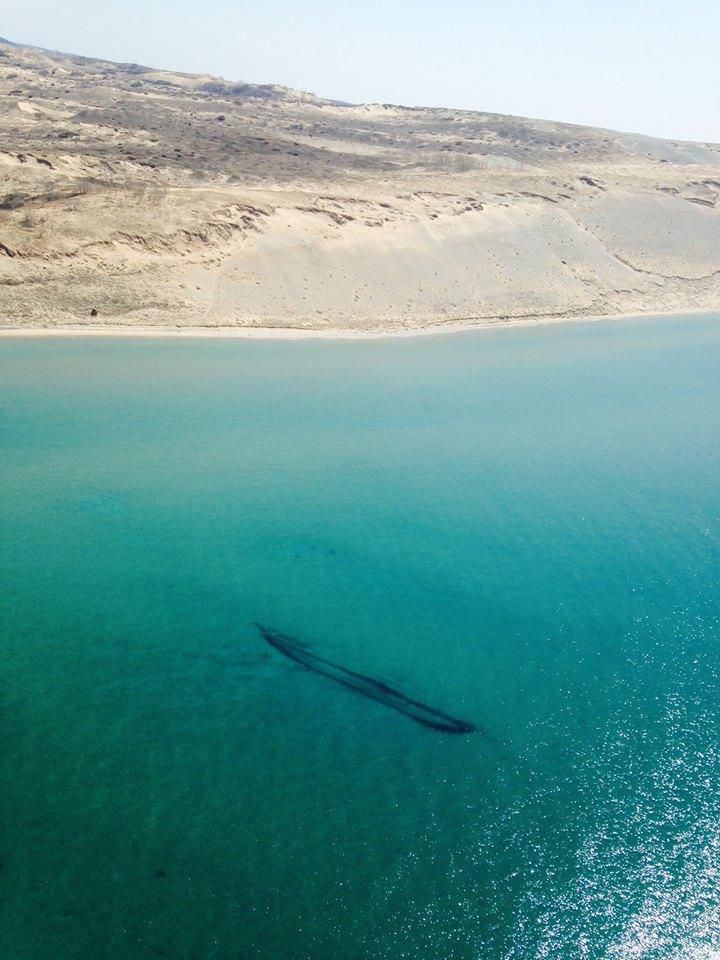
The Great Lakes, due to their cold, fresh waters, preserve shipwrecks remarkably well; if left undisturbed, ships can survive for centuries at the bottom of the Lakes. On a particularly clear day in 2015, the US Coast Guard Air Station in Traverse City was able to photograph shipwrecks in Lake Michigan from the air. Generally, water conditions in the Great Lakes are not clear because algae, fed by agricultural run-off, clouds the water and obscures the shipwrecks below.
Unfortunately, despite the Lakes’ ability to preserve old ships in its waters, invasive species like the zebra mussels, will infest otherwise stable wrecks, rendering them unrecognizable and unfit for study.
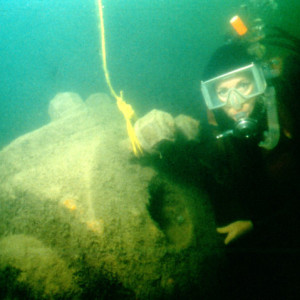
The Conemaugh before it was infested by zebra mussels. Click the link to see this image on the GLSM Research Page! 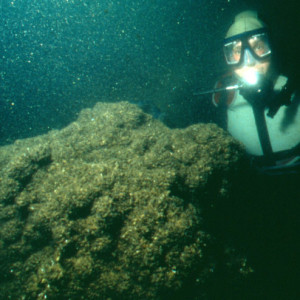
The Conemaugh after it was infested by zebra mussels. Click the link to see this image on the GLSM Research Page!
The AGSL has shipwreck charts that span decades, recording the many wrecks that have happened on the Great Lakes. Ships have been carrying goods across the Great Lakes since at least 1679, when the French vessel Griffon carried supplies to settlements along the north shore of Lake Eerie. And as long as ships have been traversing the Lakes, ships have been sinking there. The Griffon, after unloading the much-needed supplies it was carrying, was loaded up with furs and other commercial goods, only to be caught in a storm on its return trip and never seen again.
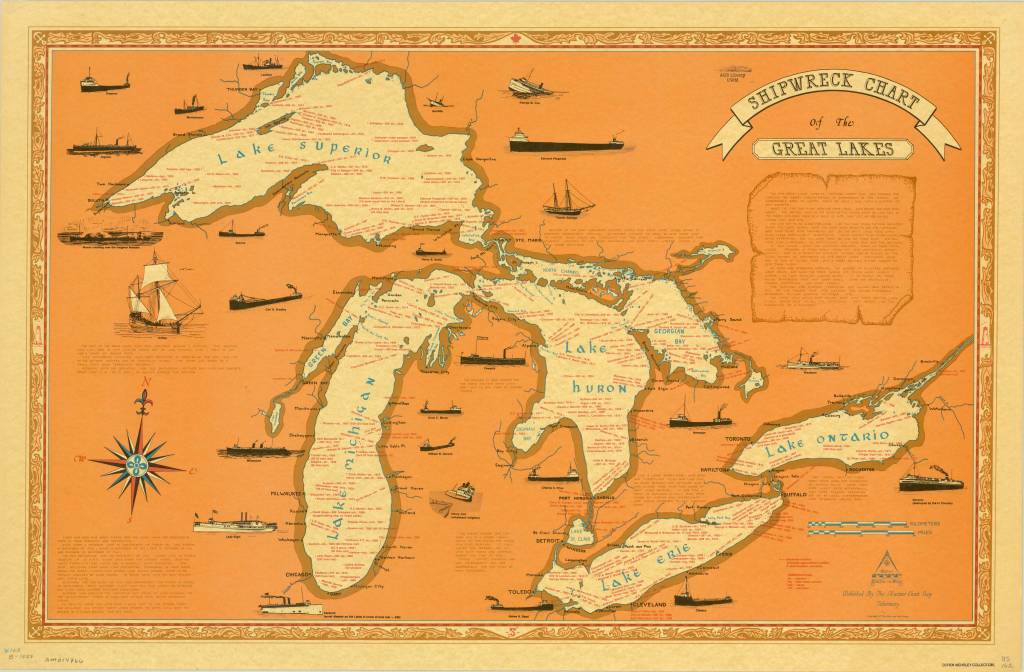
1977 Shipwreck Chart of the Great Lakes. Click the link to see this map in our Digital Collections!
Technology improved exponentially, and by the 1800s, the Great Lakes were a vital route for the shipping of goods in the Midwest; Chicago’s steel industry kick-started maritime shipping across Lake Michigan. But, of course, more ships on the water meant more potential accidents. Many of the shipwrecks you can see on these maps are from this era, before we had highways that connected our country for the easy movement of goods. Even modern ships, like the Edmund Fitzgerald, fall prey to the unpredictable conditions of the Lakes.
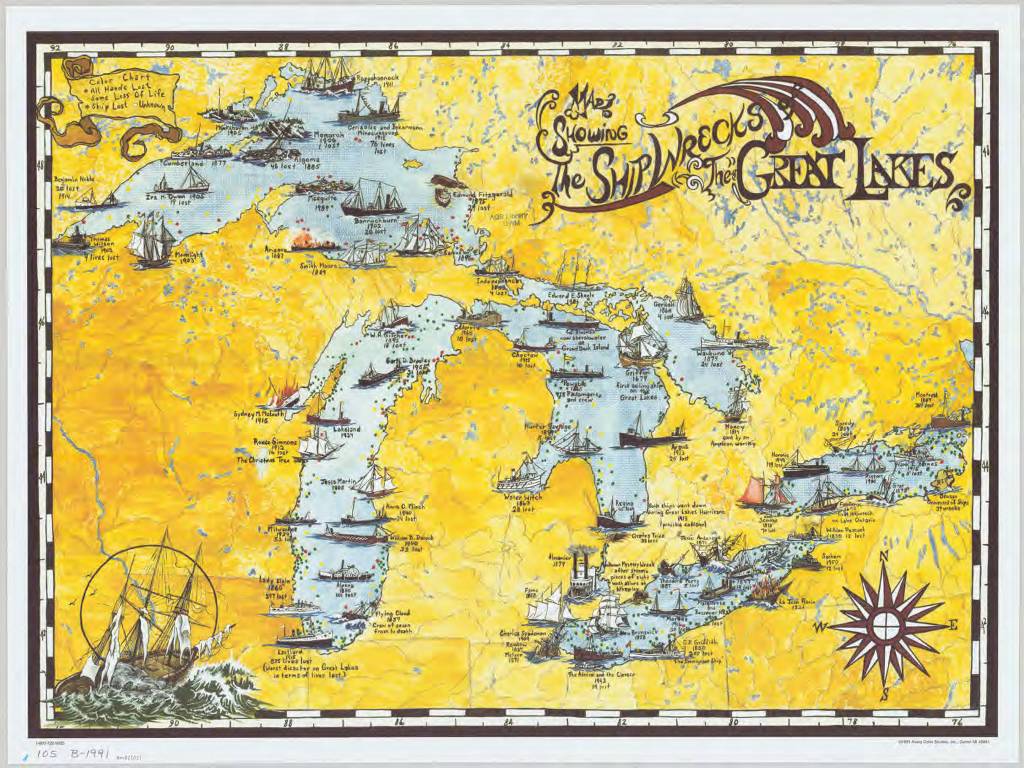
1991 Map Showing the Shipwrecks of the Great Lakes. Click the link to see this map in our Digital Collections!
So, this year, as we’re all getting ready to enjoy our summer by the lake, remember that there is often something else waiting to be discovered just beneath the surface.
The New Northwest Passage: Tourism through the Arctic
By Lauren Maddox
At the beginning of the summer, I did a series of posts discussing some of the AGSL’s connections to Arctic exploration and the famous explorers of that age (or, more accurately, the scandalous love lives of those explorers). But the Northwest Passage is still a part of the public’s romantic imagination– it’s a largely untraversable and unexplored wild full of cold beauty. And the fact that a Northwest Passage has been a geographical mystery for so many generations of Western explorers doesn’t hurt. As shrinking sea ice opens new routes through the storied Northwest Passage, more and more ships are passing through. Shipping freights are taking advantage of the new possible alternative to the Panama Canal for pan-oceanic travel– but in 2016, the first cruise ship passed through the Northwest Passage on a 28-day cruise through the Arctic.
The Northwest Passage has been the subject of years of conjecture and speculation for European travelers–there is even some evidence that Vikings traveled to the Arctic and traded with indigenous peoples before the Little Ice Age. Early attempts to discover a true Northwest Passage were spearheaded the English; Henry VII sent John Cabot on a search for a direct route to Asia that could be used for more open trading in 1497. Several later explorers followed suit: Estaban Gomez in 1524, Martin Frobisher in 1576, Humphrey Gilbert in 1583, and on and on into the next two centuries.
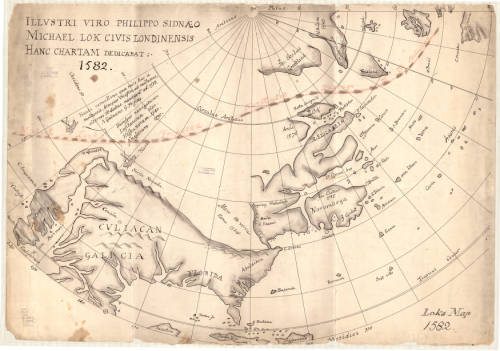
Explorers were also interested in finding alternative entry routes into the Passage– if they couldn’t traverse the Northwest Passage in its entirety, then maybe they could find another way onto the path. In 1539, Francisco De Ulloa embarked on an expedition to sail around the Baja California Peninsula– you might remember this from my July post about the island of California. Besides confirming the fact that California is indeed an island (just kidding), Ulloa also believed that the strait between California and the mainland would lead to an accessible Northwest Passage.
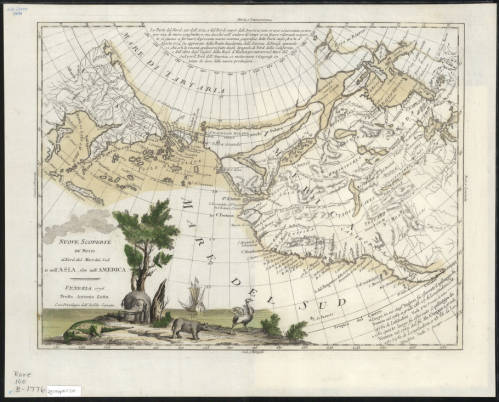
1776 Illustrative Map of the a proposed Northwest Passage through the Hudson Bay. Click the link to see this map in our digital collections! 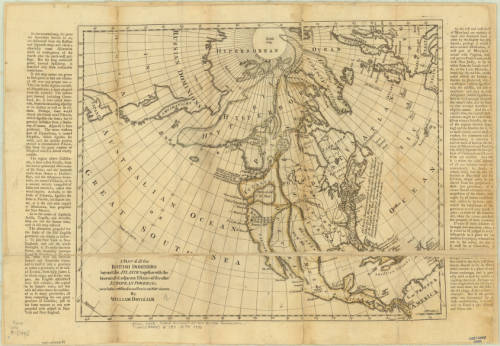
1770 Map of the Arctic, including a possible Northwest Passage. Click the link to see this map in our digital collections!
Many of these expeditions ended in tragedy– the truth was, at the time, there was no reliable pathway through the ice for ships to take. Routes that might be clear in one season would be completely frozen in another. Ships would often become stuck in the ice and forced to winter over where they were or abandon ship. In the 19th century, another rush of Arctic exploration swept Europe and the United States. In an earlier post, I go into some detail about the lost Franklin expedition and the scramble to discover their fate. This was one tragic ending of many expeditions– even Elisha Kent Kane’s rescue expedition in search of Franklin ended in a narrow escape from the deadly winter after which Kane’s health never recovered. Many thought that a purely ship-based expedition would never be possible; John Rae, the man who discovered the true fate of Franklin and his men, made many overland expeditions exploring the continent by using techniques already honed by native peoples who had managed to live there since, well, before the Vikings came to trade with them.
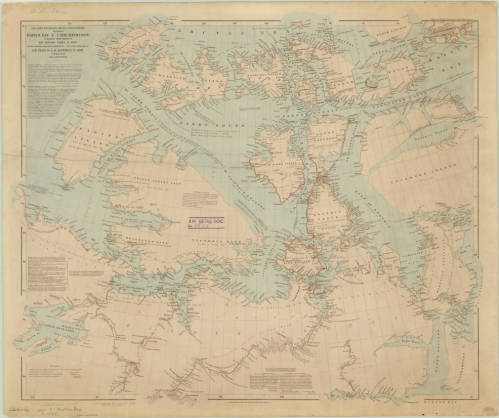
1860 Map of the Arctic Region. Click the link to see this map in our digital collection!
The Northwest Passage would prove impenetrable by ship until 1906, when Roald Amundsen and his six-person crew made a three-year journey through the icy waters in a tiny herring boat. His route through the Rae Strait was full of fairly young ice that was navigable and breakable, but the waters were shallow and only a small boat like the Gjøa could have made the trip.
As time passed and our climate has changed, the sea ice that prevented so many travelers from passing through the Northwest Passage has been shrinking. The Earth’s poles are more susceptible to the effects of climate change, and so the Arctic is warming at a faster rate than the rest of the world. The sea ice normally freezes and melts throughout the year, but the maximum coverage of the ice in winter has been shrinking at an alarming rate. This has some pretty huge implications for the state of our world, but has also led to an uptick in arctic tourism.
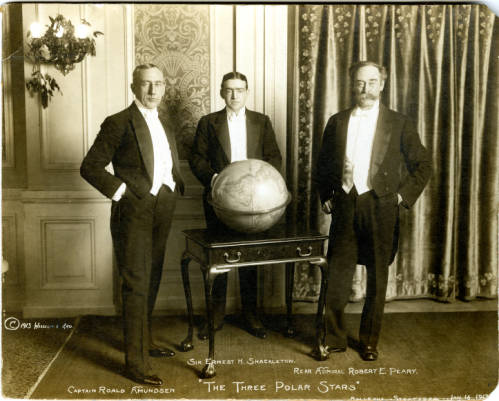
“The Three Polar Stars”: Photo of Amundsen, Shackleton, and Peary. Click the link to see this photo in our digital collection! 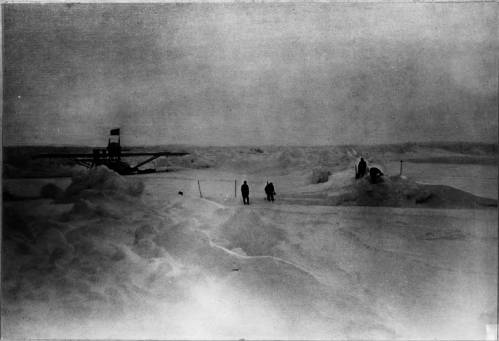
Amundsen’s 1925 Expedition with Ellsworth. Click the link to see this photo in our digital collections!
Because of the melting sea ice, larger boats can pass through the Northwest Passage. During the most recent Arthur Holzeimer Lecture at the AGSL, speaker Lauren Beck commented that, for the first time in history, the Northwest Passage of European imagination has become reality. Only because of the quickly degrading sea ice is the Northwest Passage actually a traversable ship passage.
Amundsen’s successful trip through the Northwest Passage did not turn it into an icy thoroughfare– the ice was still too much of a problem for large cargo ships and the water often dangerously shallow. In 2012, two astonishing events happened: arctic sea ice hit record lows, and ship passage through the Northwest Passage hit record highs. The Panama-Canal was still the better, more consistent choice for trans-ocean shipments, but the new open waterways inspired a different kind of ship-traffic.
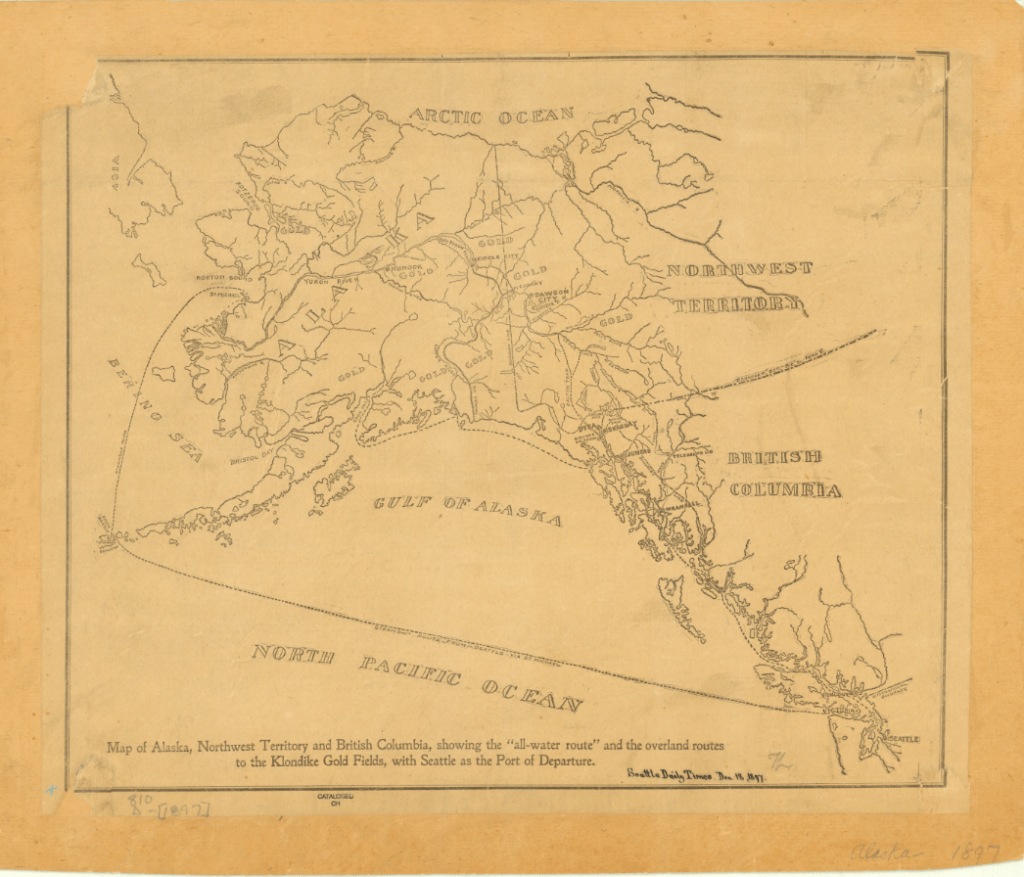
1897 Map of Alaska, Northwest Territory and British Columbia. Click the link to see this in our digital collections!
In 2016, the Crystal Serenity made an unprecedented voyage through the Northwest Passage; though not the first, it was the largest cruise ship to ever pass through the Northwest Passage. The cruise ship had to be escorted by a Polar-Grade ship that could break the ice for the cruise ship to pass though– or perform a rescue. While Crystal Cruises proudly took the Serenity through the Northwest Passage on multiple voyages for “true explore[s]” and is expecting the delivery of a Polar-Grade ship for more cruises, there is some concern about what tourism in the Arctic really means.
For one thing, the communities living there don’t have the infrastructure to deal with the influx of people and garbage. Townships are overwhelmed even by limited groups of tourists visiting. And the effect that human interference has on local flora and fauna– never mind the impending catastrophic oil or fuel spill that seems inevitable with increased traffic– can have deadly consequences for local indigenous communities.
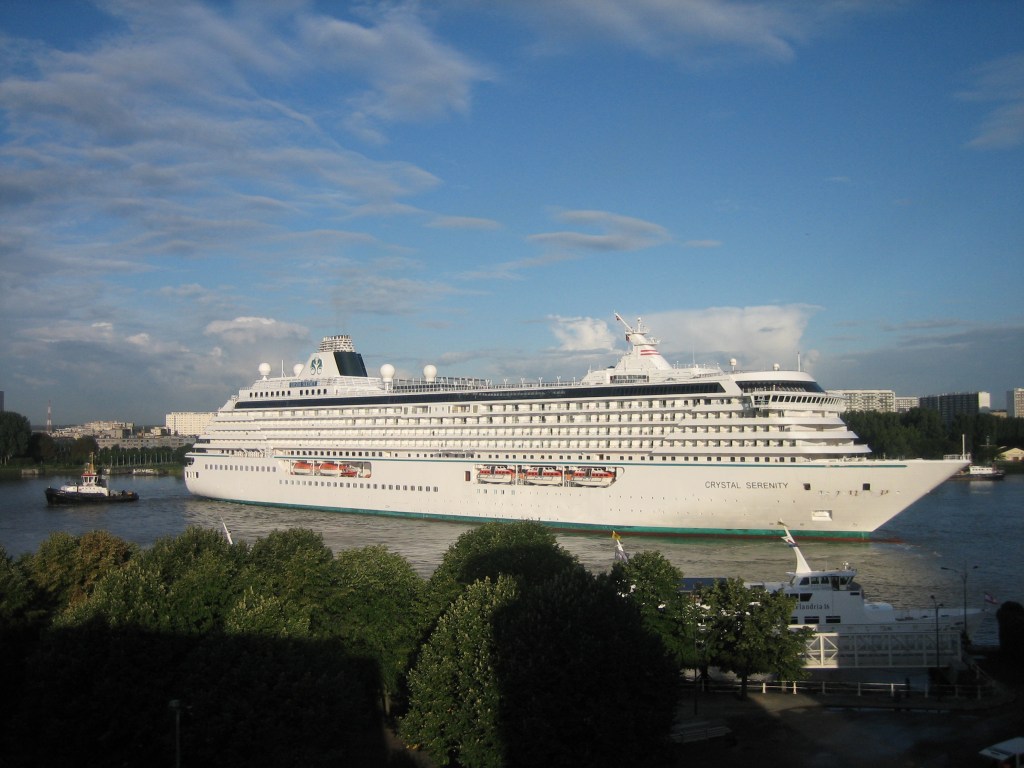
Photo of the Crystal Serenity in Antwerp
For many people, Arctic tourism is a “last-chance” to see an environment that might be on the brink of destruction. And while it is true that experiencing the Arctic has inspired many to defend it from climate destruction, the increased number of ships creates an increased risk of disaster for the environment, the people who live there, and even the tourists themselves. But ignoring the real possibility of climate disaster (or a shipwreck stranding hundreds of tourists on the Arctic Ocean), Arctic tourism also has a troubling philosophical component. Last-chance tourism forces us to think about the destruction of our natural world and how we want to face it. Do we want to put it at potential risk for the chance that tourists become potential activists? Or do we protect it from commercial interference as long as possible?
The answers to these questions are unclear, but as the Arctic tourism industry grows, the search for answers becomes more urgent.
Imperial Russian Black Sea Atlas at the AGSL Part II
By Josephine Miller
Black Sea Atlas
The atlas became a significant work. It would be used by the Russian military for the next 30 years.[1] Manganari’s nautical charts were used as a base for the later editions published by the Imperial Navy. Even the Soviets used Manganari’s charts as a base in the 1920s, about eighty years after the original atlas was published. These later editions are held by the AGS Library. In the AGS Library’s possession are Black Sea and Azov nautical charts that date from the 1880s to the 1920s. Illustrations and corrections were added to later editions. These illustrations include lighthouses, large buildings, sea marks, and day marks to facilitate navigation. Newer measurements of compass declination were also added. However, much of the original Manganari charts remained in the later editions. His drawing of the coastlines, topography, and bathymetry remained as a base for future editions into the early Soviet era. The soil reports given from his nautical charts remained as well. Additionally, the map scales were kept in later editions.
As for the coastlines of the nautical charts, they were drawn according to astronomical and trigonometric calculations. This can be seen virtually all of the nautical charts of the Black Sea Atlas:

“Shore is determined by trigonometric means and many astronomical observations.” From Карта Части Сѣвернаго Берега Черного Моря отъ Одессы до Мыса Херсонеса (A Map of Northern Black Sea Coast, Odessa to Cape Chersonesos). Click the link to see the entire map!
Navigational routes, drawn as sea lanes, are essential to nautical charts. To aide navigation, landmarks and seamarks are given. Manganari plotted different kinds of lines to indicate valuable information for navigation. Each chart in the atlas has almost identical legends in regards to navigation. However, there is slight variations between charts due to mountains or cultural landmarks. These cultural landmarks are usually religious, such as churches and mosques. Here is the legend from the 1891 edition of the Northern Black Sea Coast.
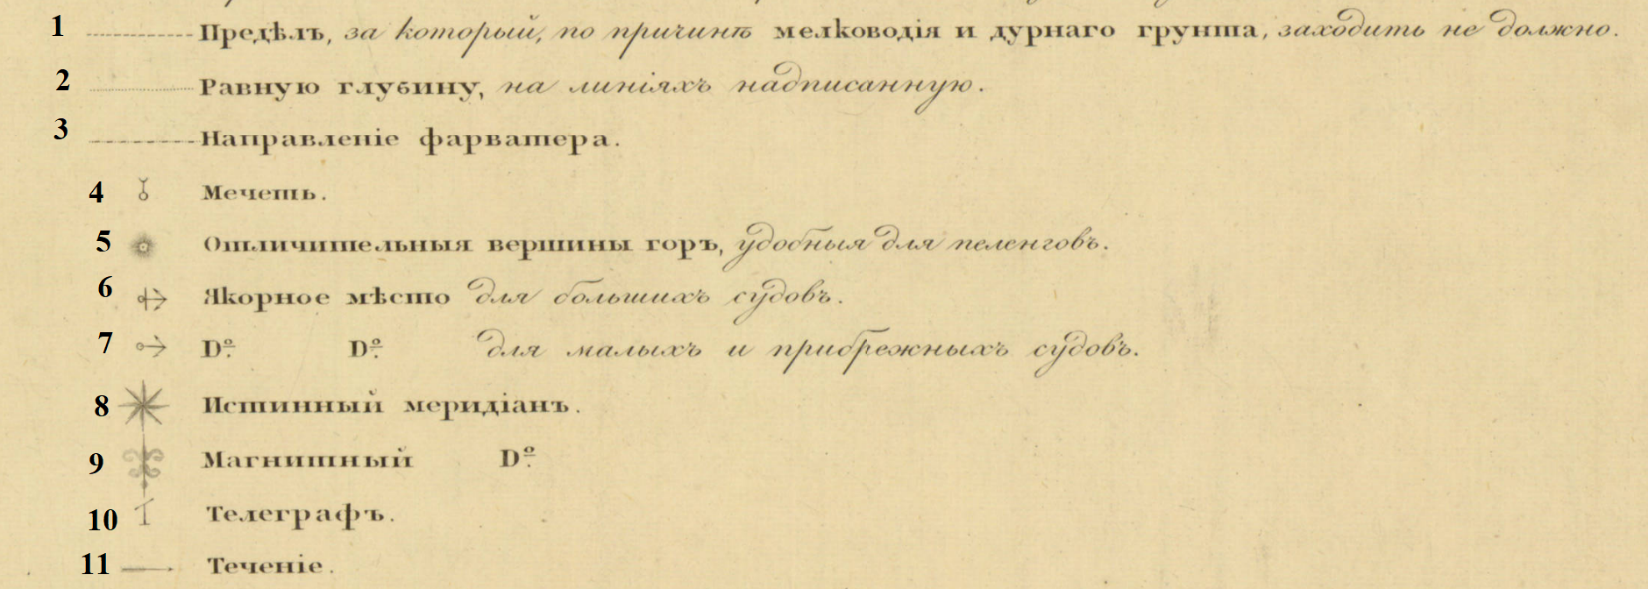
1. The limit for which, due to shallow water and bad soil, should not enter. 2. Equal depths on the plotted line. 3. Direction of fairway. 4. Mosque. 5. Distinctive mountain peaks, convenient for bearing. 6. Anchor place for large ships. 7. Anchor place for small and coastal ships. 8. True Meridian. 9. Magnetic Meridian. 10. Telegraph 11. Tide or Current.
One area of British influence in Russian cartography is measurement. A larger than life ruler, the impact of Peter the Great carried long after his death. His reign is reflected in the field of Russian cartography. Inspired by his tour of the West, he established in the Imperial Navy in 1696. Peter’s command to westernize Russian government brought Western cartography to Russia, military largely in mind. One major reform was to implement British measurements for military use. Consequently, almost two centuries later, the Russian Navy used the British Imperial measurements in its nautical charts. This can be seen on the AGSL’s charts. The Imperial measurements were used for distance and depth.
On this 1891 edition nautical chart of the northern Black Sea coast, the map scale uses British measurements:
On this 1891 edition nautical chart of the northern Black Sea coast, the map scale uses British measurements:
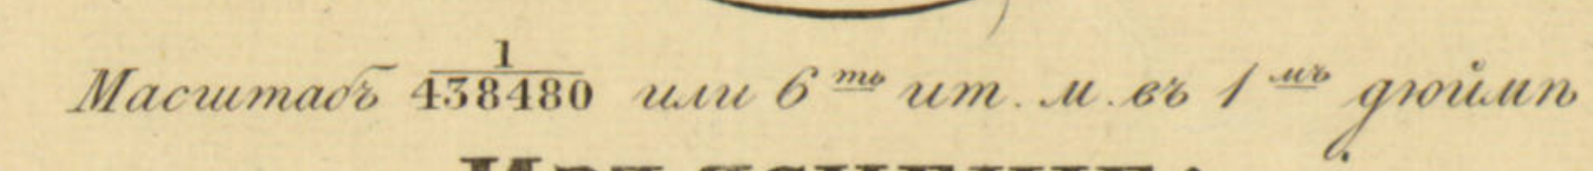
Map Scale of Карта Части Сѣвернаго Берега Черного Моря отъ Одессы до Мыса Херсонеса [Northern Black Sea Coast, Odessa to Cape Chersonesos].

Another example of British measurments is found on the same chart, depth.
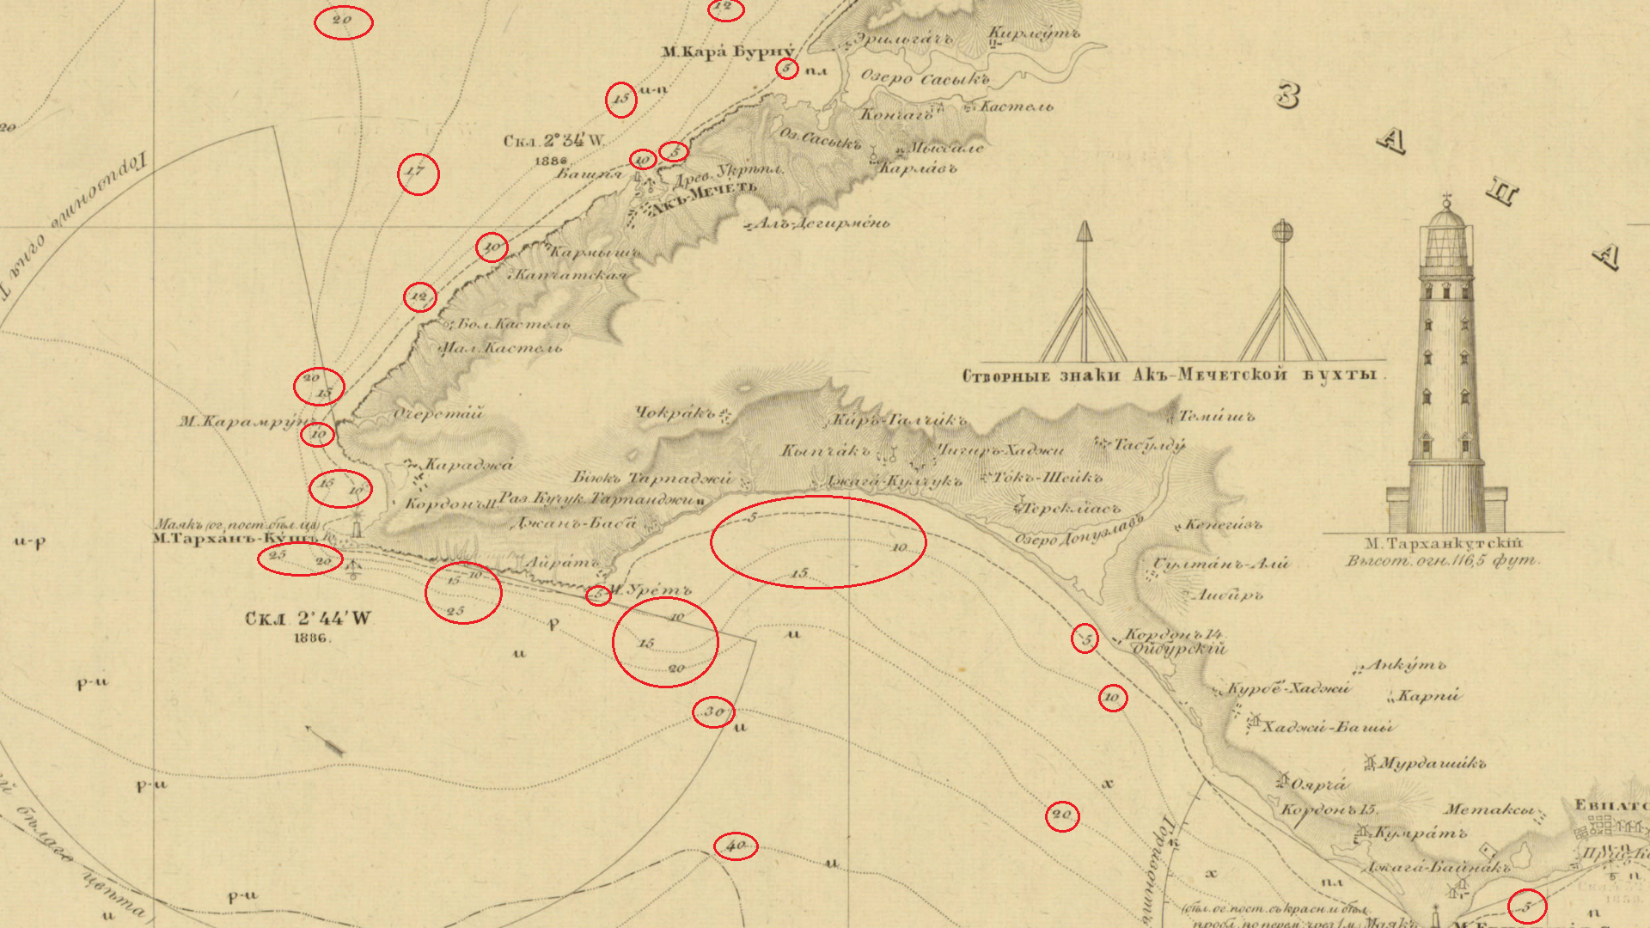
“Depth of sea height measured in six-foot English fathoms – rivers and estuaries in feet.”
Circled below are the depth marks.
From Карта Части Сѣвернаго Берега Черного Моря отъ Одессы до Мыса Херсонеса (Northern Black Sea Coast, Odessa to Cape Chersonesos). Click the link to see this map in our Digital Collections!
In addition to depth, Managanari recorded the soils of the sea floor.
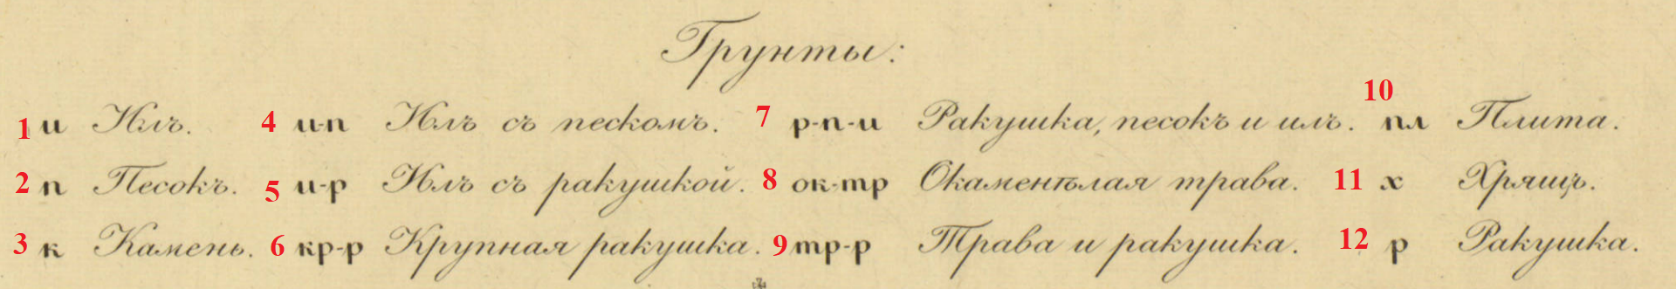
Карта Части Сѣвернаго Берега Черного Моря отъ Одессы до Мыса Херсонеса (Northern Black Sea Coast, Odessa to Cape Chersonesos). Click the link to see the whole map in our Digital Collections!
- Silt
- Sand
- Rock
- Silt with sand
- Silt with shells
- Large Shell
- Shell, sand in silt
- Petrified weeds
- Weeds and shells
- Plate
- Cartilage or Gristle
- Shells
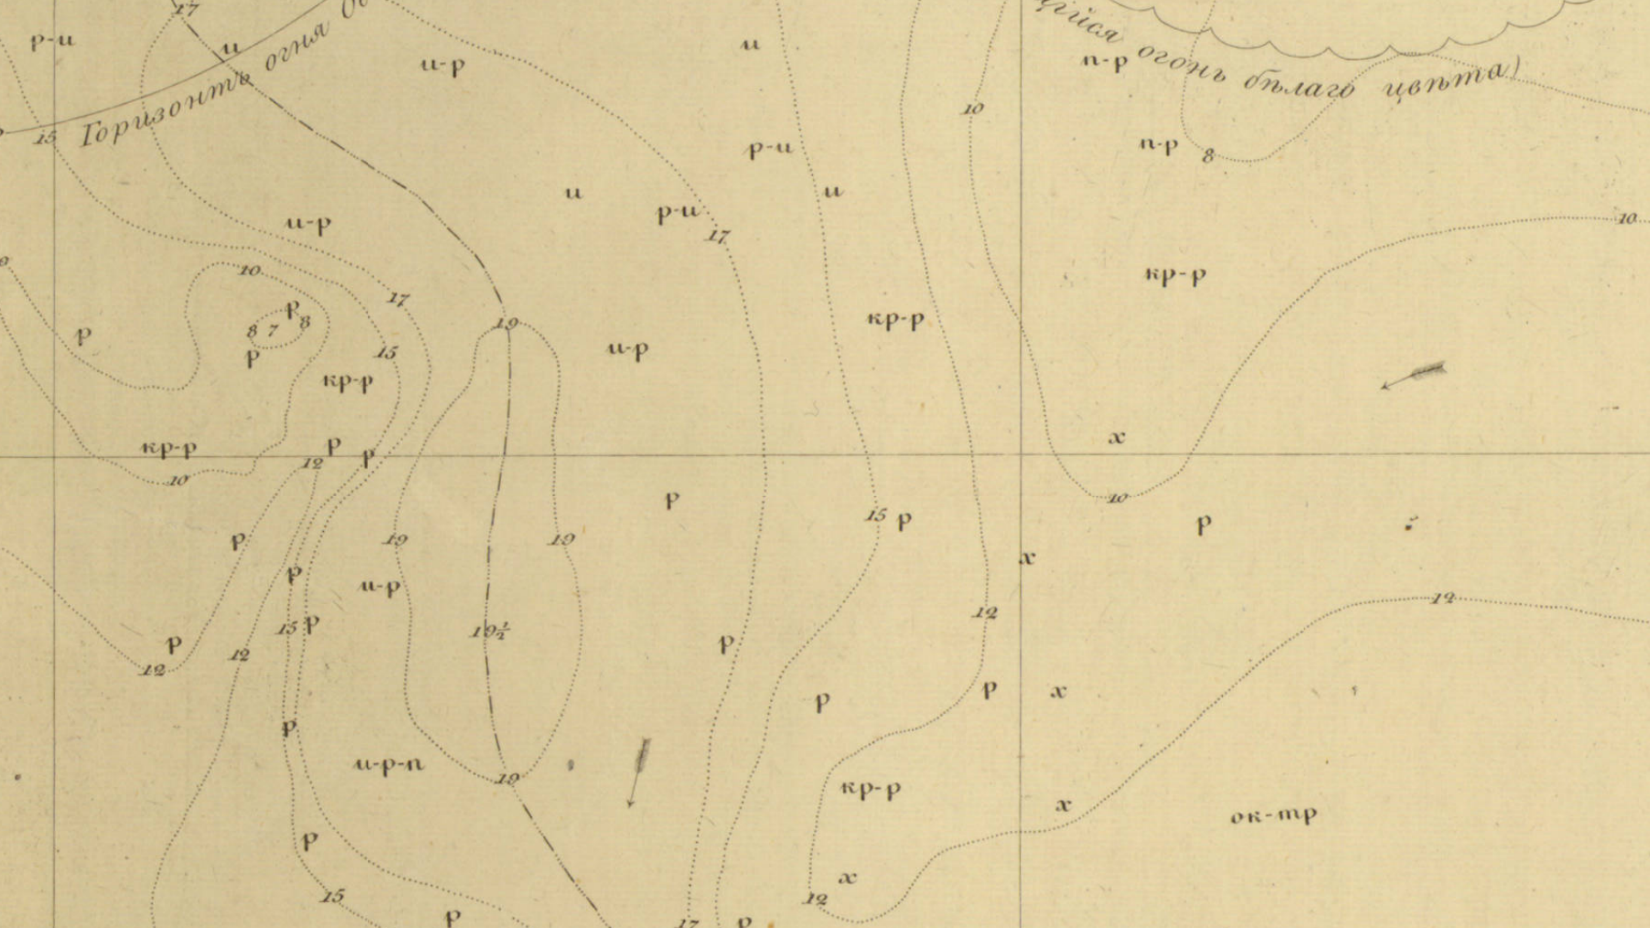
Sea floor on the chart. The letters represent soils as indicated by the legend.
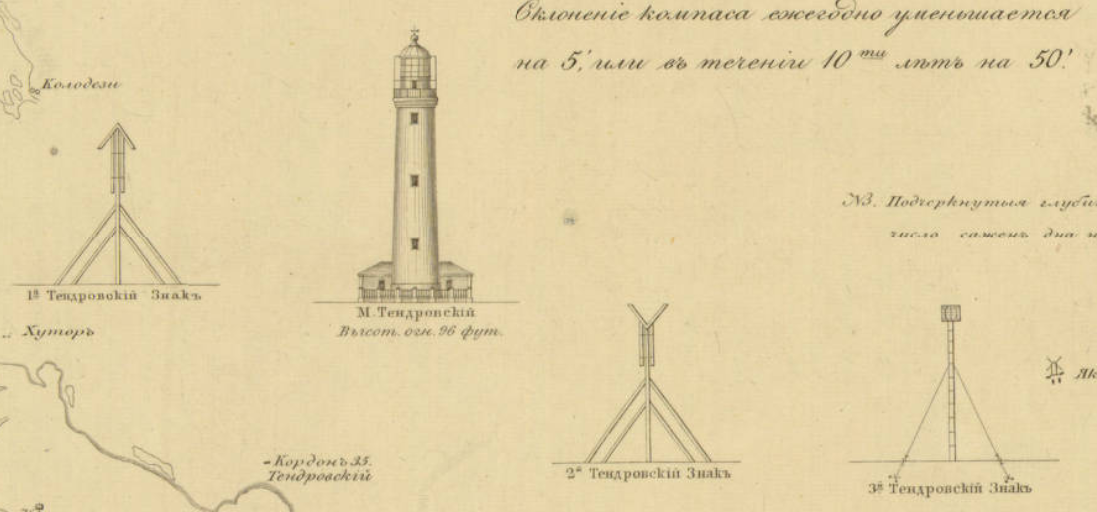
Later editions published after the Treaty of London (1870) include lighthouses and seamarks. Here is the Lighthouse of Tendra Bay on the Southwestern coast of Ukraine. It is noted as 96 feet. Beside it are seamarks. These landmarks aide navigation.
A significant factor to navigation is the prime meridian. In the early 19th century, the Russian militray did not use Greenwich as the prime meridian for its cartography. Instead, Manganari used the Pulkovo Meridian as the prime meridian, which was the practice in Russia at the time. The Pulkovo meridian is located at the Pulkovo Observatory in Saint Petersburg. In the spirit of the reforms in Alexander’s II reign, the later editions adopted Greenwich.

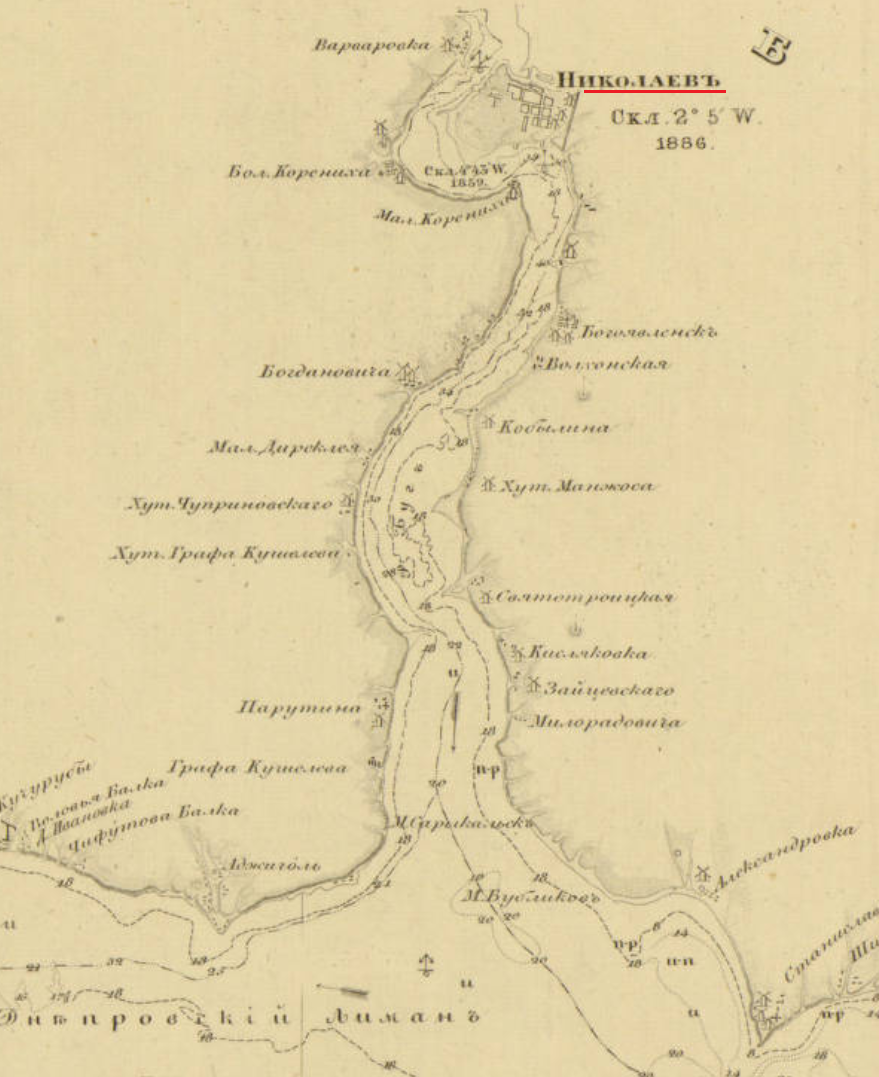
Nikolayev was a base of the Black Sea Fleet. It was also the location of the Depot of the Hydrographic Department of the Black Sea Fleet for the Imperial Navy. In1803, the depot was founded at the request of the Marquis de Traverse, Commander-in-Chief of the Black Sea Fleet at the time. It was established for the engineering needs of the fleet. There, the nautical charts of the Black Sea Atlas were drawn and compiled before engraving. Later editions of the charts were published in Nikolayev. [2]
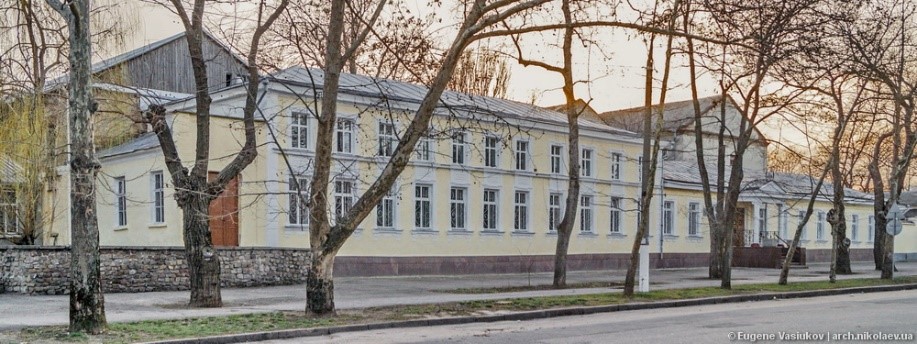
Map Depot of the Hydrographic Department, Black Sea Fleet, Imperial Russian Navy, Nikolyaev. Click the link to learn more!
Later editions borrow from Vice-Admiral Thomas Abel Brimage Spratt (1811-1888). Spratt had an extensive career in the British Navy as an officer, hydrographer, and geologist. He produced a repertoire of nautical charts for the British Admiralty. He was a fellow of the Royal Geographical Society of London, the Zoological Society of London, the Society of Antiquaries of London, the Royal Society of London. The Crimean War provided Britain with the opportunity to survey the Black Sea. The then Captain Spratt completed nautical surveys of the Black Sea during the war. In May of 1851, Captain Spratt was given command of the paddle steamer HMS Spitfire to survey the island of Crete. This was the ship he used in the 1850s for his surveying of the Black Sea as it is noted on the nautical charts of the later editions.
The conditions of the Treaty of Paris (1856) is a primary reason why the Russian Navy would use Spratt’s maps in their own nautical charts of the Black Sea. Given that the Russian Navy could not have fleet in the Black Sea after the Crimean War, the navy could not perform its own surveying in the Black Sea. This situation lasted until the abrogation of the Black Sea clause by the Treaty of London in 1870. For the latter half of the 1850s and through the 1860s, Russia was without a fleet in the Black Sea to do the surveying required for nautical charts. Thus, the Russian navy had to find other sources for the information that they could not gather themselves in the time period. One source would be the Spratt’s surveys. By 1870, when Russia could rebuild the Black Sea Fleet, the most recent Russian survey of the Black Sea was Manganari’s atlas. However, the atlas had been published in 1841-1842 with surveys from the 1820s and 1830s. Spratt’s work was more recent dating to the 1850s. For that reason, Spratt’s work was included in the later editions of the 1880s and 1890s.
The legacy of Captain Manganari carried through one century into the next. His charts for the Black Sea Atlas that he surveyed in the 1880s would be used as a basemap for later editions. Even the Soviets used Managanari’s charts in the 1920s, almost century after Manganari published the Black Sea Atlas. The Black Sea has historically been signifcant for trade and militrary power. It has always has been a politcally contentious region, and remains so to this day. For this reason, the nautical charts of the Black Sea Atlas reflect the political situtiation and its military conflicts in the 19th century.
[1] Ibid.
[2] Васюков, Евгений ; Архитектура Николаева. Депо карт. [Vasi͡ukov, Evgeniĭ ; Nikolayev Architecture. Map Depot.] http://archmykolaiv.com/depo-kart/.
Imperial Russian Nautical Charts of the Black Sea Atlas at the AGSL Part I
By Josephine Miller
The Crimean War: Loss of the Black Sea Fleet and Reform
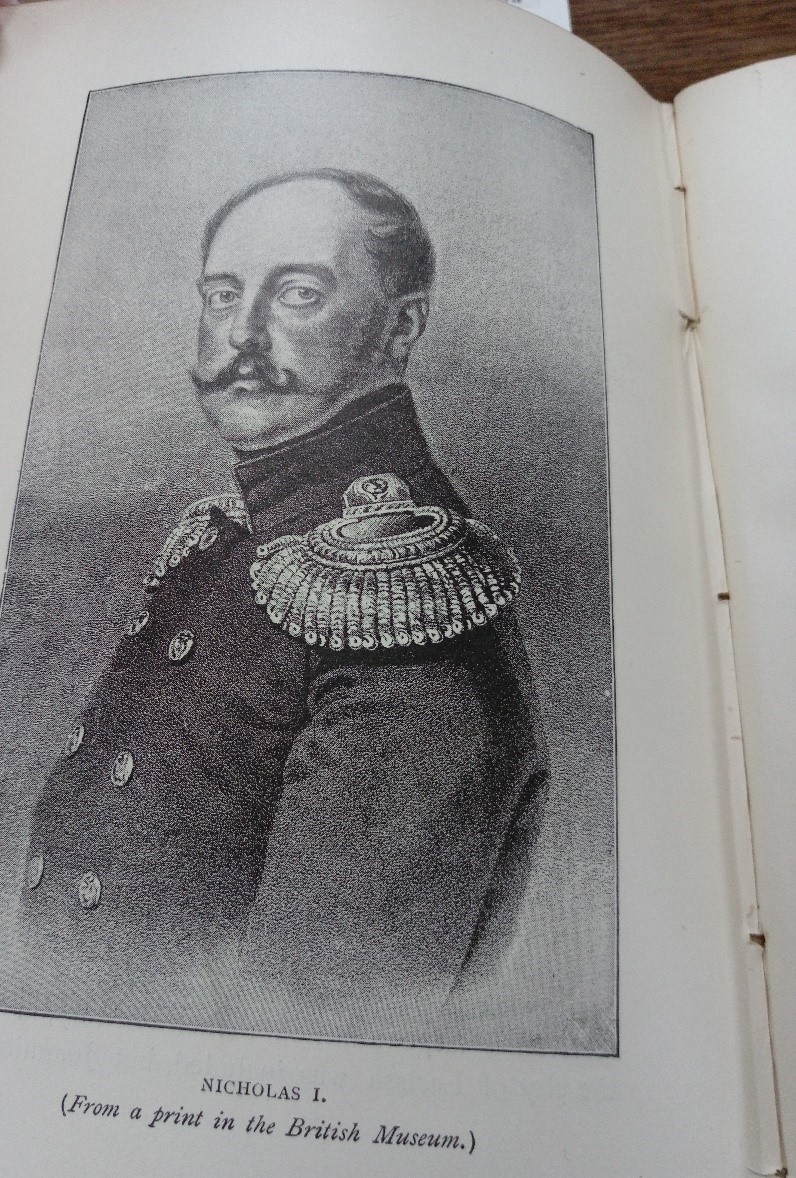
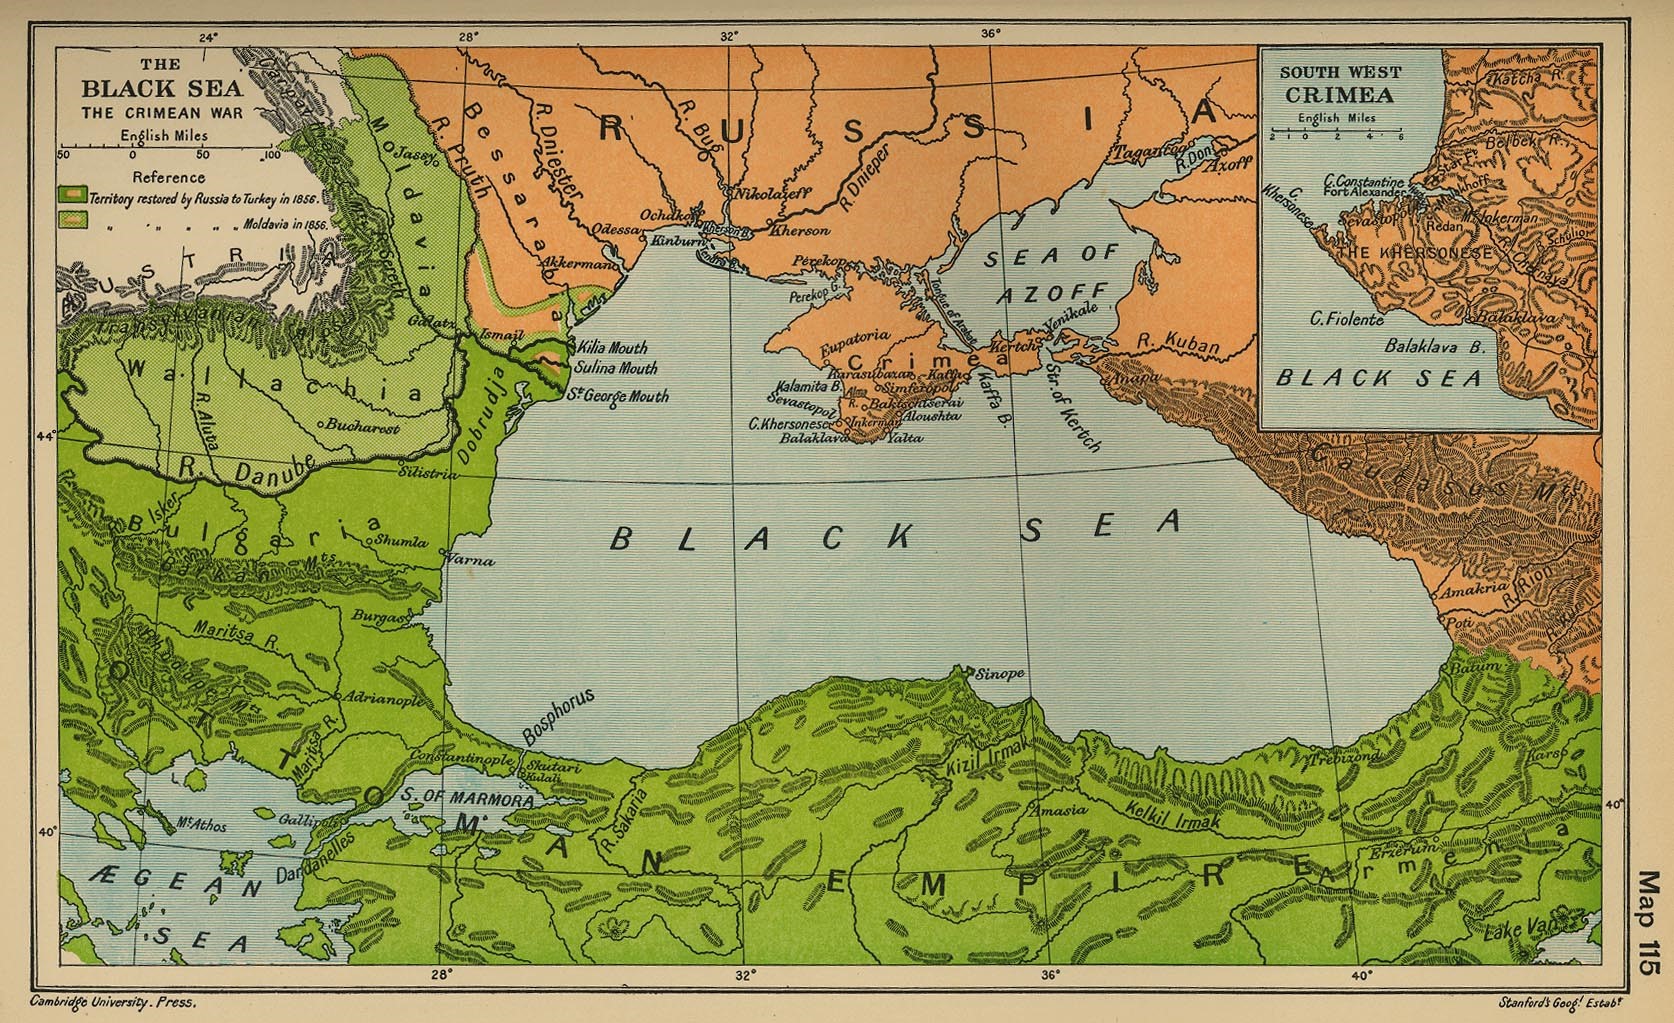
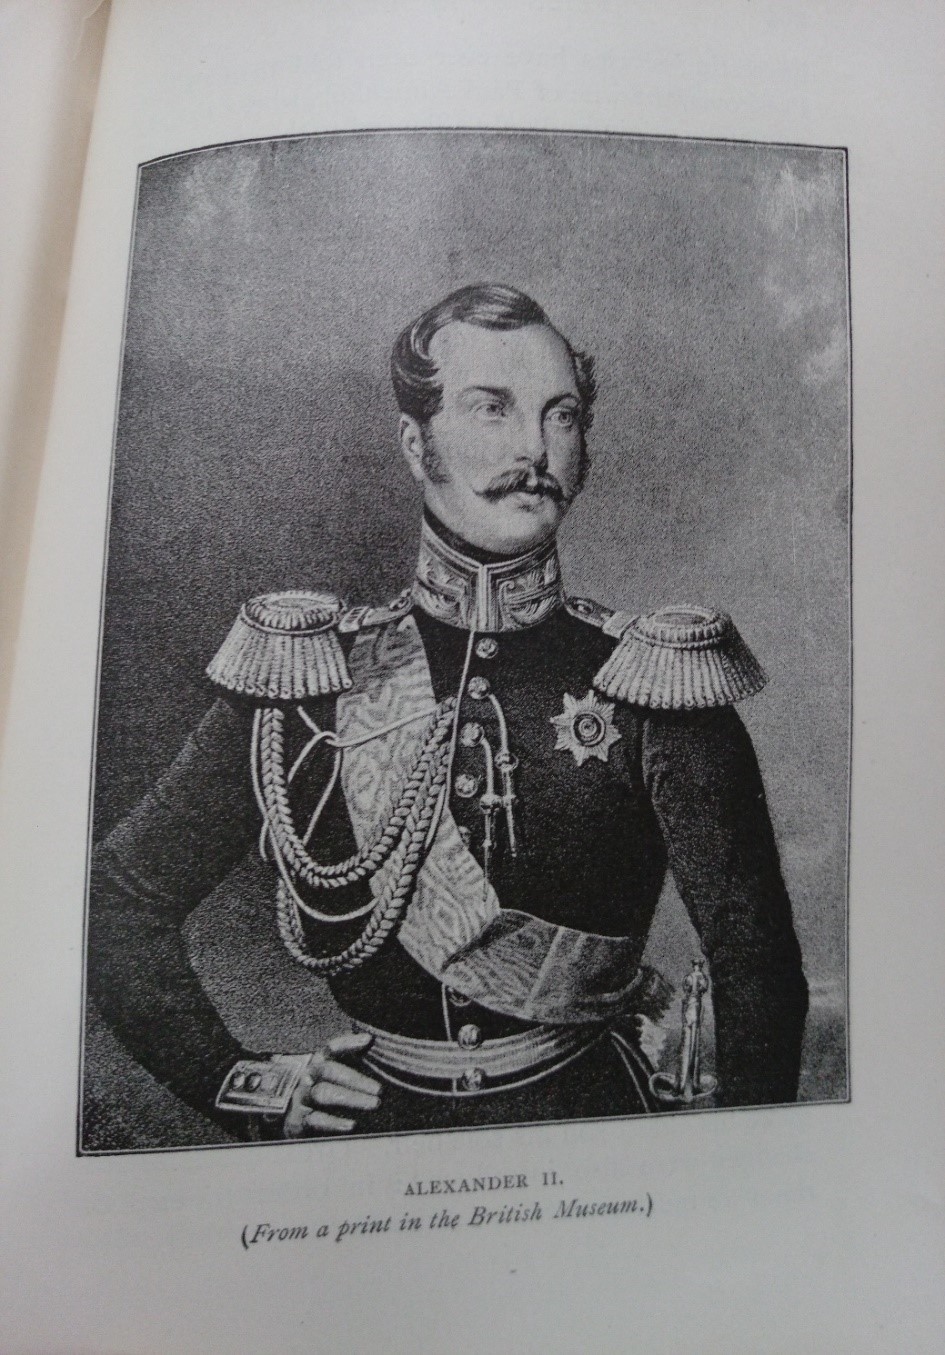
Tsar Alexander II (1818-1881) ascended to the throne on February 19 1855. He succeeded his father Tsar Nicholas I, who died at the age of 58 while Russia was losing the Crimean War (1853-1856). The war was fought between the Russian Empire and the alliance of the Ottoman Empire, Great Britain, France, and Sardinia. Alexander II came to the throne at the age of 36 at the end of the war. In the beginning of his reign, the young tsar was forced to face to the defeat of the Russian Empire. The Treaty of Paris was signed on March 30 1856, officially ending the Crimean War.
In the treaty, Russia ceded the mouth of the Danube and some of Bessarabia to the Ottomans. Additionally, Russia accepted the neutralization of the Black Sea. Neutralization meant not maintaining a navy or coastal fortifications in the Black Sea. In addition, Russia withdrew from the Danube Principalities of Moldavia and Wallachia and accepted an international commission to oversee navigation of the Danube. Russia also forfeited its claim as protectorate of Orthodox Christians in the Holy Land and in the Ottoman Empire. The Crimean War was a great defeat for the Russian Empire, so much so that one rumor circulated that Nicholas I had poisoned himself. The war signified the decline of Russia’s influence in Southeastern Europe and the Near East. [1] As Russia was losing the war and Nicholas I approached death, he requested his funeral to be modest and the period of mourning to be as brief as possible. [2]
The defeat of Crimea was pivotal moment for Russian history. Notably, the Black Sea has historically been of great political importance for Russia, given its warm water ports. The defeat made a deep impression on the young Tsar Alexander II. He began his reign having to deal with the consequences of his father’s reign. Nicholas I had been a conservative autocrat who believed it was his sacred duty to uphold tradition. Under Nicolas I, Russia remained frozen in time. His rule is regarded as a conservative reaction to the Enlightenment. This reaction or rejection is best explained by his doctrine on Official Nationality (Теория официальной народности), which was based on the Triad “orthodoxy, autocracy, and nationalism” (Православие, самодержавие, народность).
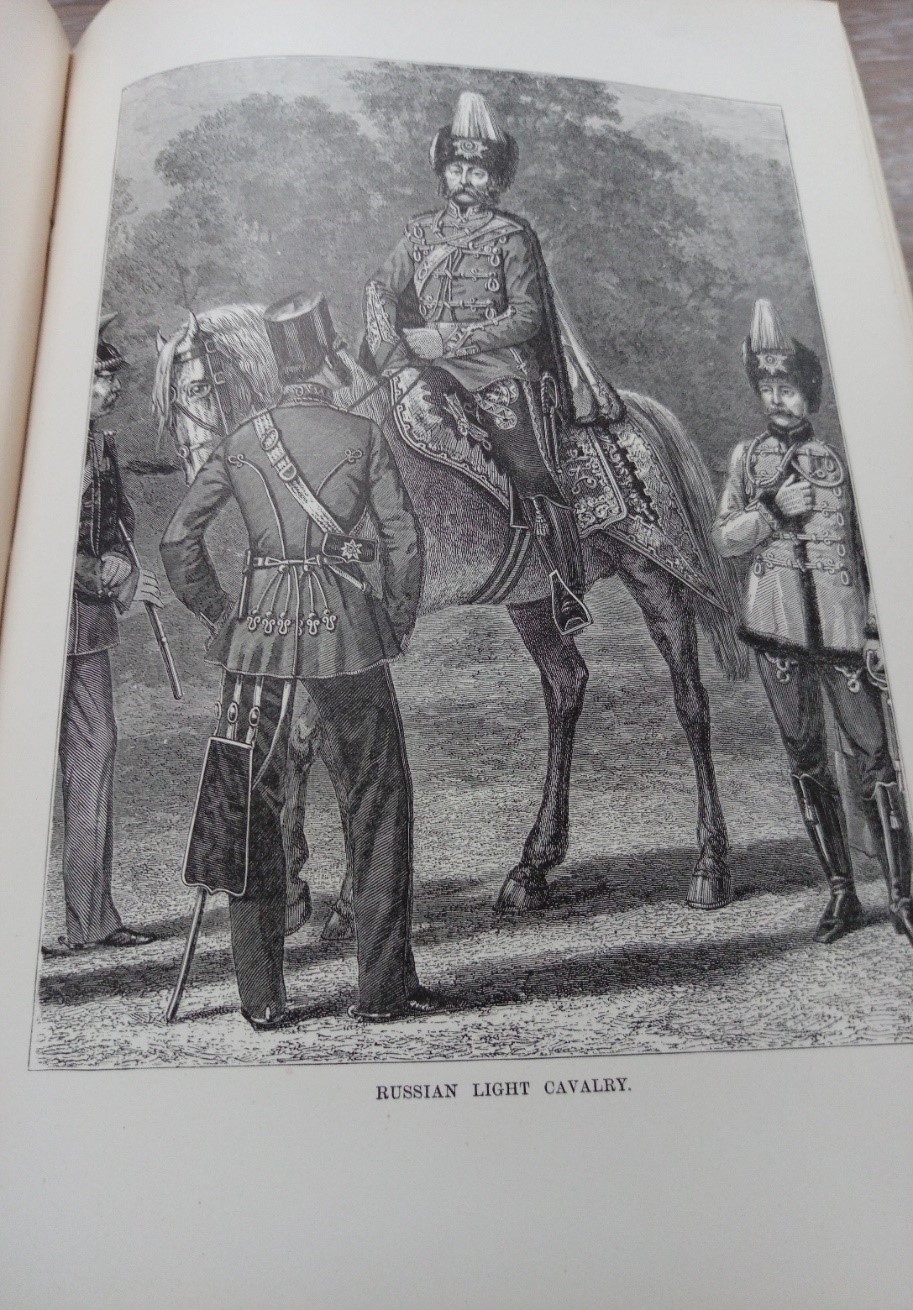
The conservative disposition of Nicholas I is seen as the primary reason for the defeat in Crimea by the reformers. Before the war, Russia and its military enjoyed the positive reputation it had earned in its victory over Napoleon. However, while Nicholas I focused on upholding the tradition of the Triad, the West advanced scientifically and militarily. Consequently, when the war broke out, Russia faced the more advanced and modern armies of the West. The war revealed how lacking and inefficient the Russian military was in comparison to the West. The inefficient bureaucracy of the military, the lack of modern technology, and corruption were all examples of the inadequacies of the military. The outdated Russian military was frozen in the Napoleonic era, while the Allies had advanced into the Victorian era.
The industrialization in the West created a technological gap between Russia and the West, in particular, Russia and Great Britain. Great Britain was Russia’s primary imperial rival at the time. Technologically, the world had changed quickly in the middle of the 19th century. The period saw new technological innovations such as railroads, telegraphs, improved steam engines, and improvements in steel and iron. Significantly, Great Britain had the capability to import food and raw materials from around the world, allowing the mass production of consumer goods. Furthermore, the expanding of education in Western society accommodated this industrialization; Russia, on the other hand, lagged behind in all of these areas.
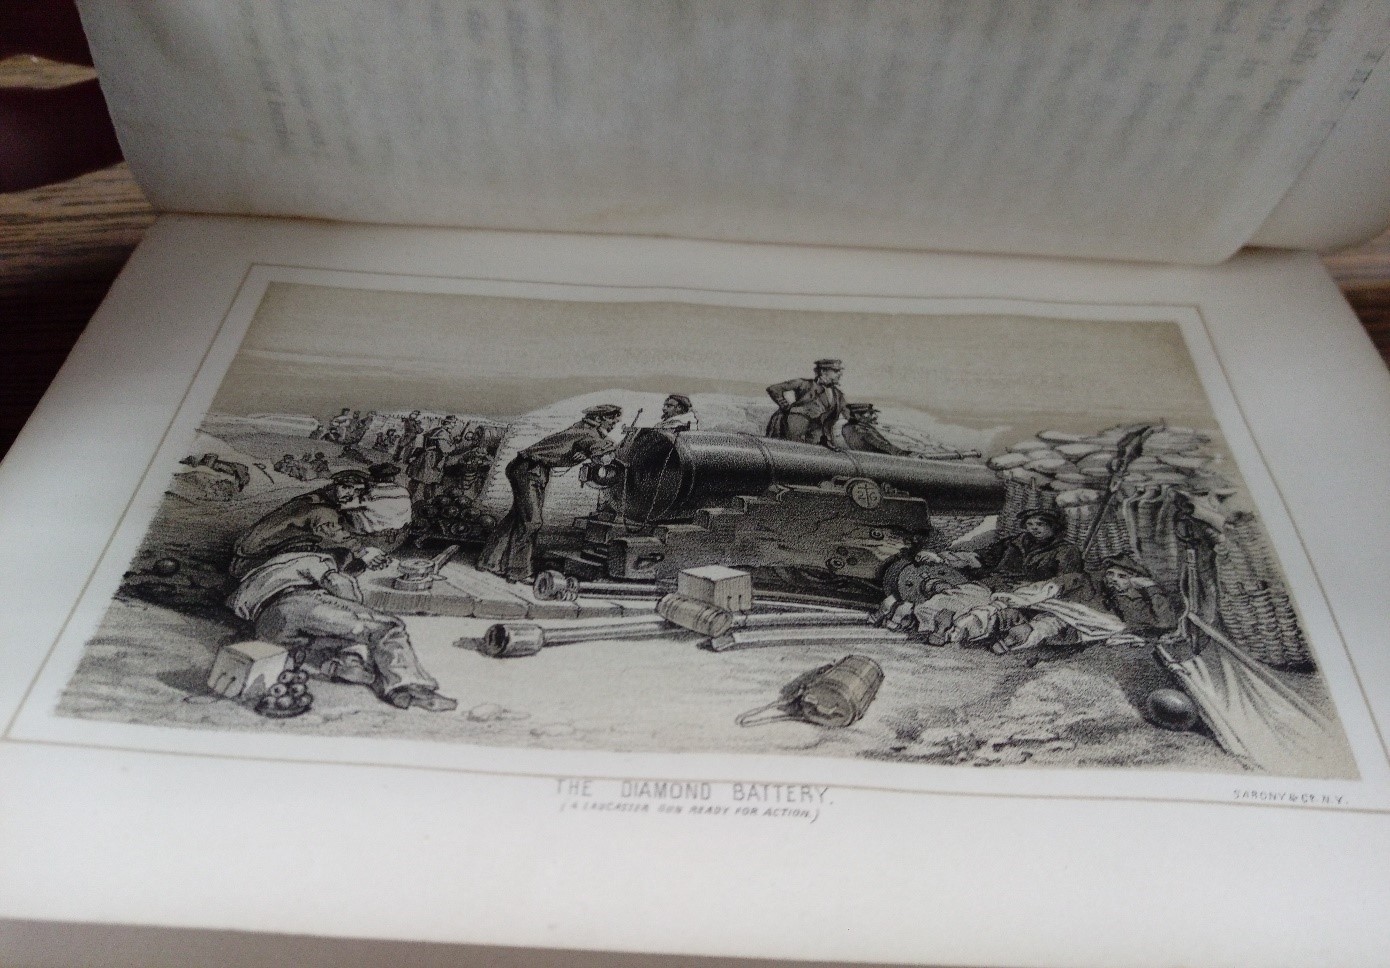
Lagging behind proved to be Russia’s disadvantage in the war. The fighting in the Crimean War revealed these disadvantages in the Russian military. Russia’s fleet of sailing ships could not fight against the steamships of Britain and France. Moreover, the Russian military relied on serfs for soldiers. Serfs could not provide the needed gunpowder and shells for battle. Ultimately, Russian soldiers marched into battle with smoothbore muskets, only to face the long-range artillery fire of the allies. [3]
In the aftermath of Crimea, reform found supporters from both the Slavophiles and the pro-Western factions. Both had been greatly upset by the defeat. The Slavophiles saw war against the Ottomans as a crusade for Orthodox Christianity and for Constantinople. Whereas, the Westernizers were dismayed by Russia losing its preeminent status as a European power that it had earned after the Napoleonic wars.
Alexander II began his reign as a proponent of reform, both militarily and politically. His most famous reform was the abolishment of serfdom, earning him the title the Tsar-Liberator or Alexander the Liberator. Alexander II was not the first tsar that wanted to end serfdom, but the Crimean War provided the opportunity. The serf army proved to be ineffective. If Russia were to modernize it would need to industrialize, which would also include a citizen army. The institution of serfdom inhibited both modernization and industrialization. Serfdom kept the Russian economy agrarian and stifled the innovation needed for industrialism. In the following decade, Alexander II enacted political and military reforms in order to modernize Russia and its military.
Revival of the Black Sea Fleet
Nonetheless, the treaty of Paris limited naval ambition due to the demilitarization stipulation in the treaty. Opportunity would arise in 1870s for the Black Sea Fleet. On September 1, 1870, Emperor Napoleon III surrendered to Prussia. During the Franco-Prussian War, Russian remained officially neutral. However, according to the memoirs of Count Dmitry Milyutin, Field Marshall and Minister of War Alexander II sent St. George Crosses to Prussian officers and a congratulatory telegram to King Wilhelm I after Prussian victory. Notably, Wilhelm I was the maternal uncle of Alexander II. Additionally, Russian officers served in the Prussian army. [4]
The Franco-Prussian War led to the establishment of the German Empire. Upon unification, King Wilhelm I of Prussia became German Emperor. Otto von Bismarck, Chancellor of the new German Empire, wanted to gain favor with Russia due to the mutual threat of Polish nationalism. Bismarck sent Count Constantin von Alvensleben to Russia in order to come to an agreement on cooperation against Polish rebellion. [5]
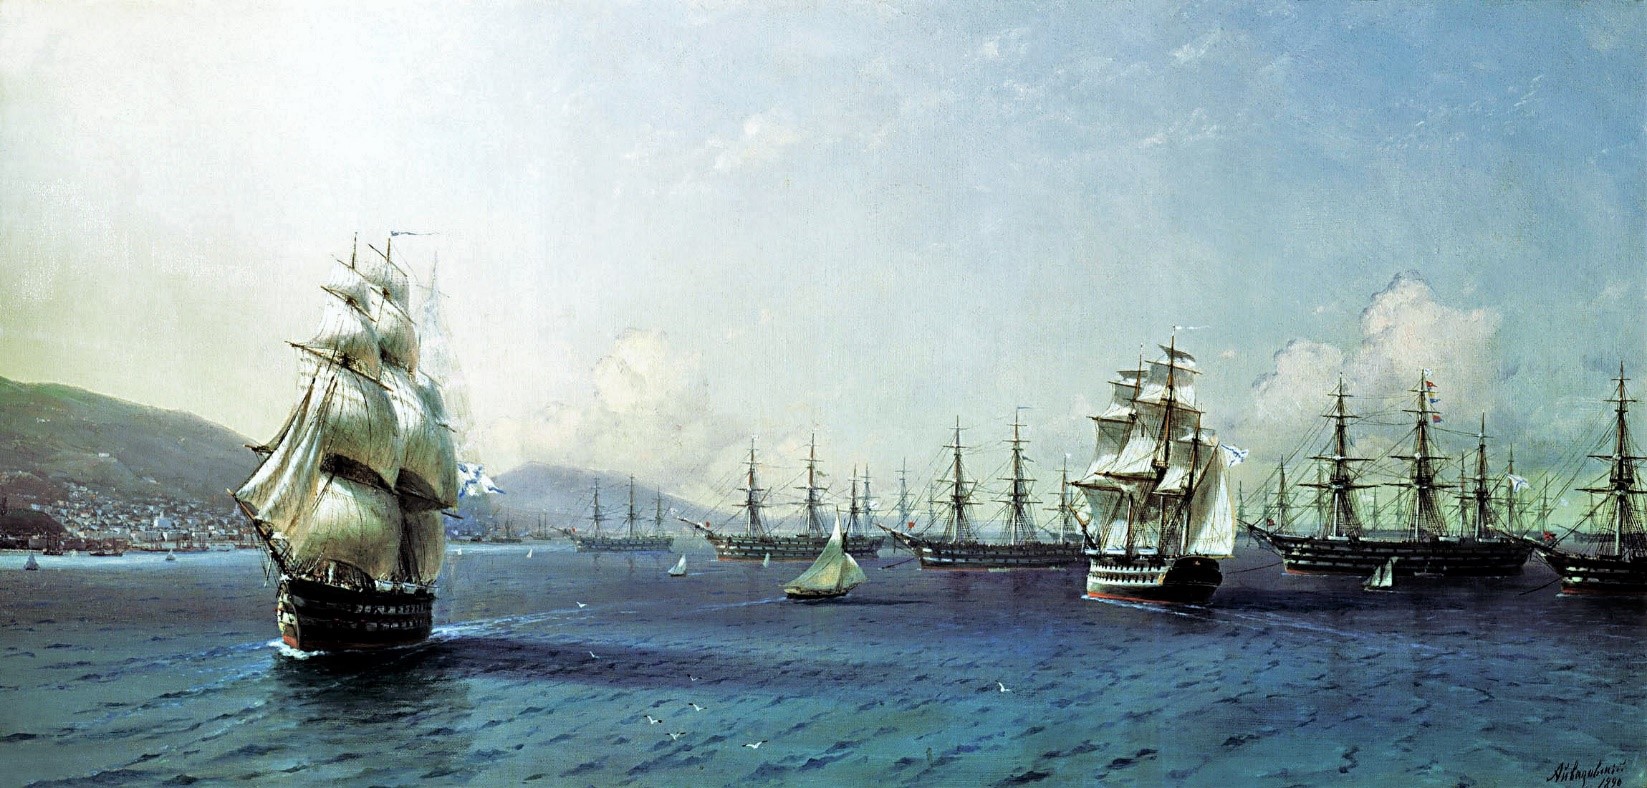
Black Sea Fleet in the Bay of Theodosia, just before the Crimean War, 1890, Ivan Aivazovsky,
Feodosiya National Gallery I. K. Aivazovsky
German rapprochement aided Russia in a more important foreign policy objective for Russia: the Black Sea. In 1870, Prince Alexander Gorchakov, Foreign Minister, used France’s defeat to denounce the Black Sea clause of the Treaty of Paris (1856). Gorchakov’s denouncement included the refusal to uphold the clause. In his justification, Gorchakov cited to Turkey violations of the treaty and he argued that the conditions of warfare have become more dangerous since 1856 due to the more destructive armaments. Bismarck supported Gorchakov on the Black Sea clause. Though Britain protested, the European powers agreed to it through the Treaty of London in 1871, which abrogated the Black Sea clause of the Treaty of Paris. This allowed Russia to rebuild the Black Sea Fleet and military fortifications on the Black Sea. [6]
Egor Pavlovich Manganari (Егор Павлович Манганари)
The Atlas of the Black Sea (Атлас Чёрного Моря) was published between 1841 and1842. The surveying for the atlas was led by Captain-Lieutenant Egor Manganari (1796-1868). He was the eldest son of Panayot Manganari, (also known as Pavel Manganari in Russian). Panayot Manganari was a Greek nobleman and immigrant to the Russian Empire from the Greek island Chios. He immigrated to Russia due to conflict with the Ottomans, taking advantage of the Catherine the Great’s invitation to settle Greeks in the Southern Russian Empire. He married Alexandra Timofeevna and they had six children: three daughters, Maria, Ekaterina, and Anastasia, and three sons who served as officers in the Black Sea Fleet, Egor, Ivan, and Mikhail. The family first lived in Yevpatoriya and later in Nikolayev. [7]
Egor Manganari served in the Black Sea Fleet of the Imperial Russian Navy as a naval officer and hydrographer. He attended the Black Sea Navigational School in Nikolayev. There he studied Russian, English, classical subjects, and subjects related to geography such as mathematics, geodesy, navigation, and cartography.[8]
In 1813, he entered the Black Sea Fleet as a Navigation Assistant. By 1816, he received the rank of First Officer Midshipman and was later promoted to Lieutenant in 1821. He was appointed commander of the rig Nikolai (Николай) where he produced an inventory the Dnieper Estuary and the Bug River. His work was highly praised, earning him the Order of Saint Anna, 3rd Class, and the commission to survey the Azov and Black Sea. He commanded the Nikolai until 1827, when he received the command of the yacht Golubka (Голубка). The expedition of the Black Sea was launched in 1826 and continued for ten years. Manganari still participated in the Russo-Turkish War (1828–29), for which he was awarded the Order of Saint Vladimir, 4th Class. In 1833-1834, during the Caucasian War, he also did hydrographic surveys of the Caucasus, for which he was awarded the Order of Saint Stanislav, 2nd class. [9]
By 1838, he had been promoted to lieutenant-colonel and completed his survey of the Black Sea and Azov Sea. His nautical charts were supported by the Admiral Mikhail Lazarev, Commander of the Black Sea Fleet. After the Black Sea expedition concluded, he was granted permission by the Navy to publish them. The nautical charts were brought to Saint Petersburg to be engraved and published as an atlas. After the publication of the atlas, Manganari was awarded the Order of Saint George, 4th class. Manganari continued to do hydrographic surveying of the Black Sea after the publication of the atlas. In 1849, he received the rank of major-general and was appointed as the director of the Lighthouses of the Black Sea and Azov Sea. Manganari remained at that post until he retired in 1856. [10] [11]
[1] Nicholas V. Riasanovsky and Mark D. Steinberg, A History of Russia, (New York: Oxford University Press, 2011), 333-336.
[2] Kaputina, Tatiana Aleksandrovna. “Nicholas I.” In The Emperors and Empresses of Russia: Rediscovering the Romanovs, (Armonk, New York: M. E. Sharpe), 292.
[3] Russia in the Nineteenth Century: Autocracy, Reforms, and Social Change, 1814-1914, (Armonk, New York: M.E. Sharpe) 85.
[4] Ibid. 161.
[5] Nicholas V. Riasanovsky and Mark D. Steinberg, A History of Russia, (New York: Oxford University Press, 2011), 380.
[6] Russia in the Nineteenth Century Autocracy, Reforms, and Social Change, 1814-1914, (Armonk, New York: M.E. Sharpe) 161.
[7] Выдающиеся морские гидрографы братья Манганари. Часть I. Николаевский Базар. [Outstanding Marine Hydrograph Brothers. Part I, Nikolayev Bazar].
[8] Ibid.
[9] Ibid.
[10] Ibid.
[11] Üçsu, Kaan. “Cartographies of the ‘Eastern Question’: Some Considerations on Mapping the Sea of Marmara and the Black Sea in the Nineteenth Century.” In Philosophy of Globalization, (Berlin/Boston: De Gruyter, 2018) 259-260.
To the Lighthouse: Representations of Lighthouses on Maps
By Lauren Maddox
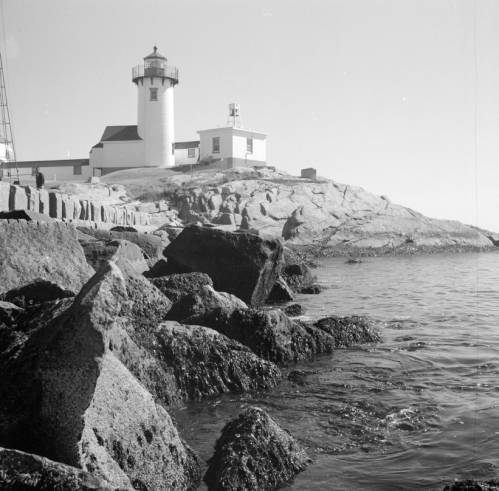
Click the link to see Clarence W. Sorensen’s photo of a lighthouse in Gloucester, c. 1934-1969 in our Digital Collections
Lighthouses have been guiding us home over the rough sea from our earliest maritime beginnings– but our understanding of lighthouses and how we represent them on maps and nautical charts has changed drastically since these beginnings. While references to early lighthouses exist, including Homer’s claim that Palamedes devised a system of lit beacons to guide sailors, the first “regularly maintained” lighthouse in antiquity was on Cape Incihisari. J. Saxby Wryde, however, claims in his British Lighthouses: Their History and Romance that the most celebrated lighthouses in antiquity were built 400 years after this. The Colossus at Rhodes was erected in 278 B.C. and destroyed by an earthquake in 224; the remains were sold as brass and carted away on camels by a merchant. In 270 B.C., the famous Lighthouse of Alexandria was constructed in honor of Ptolemy Philadelphus on a small island in the Bay of Alexandria.
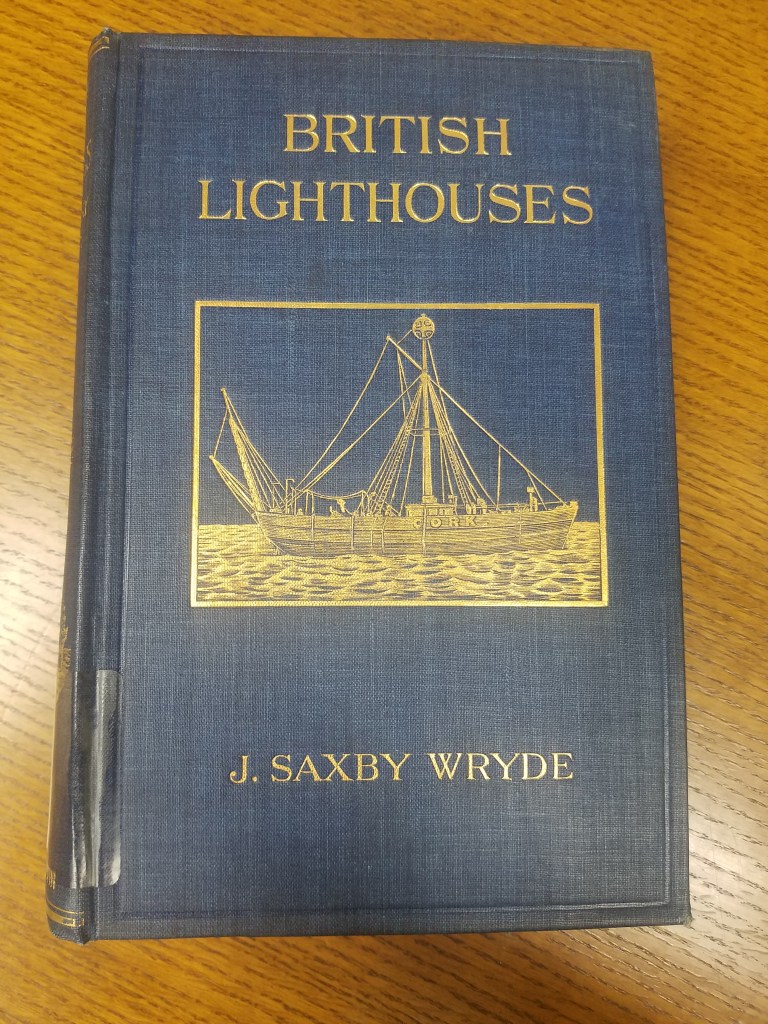
Click the link for details about the 1913 Edition of British Lighthouses 
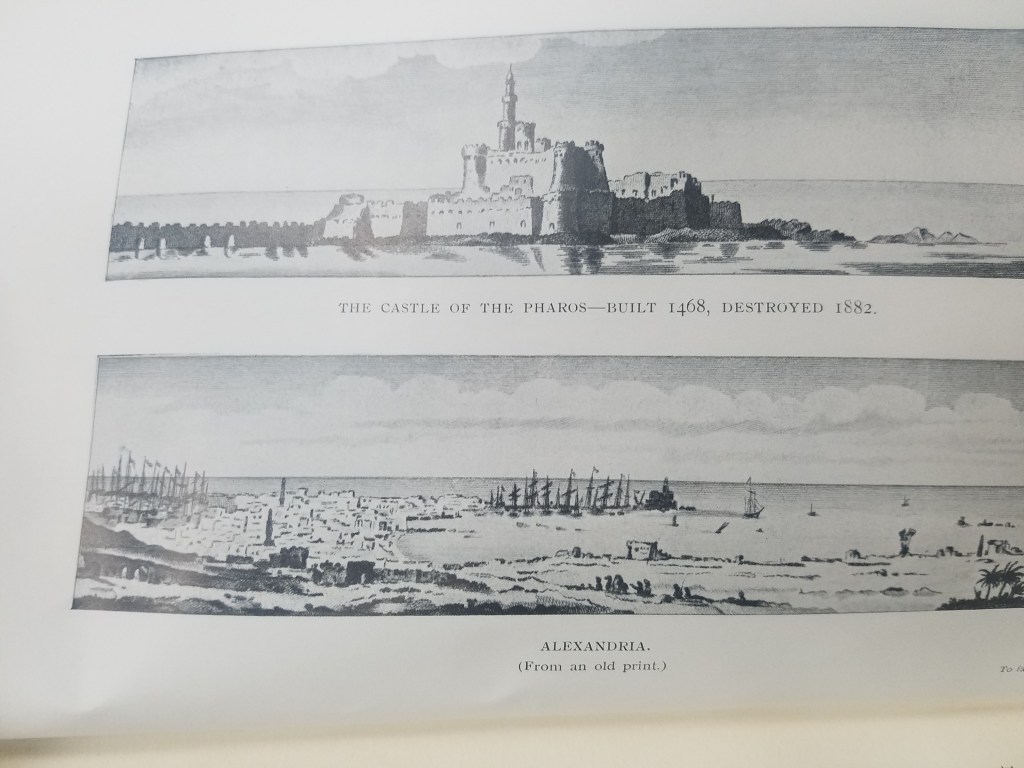
Illustration of the Lighthouse of Alexandria
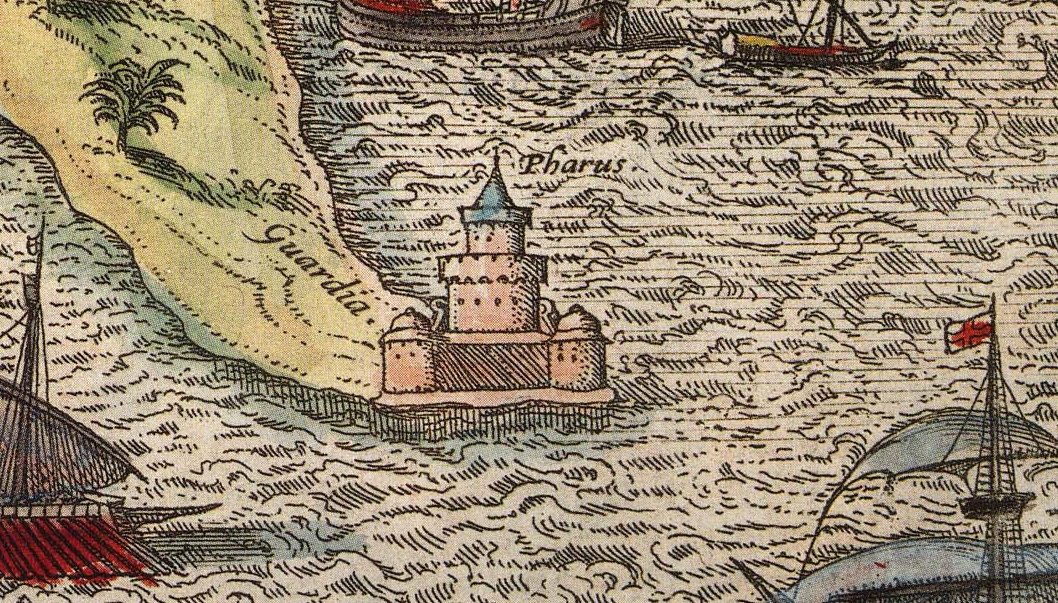
The function of lighthouses has also evolved over the years; in antiquity, lighthouses were only expected to indicate the location of ports. Lighthouses as we understand them today act as warnings for boats approaching reefs and rocky shores. This understanding of lighthouses as way markers is reflected on ancient maps. The Lighthouse of Alexandria is depicted pictorially in Braun and Hogenberg’s 16th century atlas Civitates Orbis Terrarum–the lighthouse is given the same attention as the city’s obelisk or its ruins; its existence is simply recorded and labeled with a single word: pharus for lighthouse. The lighthouse has obviously done its job, though; ships are shown moving towards the lighthouse and the port it is indicating. One ship is even flying St. George’s Cross, the British flag used by crusaders that was later adopted as the national flag in Medieval England.
Click the link to see the Atlas the illustration of The Lighthouse of Alexandria is in 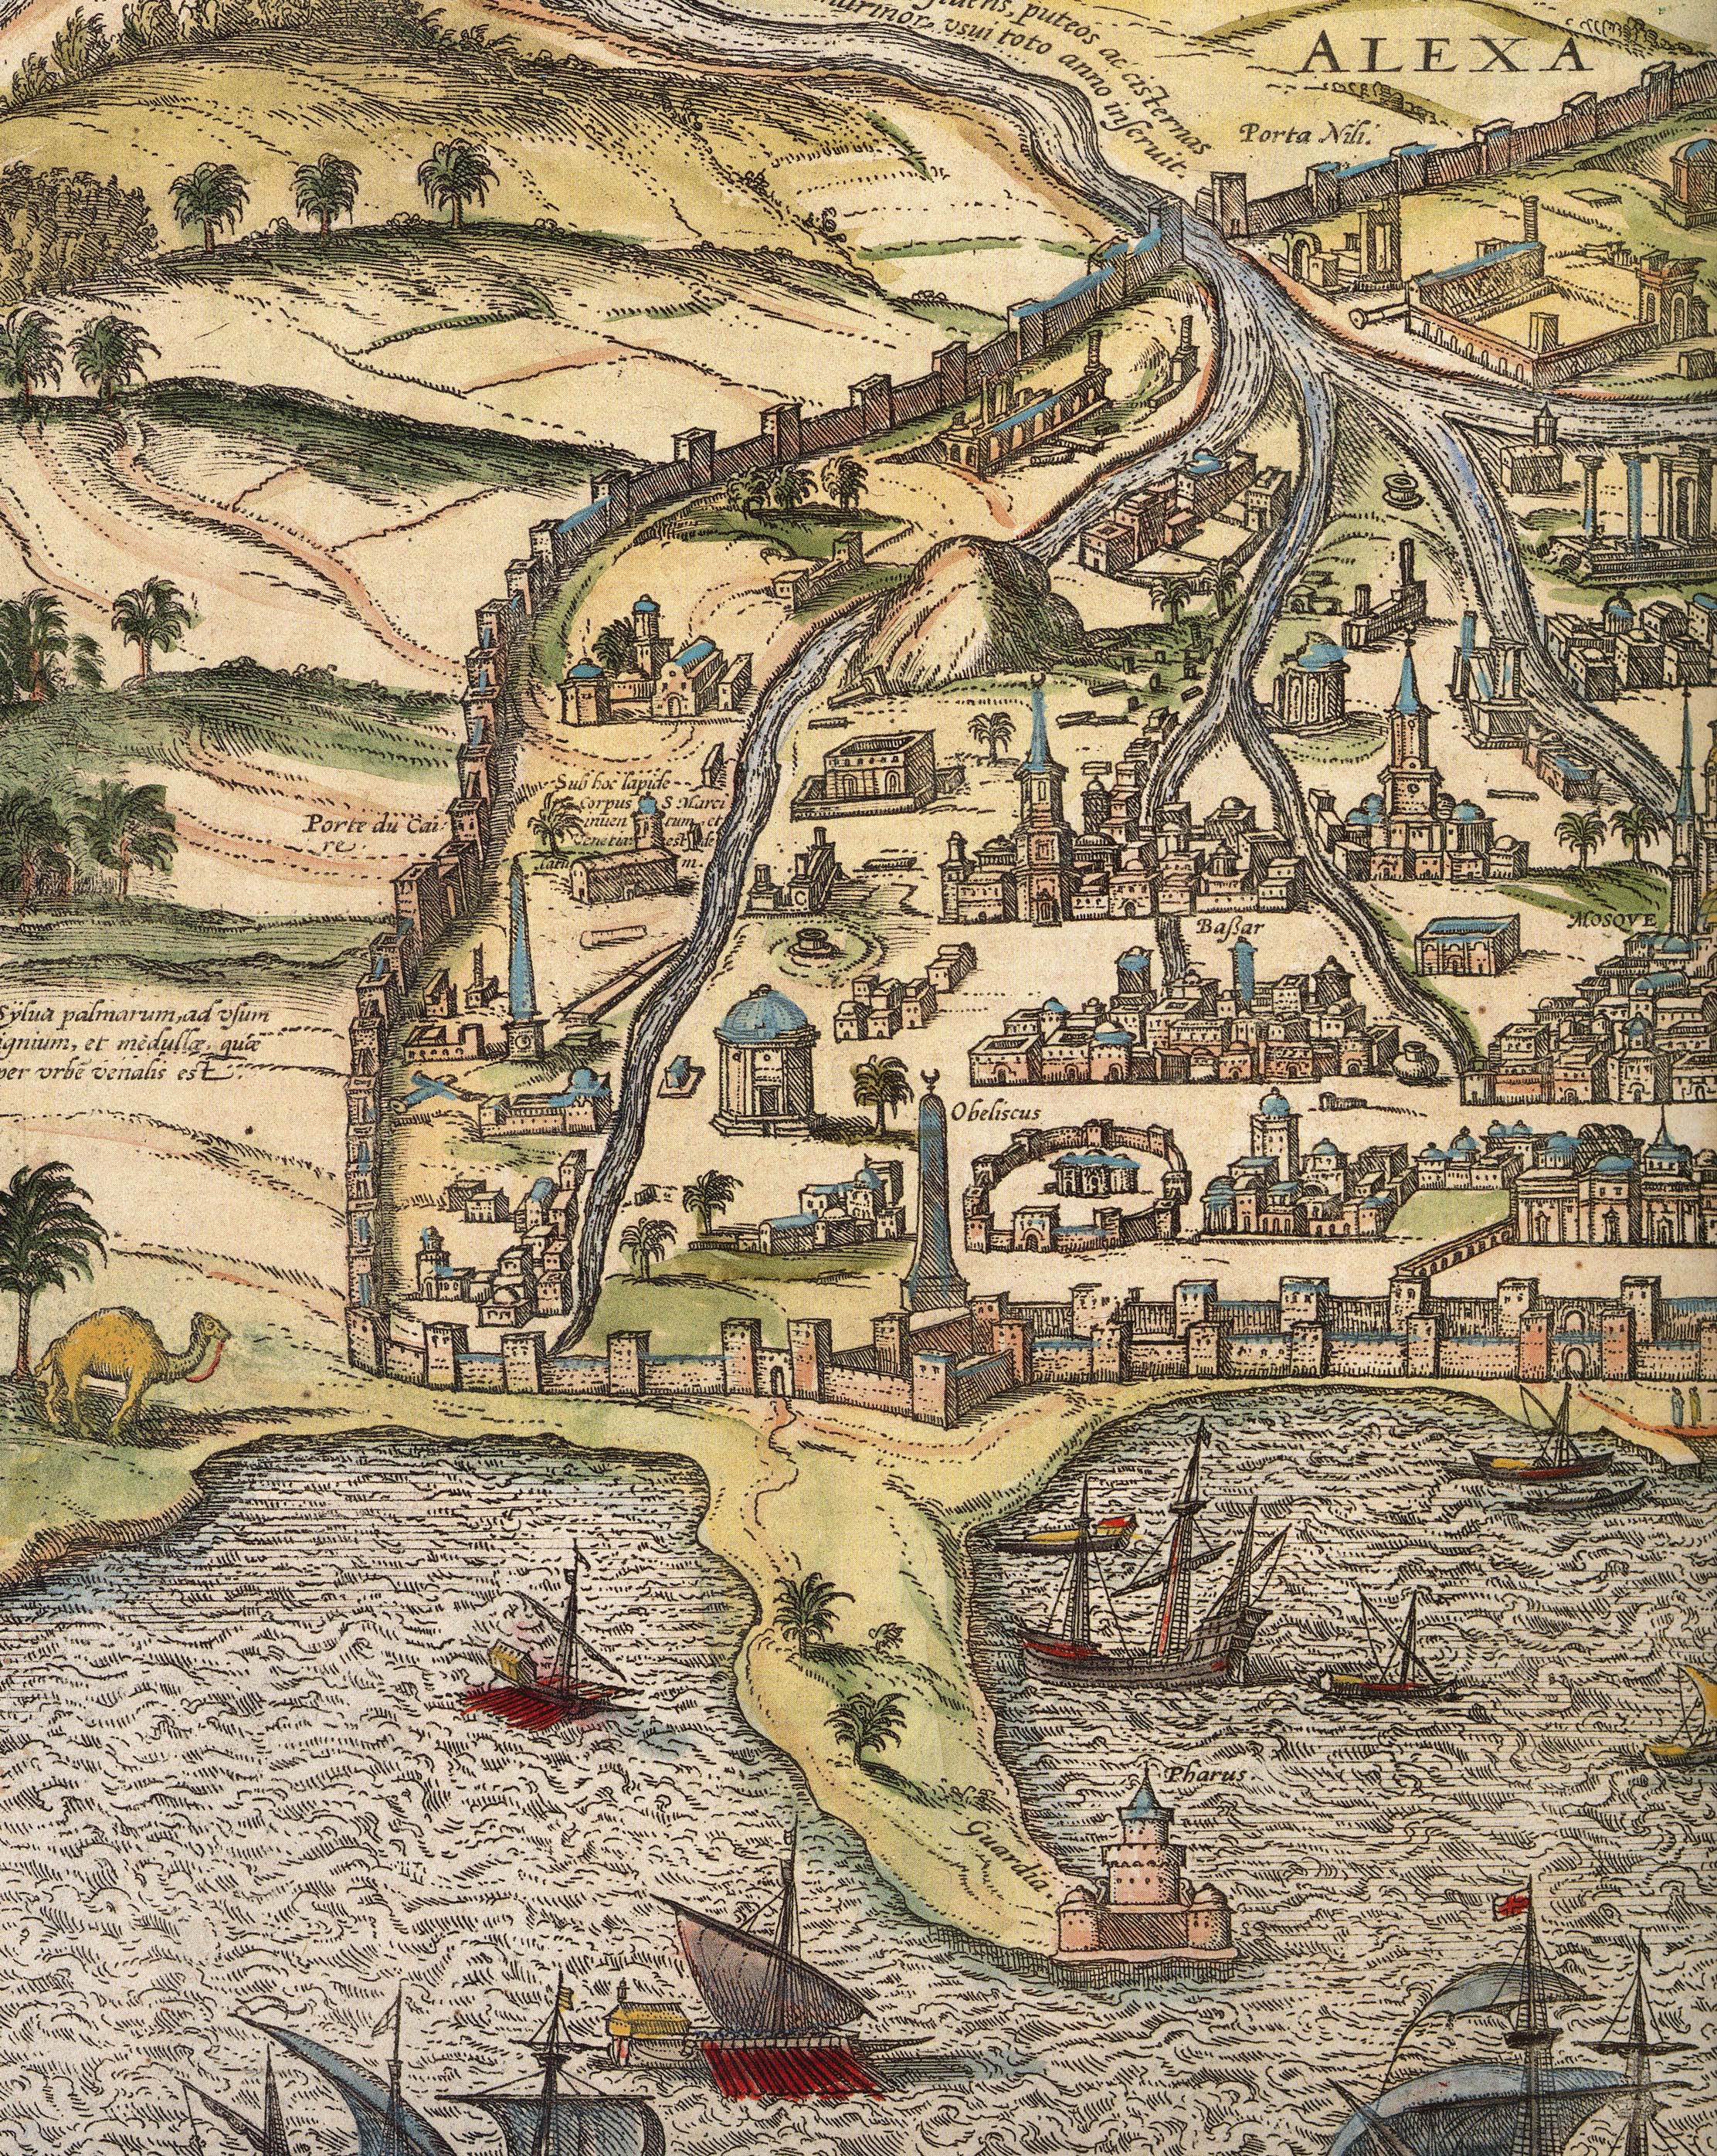
Alexandria
The Lighthouse of Alexandria was also doomed to be destroyed by earthquakes, but the bricks were used to construct the Citadel of Quaitbey. UWM professor Caroline Seymour-Jorn donated her photo collections to the AGSL , including several photos from 1996 visit to Egypt of the citadel.
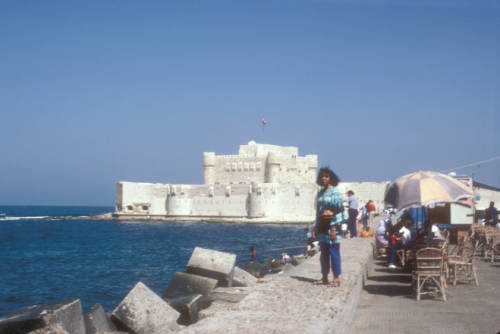
Click the link to see this photo of Alexandria, Egypt: View of Quaitbey Citadel courtesy of Caroline Seymour-Jorn in our Digital Collections
The Roman Empire adopted the Greek pharos and began building them across Italy and the Empire, including the Tower of Hercules in A Coruña, Spain and Dover. The lighthouse in A Coruña is still functional, but many Roman lighthouses were abandoned in the Middle Ages and replaced. As travel and trade by sea became more and more prevalent, the need for lighthouses grew.
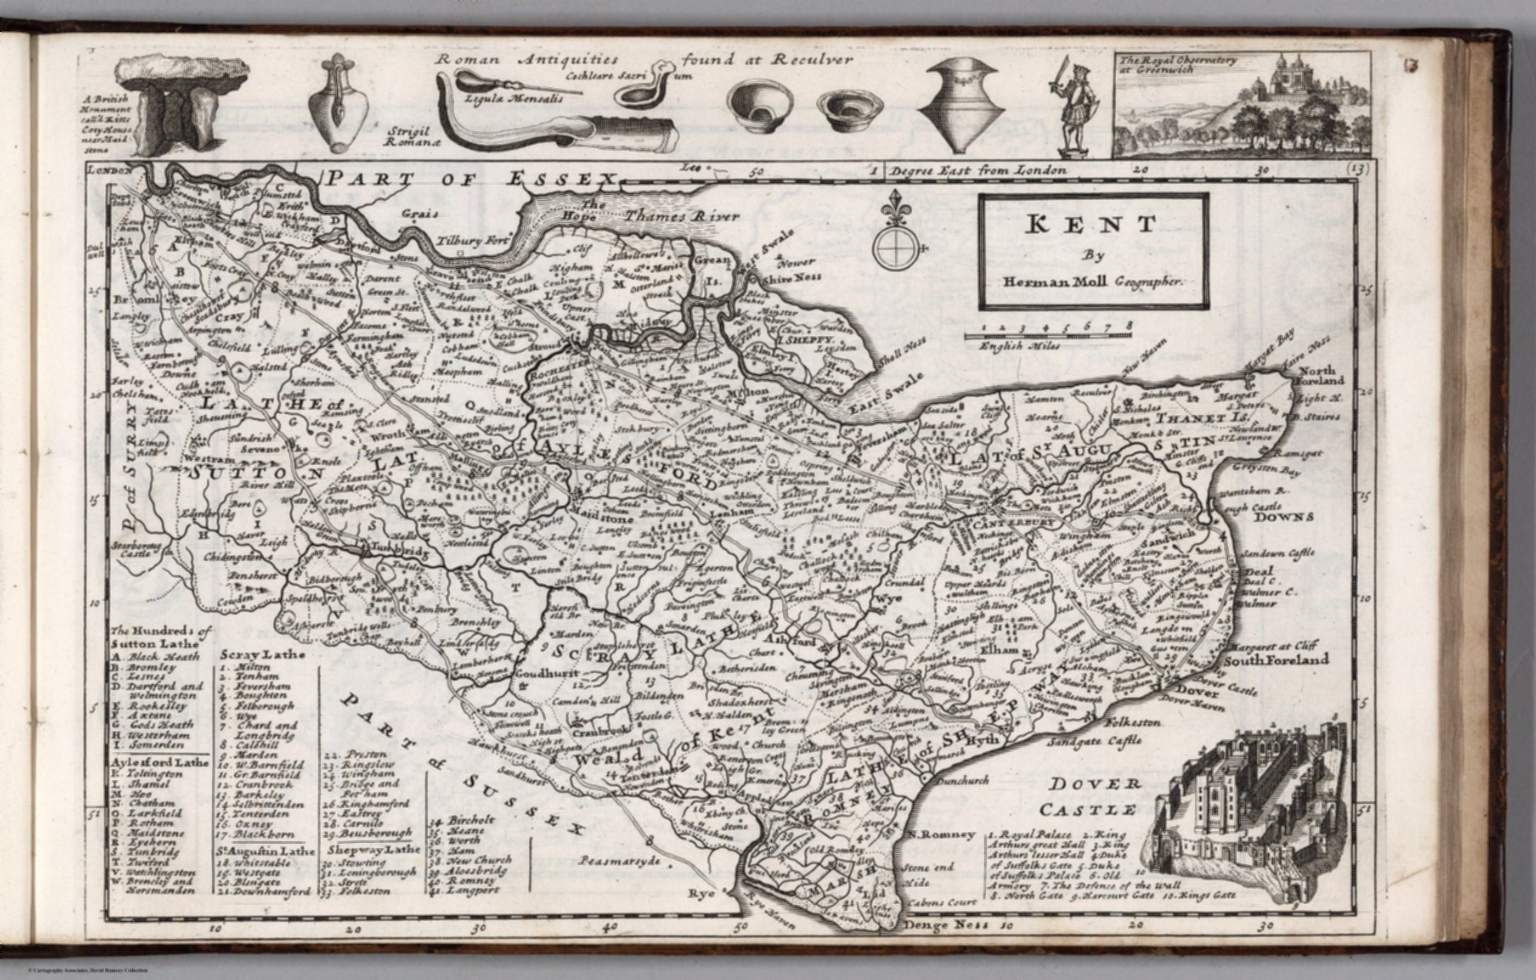
Click the link to see the 1724 Map of Kent by Herman Moll in our Digital Collections 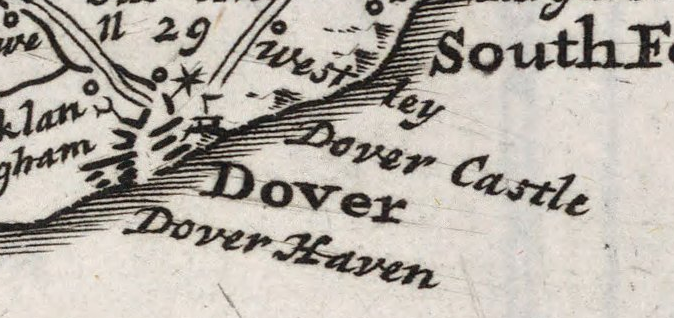
Dover, lighthouse indicated pictorially
Most lighthouses constructed during this time are no longer operational, but the Hook lighthouse in Ireland continues to be used. The building has been in operation for over 800 years and is now managed by the Commissioners of Irish Lights. Lighthouses in England were privately owned and operated during the Middle Ages and beyond. Because there was no regulation or standard policy, lighthouse keepers began to abuse their posts, stealing ship cargo and demanding payment from sailors. This problem became so pervasive that the Lighthouse Act of 1836 was passed in the hopes of making coasts safer for ships coming to port.
In the 18th century, lighthouse construction advanced to match the needs of a growing transatlantic trade. Bigger, better lighthouses were being built and were now being used as more than way markers; they could warn incoming ships and regulate boat traffic. In 1716, the first American lighthouse was built on the Boston Harbor; many more began to spring up in the subsequent years, and in 1851 Congress passed an act to facilitate the creation of the US Lighthouse Board, which would eventually be dissolved to make room for the Lighthouse Service. The AGSL has many of the Service’s records, including records of their history, finances, regulations, and buoyage and lighthouse systems.
Click the link to see the Boston Light Referenced on 1889 Map of Boston Harbor in our Digital Collections
With lighthouses increased utility and presence on coastlines, their representation on maps began to shift. Instead of being just illustrations or seamarks, lighthouses began to take on a new navigational importance. Diagrams of lighthouses, recordings of the range of their lights, and more exact buoy locations became a common part of maps.
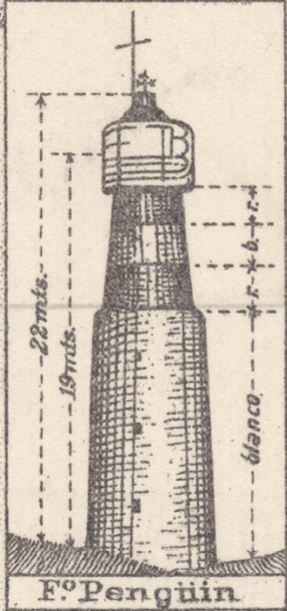
Click the link to see Lighthouse detail from 1926 map of Puerto Deseado, Argentina in our Digital Collections 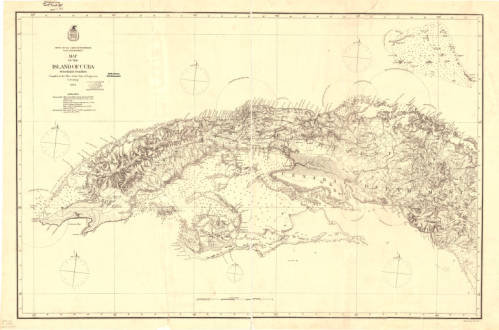
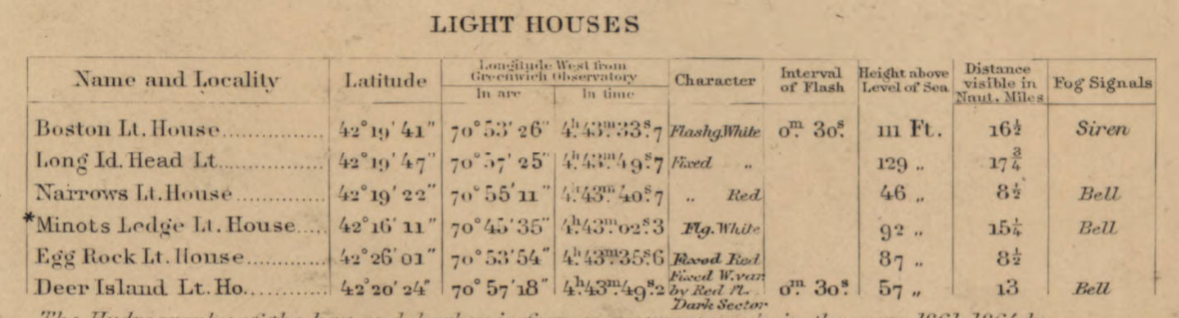
Click the link to see the Map with Lighting information for Cuba 1874 in our Digital Collections 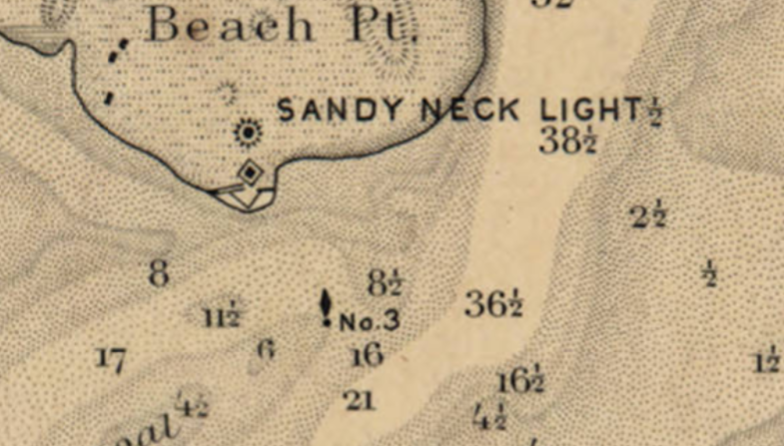
Click the link to see the Lighthouse and Buoy on Map of Barnstable Harbor, Massachusetts 1880 in our Digital Collections 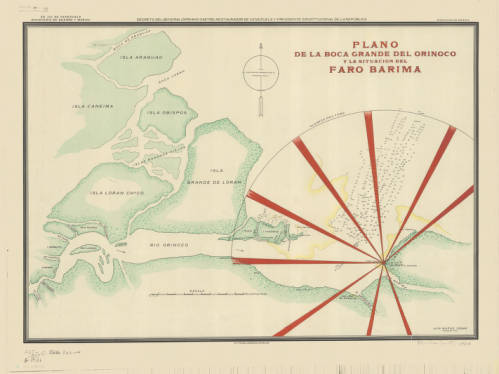
Click the link to see the Lighthouse depicted in 1906 Map of Rio Barima, Venezuela in our Digital Collections
Now lighthouses have a romantic air as well as a practical use; writers and artists work to capture the lighthouse. To the Lighthouse by Virginia Woolf comes to mind. And here, in Milwaukee, where the AGSL lives, we have our share of lighthouses on our Great Lake Michigan.
Polar Exploration and the Hollow Earth
by Sam Balistreri-Daum
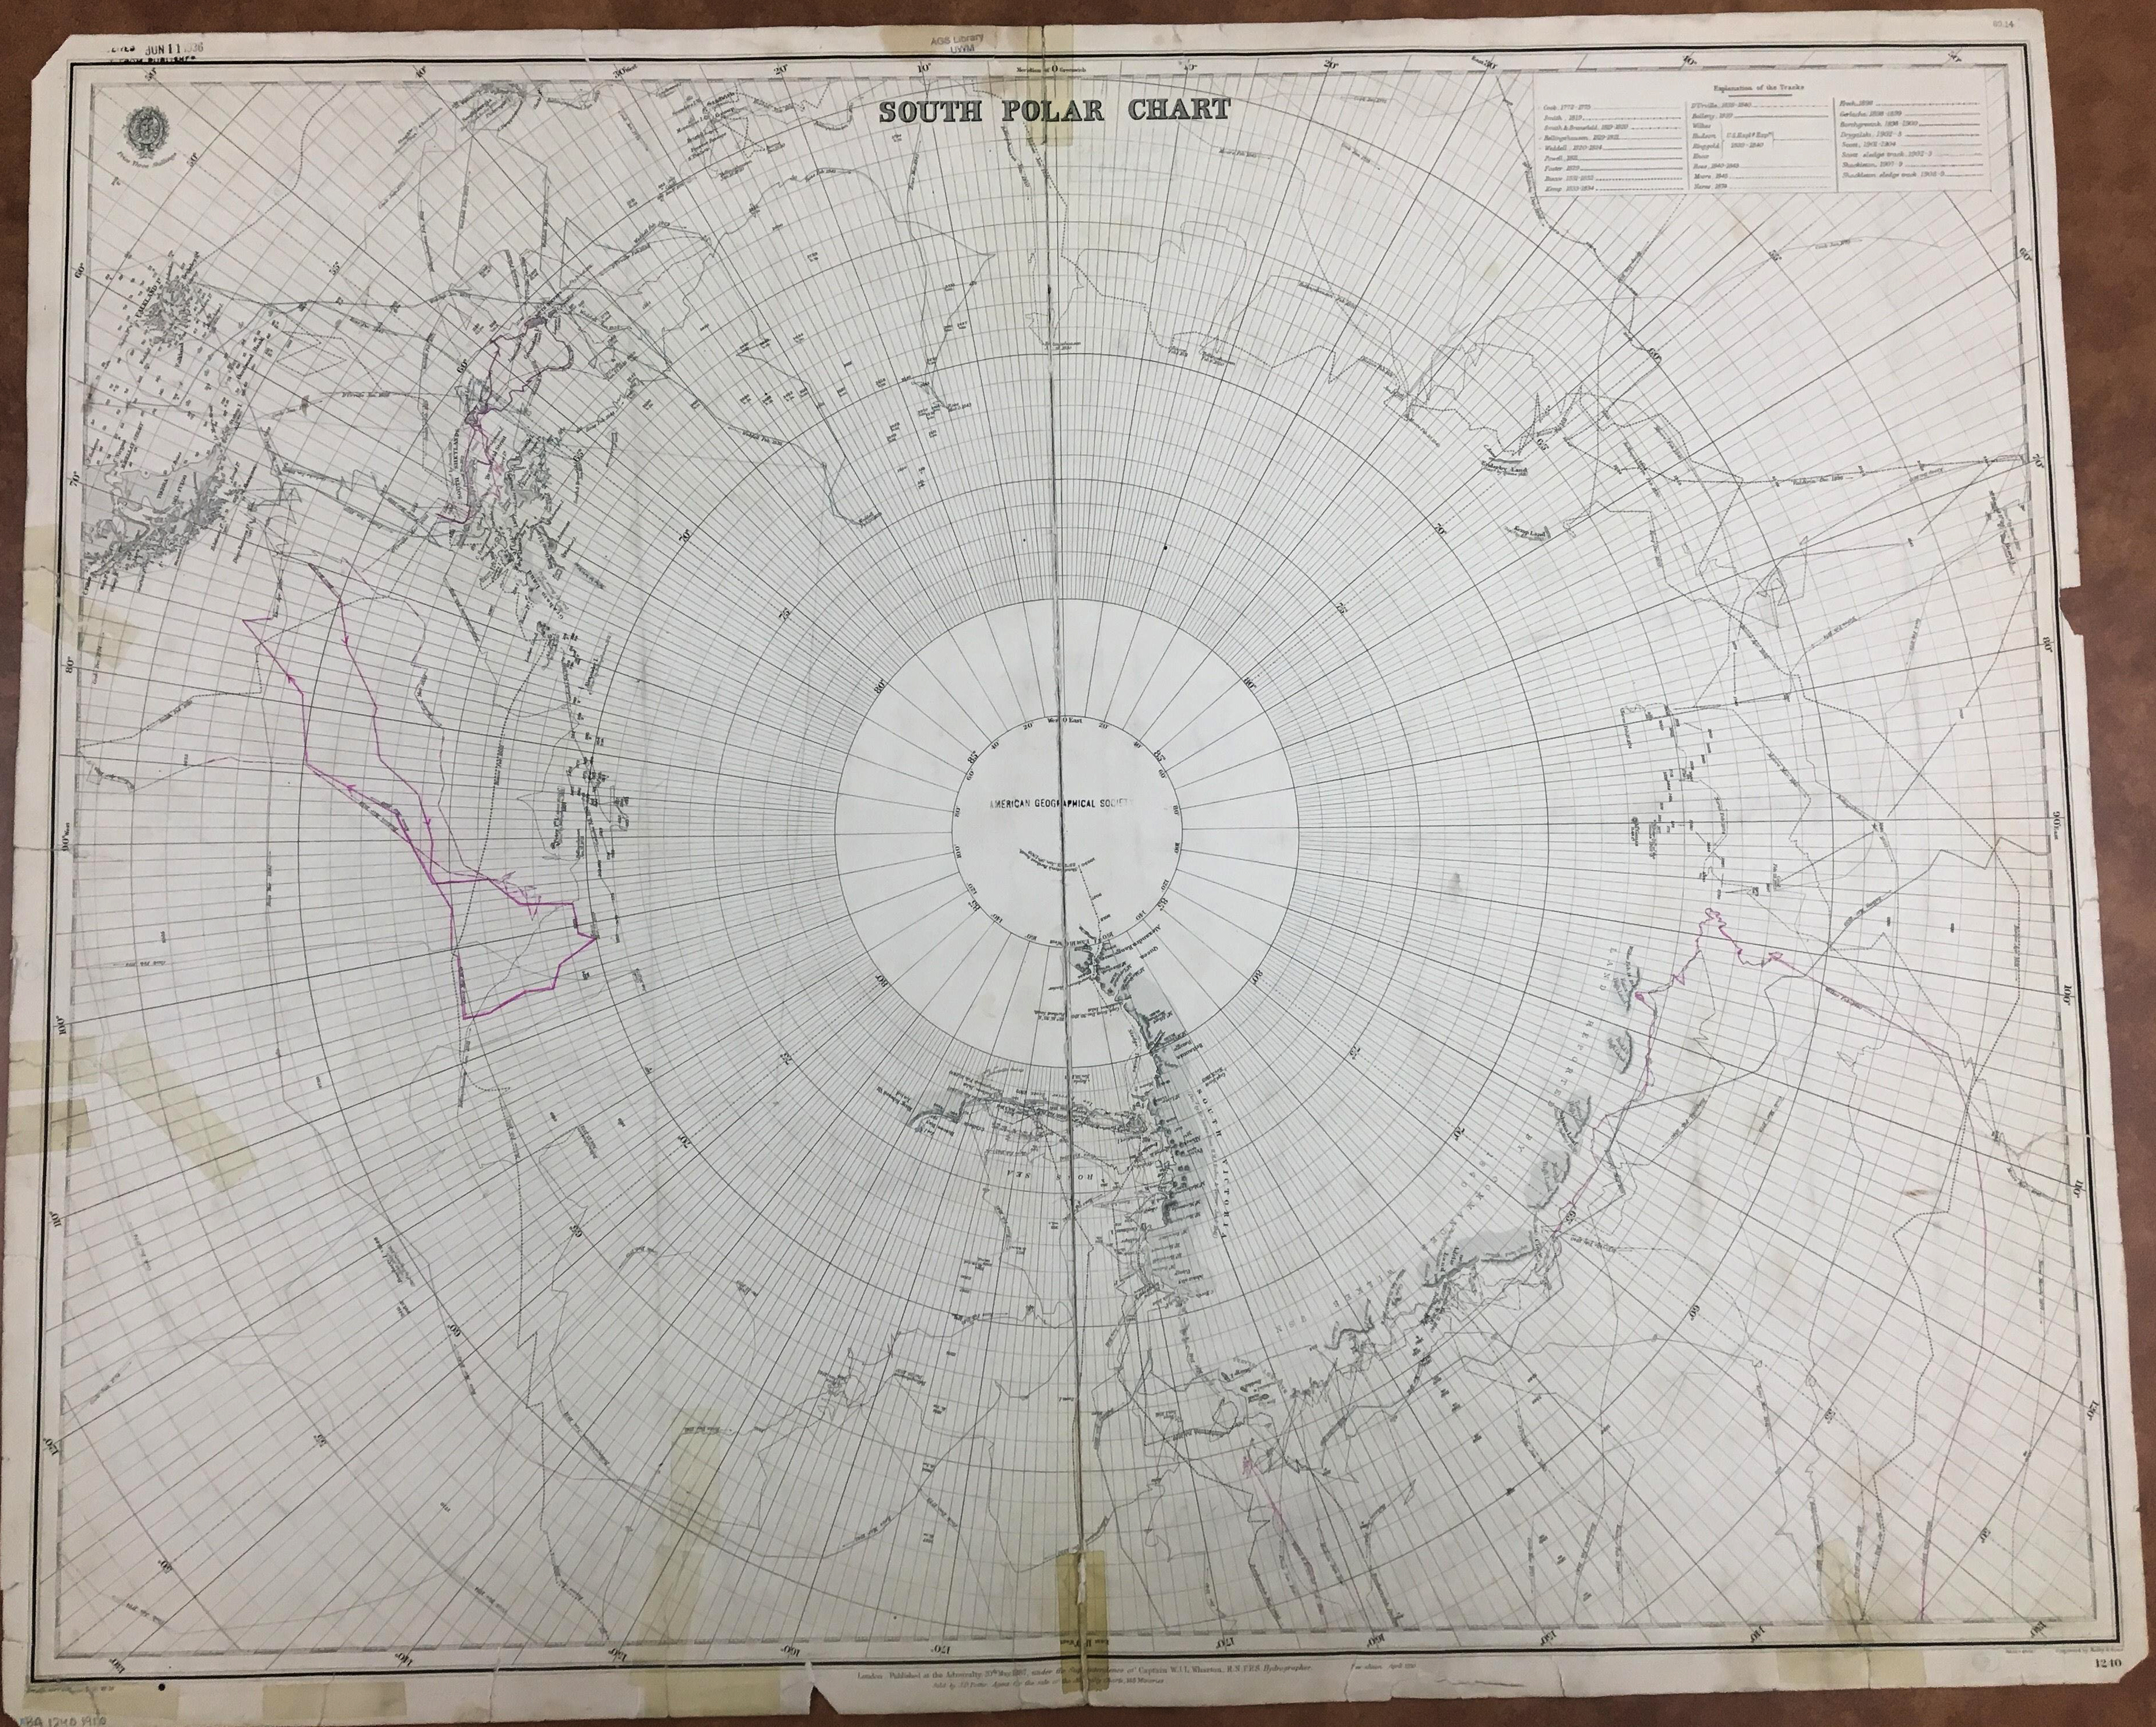
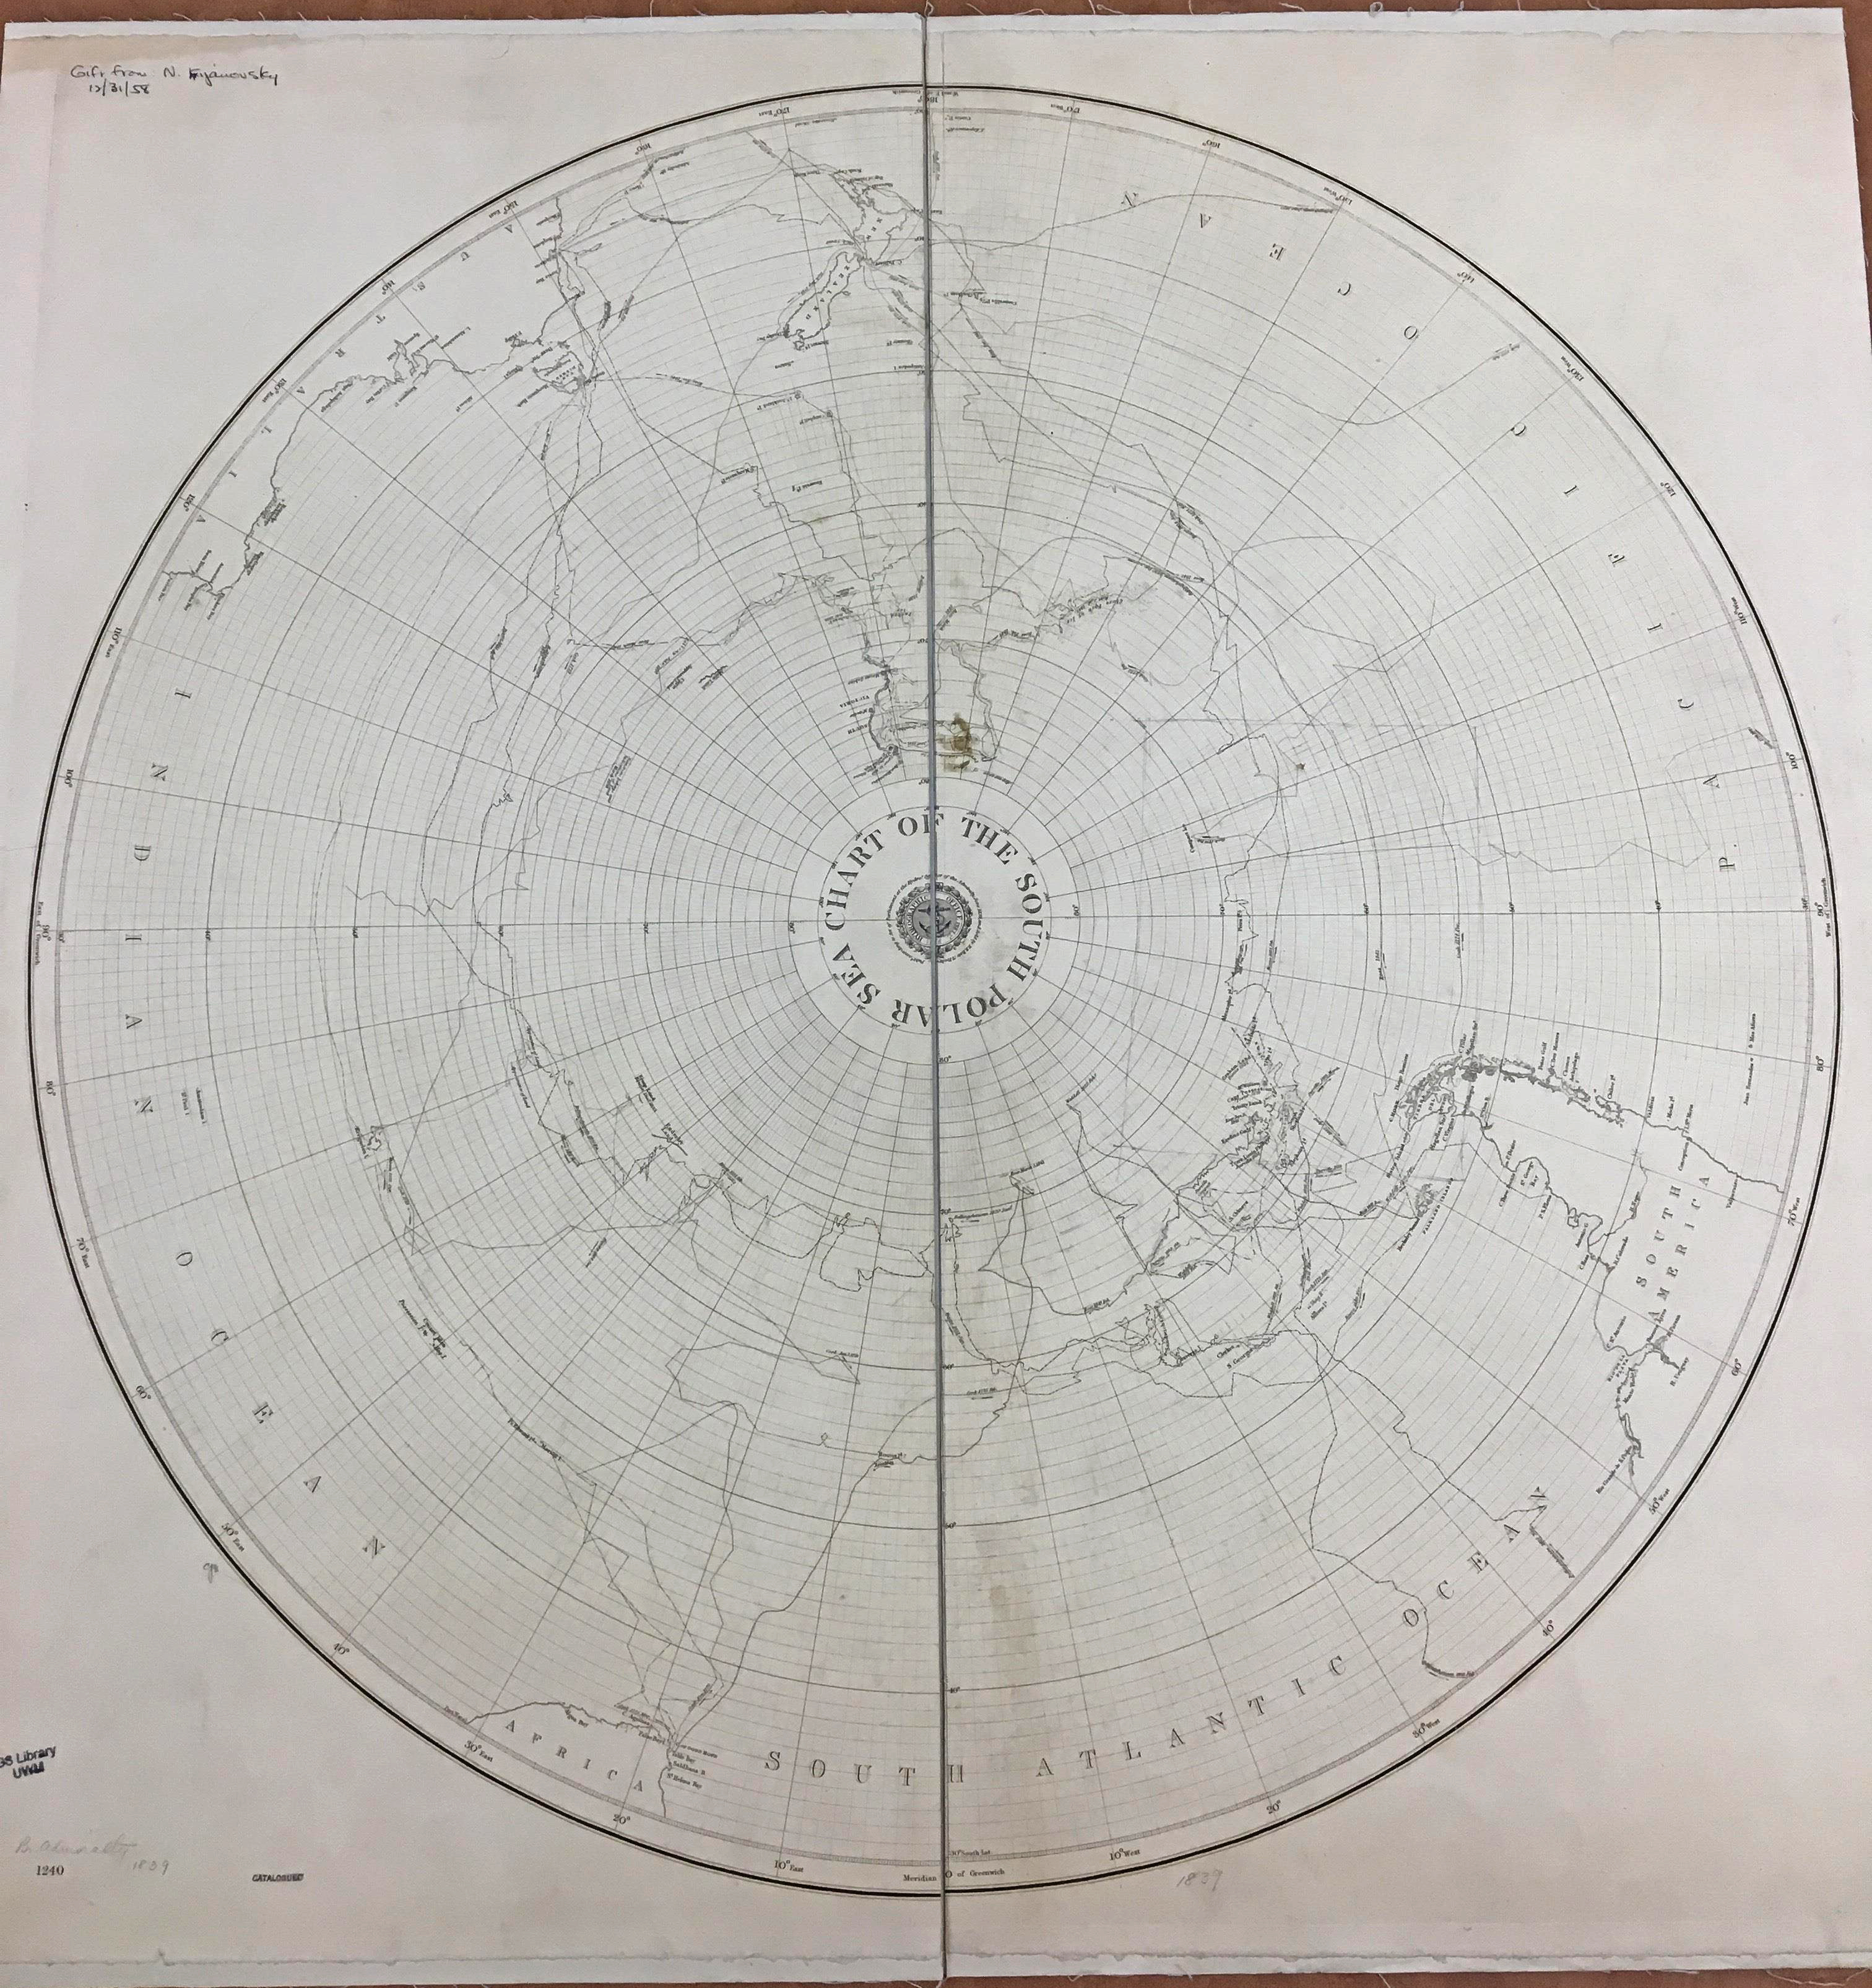
As I continued to catalog the British Admiralty charts this fall I was impressed by the way the AGS Library Nautical Chart collection in many ways shows the progress of exploration, especially in those last frontiers of the planet Earth, the Arctic and Antarctic Polar Regions. In today’s age of Google Maps and satellite imagery it becomes hard for us to imagine a time when every corner of the Earth was not known or explored. It still isn’t! Just think of the deepest parts of the oceans. So I decided I needed to learn more about what it was like in a time when polar exploration was at its most fervent if not urgent and theories, however crazy, were numerous as to what could be discovered at the poles.
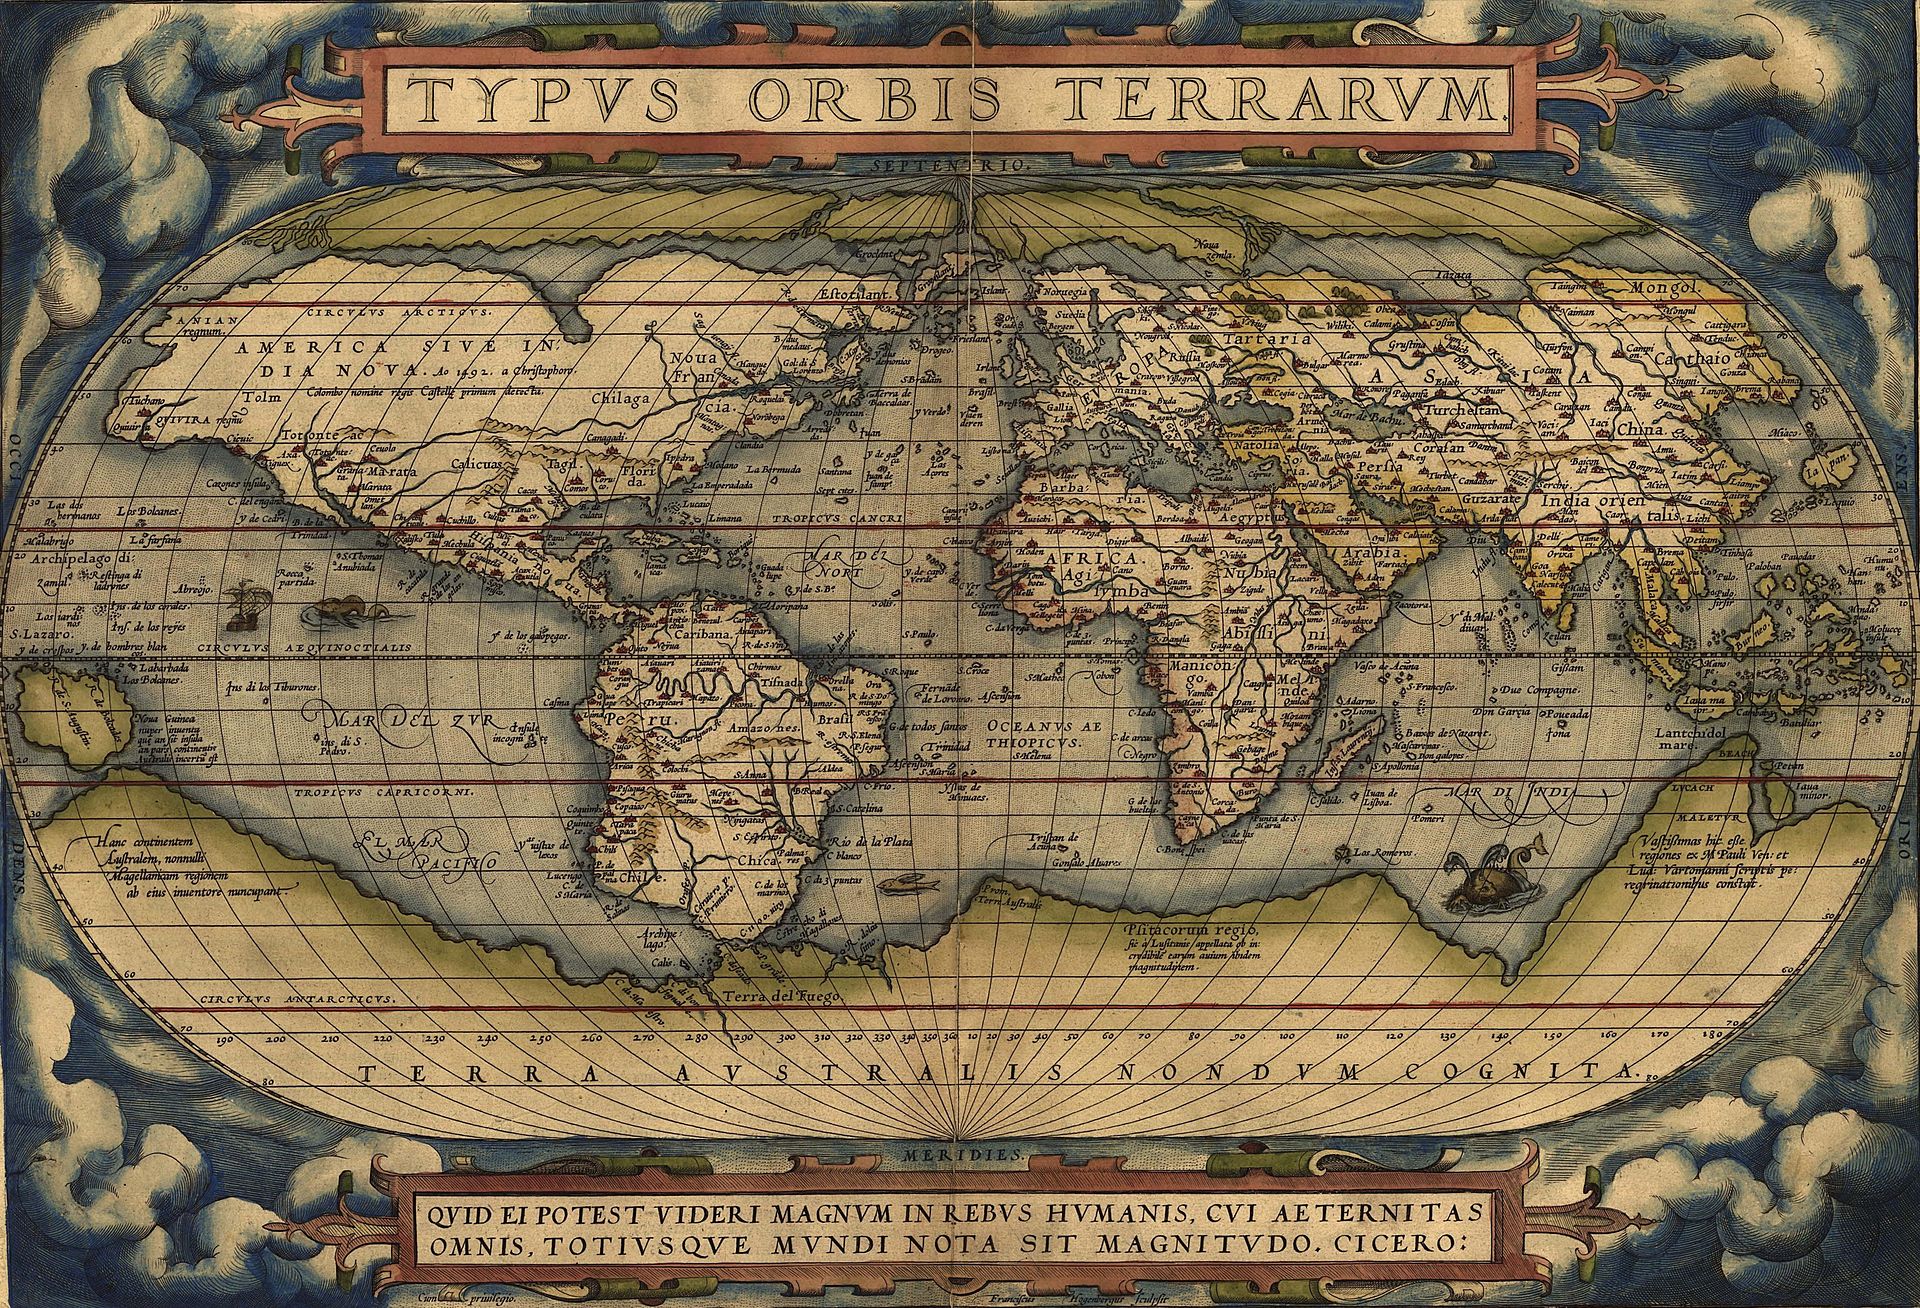
John Blake, in The Sea Chart: The Illustrated History of Nautical Maps and Navigational Charts (2016) gives a concise summary of the attempts to explore and reasons for the exploration of both poles. Exploration of the northern Polar Regions has a longer history than that of the South Polar Region, which is due to the “discovery” of America and the obsession of European explorers to find a Northwest Passage to Asia and India. Although a Northwest Passage does technically exist (during certain seasons), it is not a viable and profitable trade route. Interestingly, much of the exploration of both Arctic and Antarctic regions was made possible by an increased availability of British Naval vessels in the period following the Napoleonic Wars. Many of the names of ships and personnel responsible for these voyages such as William Parry, Commodore John Ross, Captains George Lyon and Frederick Beechey and His Majesty’s Ships Victory, Investigator and Enterprise to name a few can be found on the British Admiralty charts in the AGS Library collection. The Antarctic region around the South Pole, though explored much later, inspired much anticipation and excitement among explorers and colonizers as many European nations had far-flung colonial empires. Many early world maps and atlases, including Ortelius’ Theatrum Orbis Terrarum (1570) depicted large continents at the poles, especially the massive “Terra Incognita Australis” in the South Polar Region. There was even speculation that this large southern continent would have a temperate climate and would be populated with indigenous plants, animals and people. Imagine that! Realistic attempts at coastal exploration of what is today Antarctica did not occur until the Mid-19th Century and was often a byproduct of whaling and seal hunting expeditions.
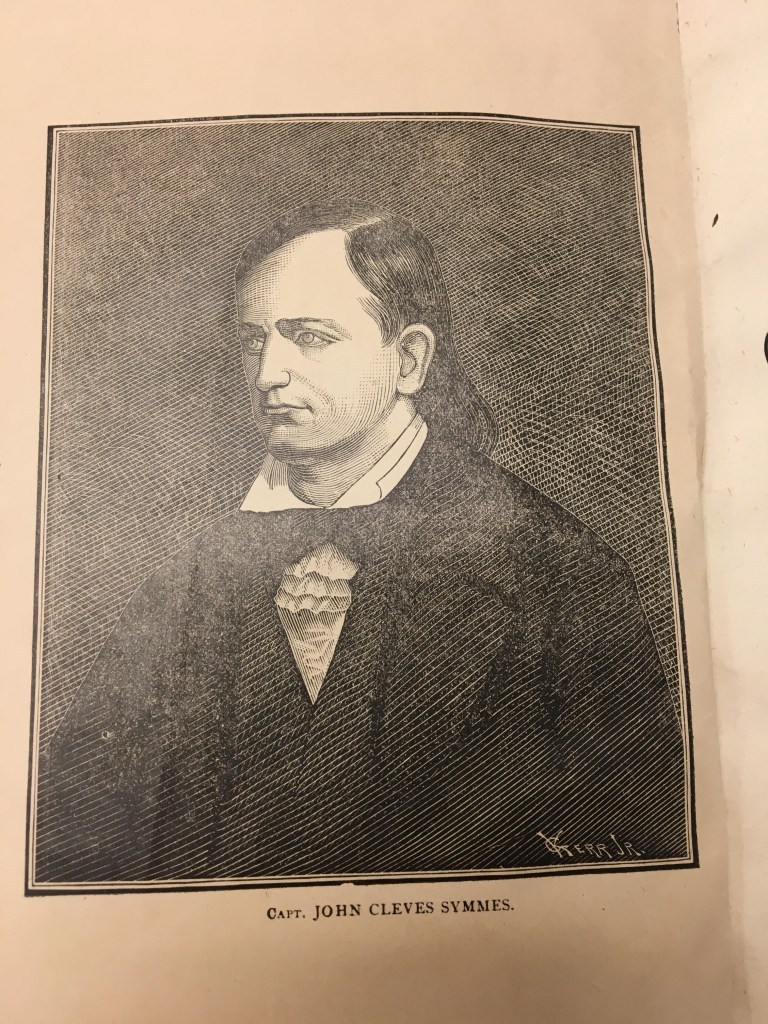
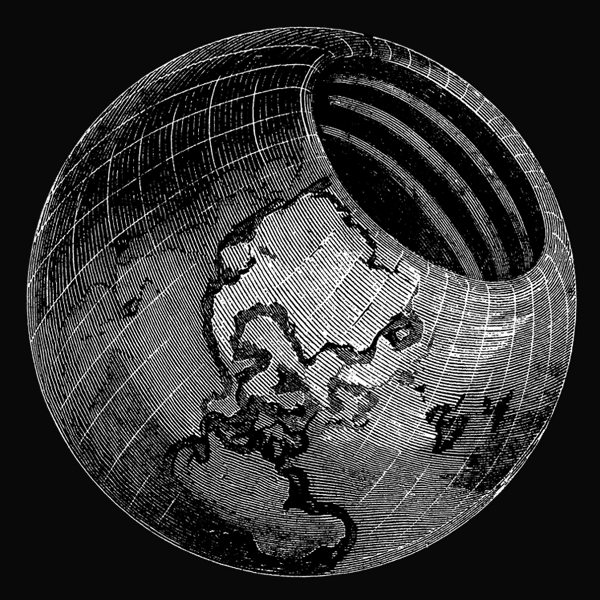
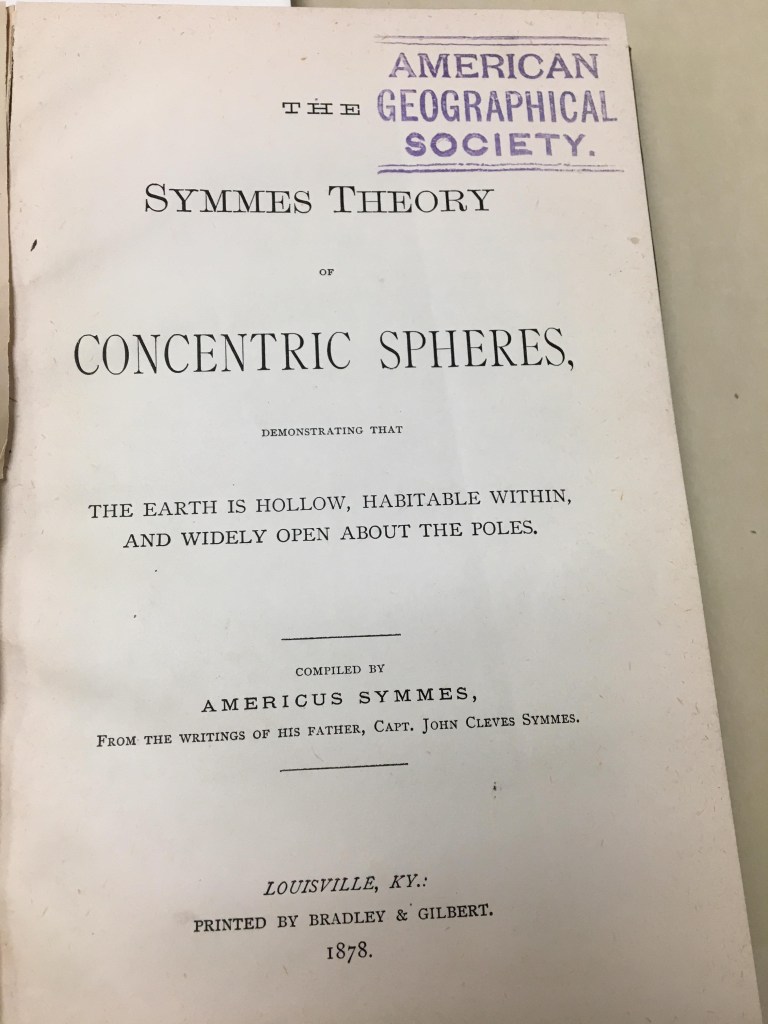
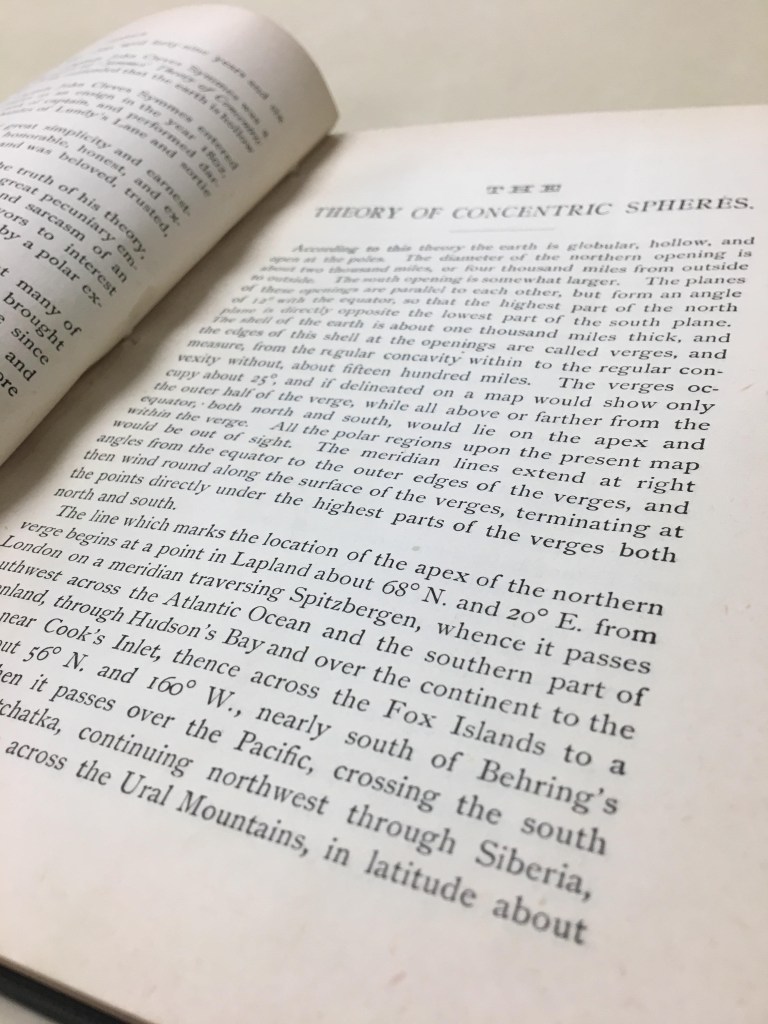
Remember how I said there were many theories about unexplored regions of Earth “however crazy”? Enter John Cleves Symmes (1780-1829), a military captain and veteran of the War of 1812. A timely listen to an episode of American history / comedy podcast The Dollop introduced me to Symmes and his theory. Symmes even spoke to the AGS in New York about his theory! Here at the AGSL we actually have a copy of The Symmes Theory of Concentric Spheres: Demonstrating That the Earth is Hollow, Habitable Within, and Widely Open about the Poles (1878) compiled by Symmes’ son Americus Symmes. They sure didn’t skimp on the title. The theory posits that the Earth is “globular, hollow, and open at the poles”, with a northern opening 2,000 miles in diameter and a southern opening that is “somewhat larger” (because why not, right?). The elder Symmes took his theory on the road, beginning in 1818 with an open letter calling for the exploration of the Arctic Polar Region to look for an opening, touring and lecturing until his death in 1829. Much like the speculation that a southern continent would have a temperate climate and be teeming with plant and animal life, the supposed hollow interior of the Earth according to Symmes would have a moderate climate and an abundance of flora and fauna. To Symmes and those convinced of his theory, the hollow Earth and its openings explained several phenomena including climate variation among various regions occupying the same latitude (for example temperate Europe vs. cold U.S. and Canada in winter), the Auroras (Borealis and Australis) and the counterintuitive migration patterns of various fish, bird and mammal species and groups of people. Want proof? Symmes claimed that looking at the example of Saturn’s Rings (discovered in 1610) proves that concentricity can exist. He also advanced the notion that not only Earth, but the rest of the planets in the solar system were probably hollow too. Including the sun! Needless to say Hollow Earth Theory doesn’t have much traction these days, except on the fringe where theories such as flat earth and the hollow moon (Aliens stole our moon and replaced it with a hollow one to spy on us?! Makes sense…) among others are alive and well.
The AGS Library is home not only to maps like the nautical charts that I have been working on cataloging during my time here, but a multitude of books, atlases and print materials that can be just as surprising as discovering the Earth is hollow.
Sources:
Blake, John. The Sea Chart: The Illustrated History of Nautical Maps and Navigational Charts. Conway/Bloomsbury, 2016.
Symmes, John Cleves. The Symmes Theory of Concentric Spheres: Demonstrating that the Earth is Hollow, Habitable Within, and Widely Open about the Poles/ compiled by Americus Symmes from the writings of his father, Capt. John Cleves Symmes. Bradley & Gilbert, 1878.
“Hollow Earth.” The Dollop from SoundCloud, 14 May 2015, https://soundcloud.com/the-dollop/80-the-hollow-earth
French influence on US land development
by Sam Balistreri-Daum
A couple months back, while cataloging the British Admiralty charts in our nautical charts collection, I noticed along the coast and riverbanks of Georgetown, Guyana (then British Guyana) from 1938 and 1939 a series of parallel lines running perpendicular to the shores with names written between each line.
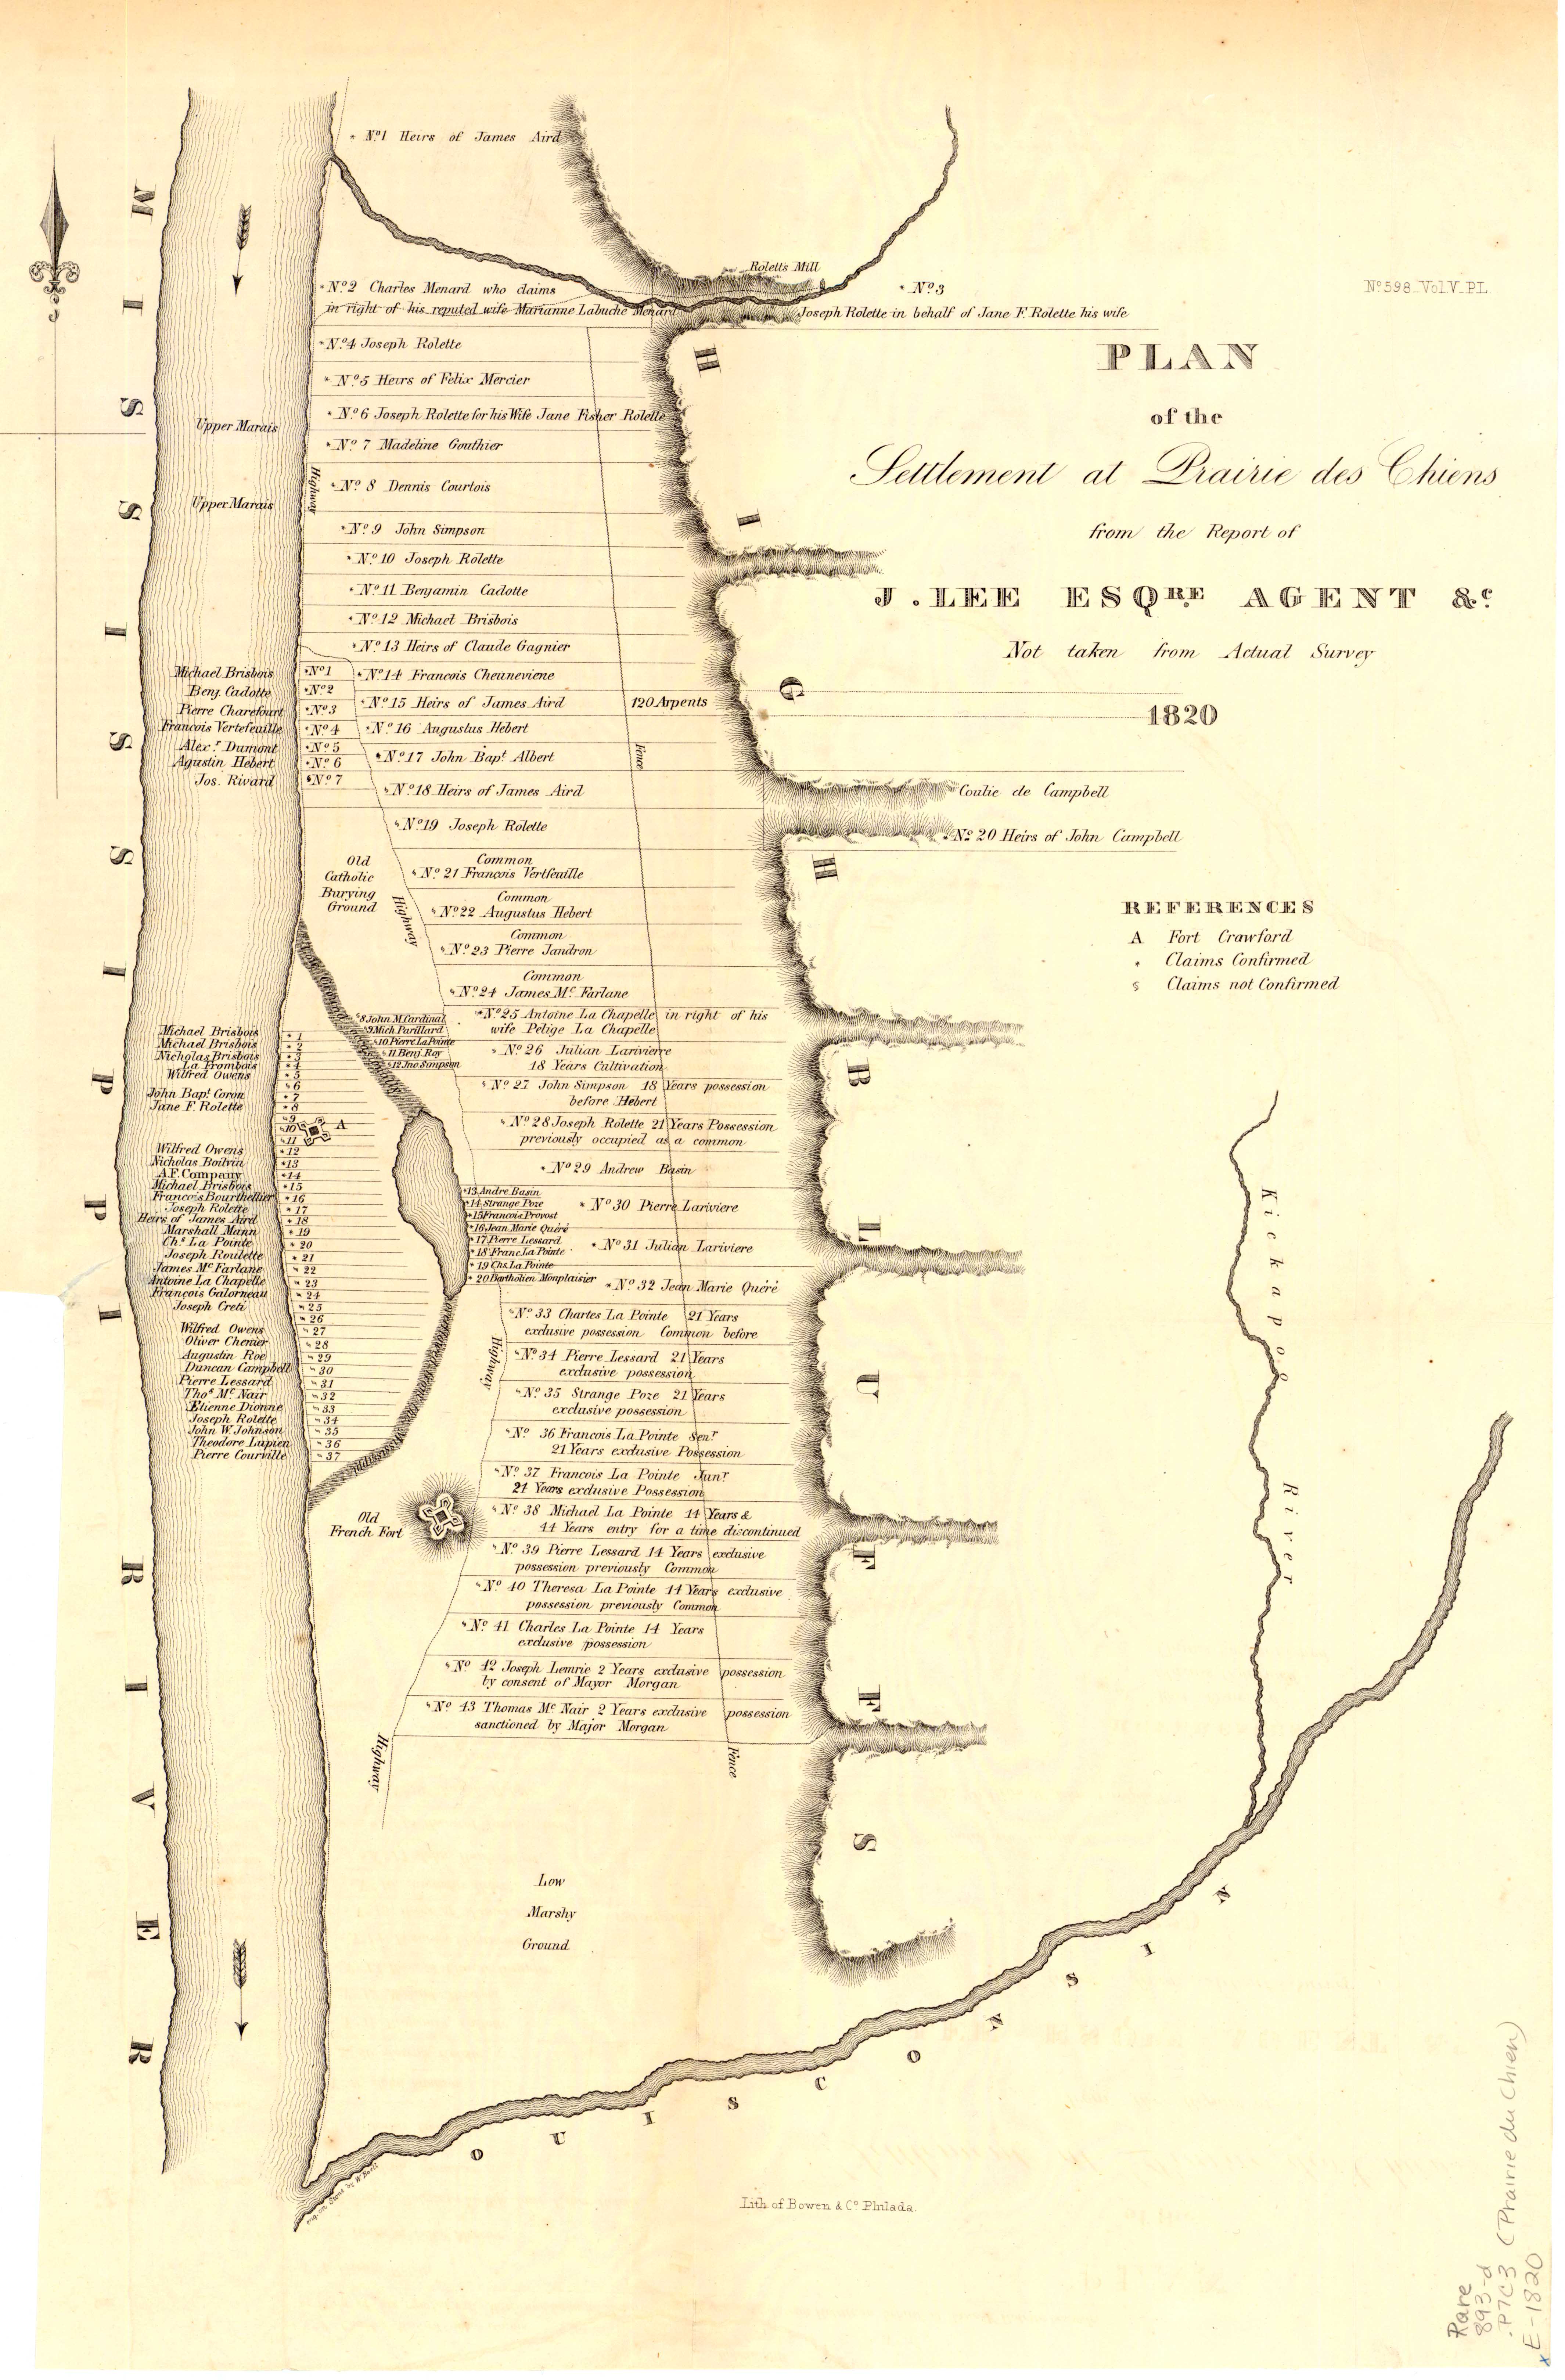
The long, narrow strips of land depicted on these 20th Century British charts are actually an interesting form of human geography called “long lots” or “ribbon farms” that come from the semi-feudal seigneurial system used by the French to administer their agricultural land in the colonies of North and South America. In this system, families would farm long narrow strips of land and pay rent under an agreement with the local seigneur or lord. The main advantage for farmers under this system was waterfront access for transportation and living in close proximity to neighboring farms while still having plenty of land. Some long lots were a few hundred feet wide while being miles deep. While the system was relatively outdated and was not always administratively maintained in the New World (especially once territory came under the control of another government such as the British), we can still see evidence of long lots on maps throughout the 19th and 20th Centuries and even in today’s satellite imagery. In the AGS Library Digital Map Collection it did not take long to find examples in both New Orleans (1884) and Prairie du Chien (1820) to find more examples of long lots:
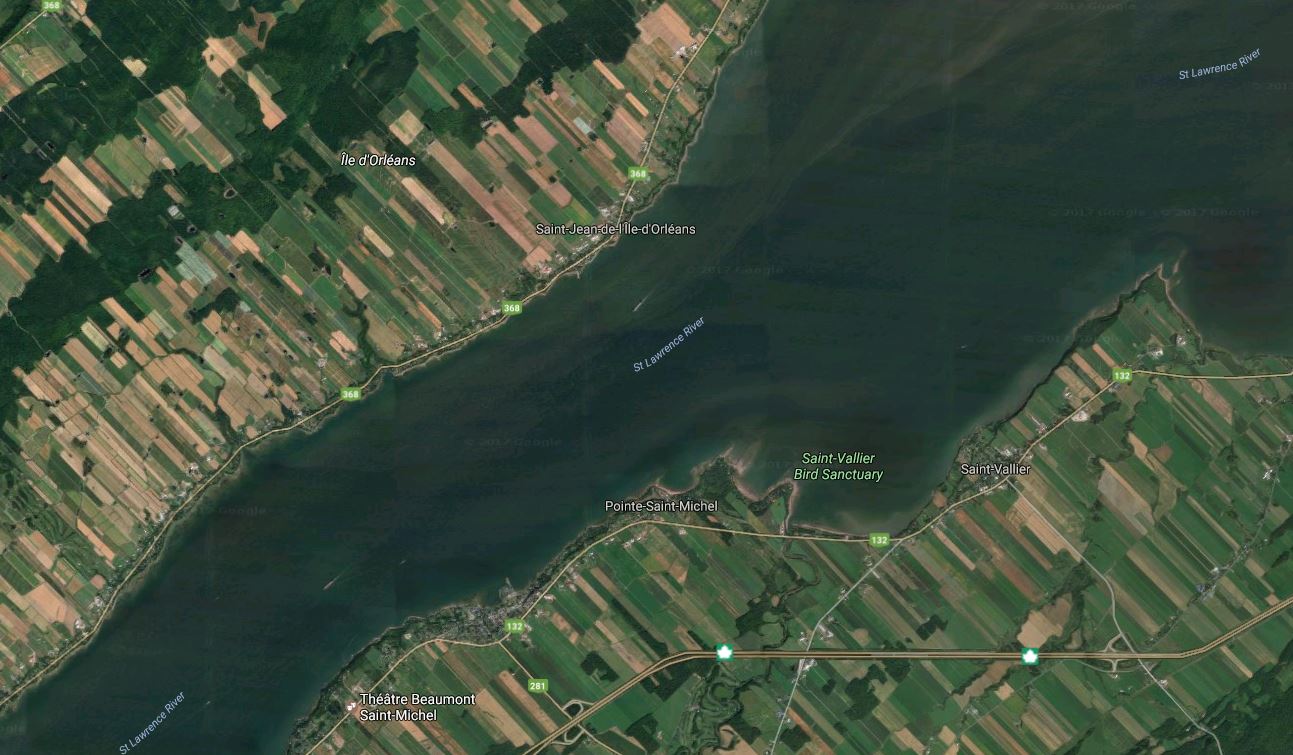
Long lots are even visible today in satellite imagery near Quebec City along the St. Lawrence River. This image was taken from Google Maps:
These maps show us just one example of the many things that maps can tell us about our world and about ourselves. These maps and many more are available at the AGS Library and online in the digital collections. If you’d like to read more about long lots and the seignieurial system, the following websites were useful in gathering additional information for this post:
Michigan State Univeristy: Long Lots: How they came to be:
http://geo.msu.edu/extra/geogmich/long_lots.html
Wikipeida.org: “Ribbon Farm”:
https://en.wikipedia.org/wiki/Ribbon_farm
View the New Orleans map in the AGS Library Digital Map Collection
View the Prairie du Chien map in the AGS Library Digital Map Collection
Cartographic Craftsmanship
by Sam Balistreri-Daum
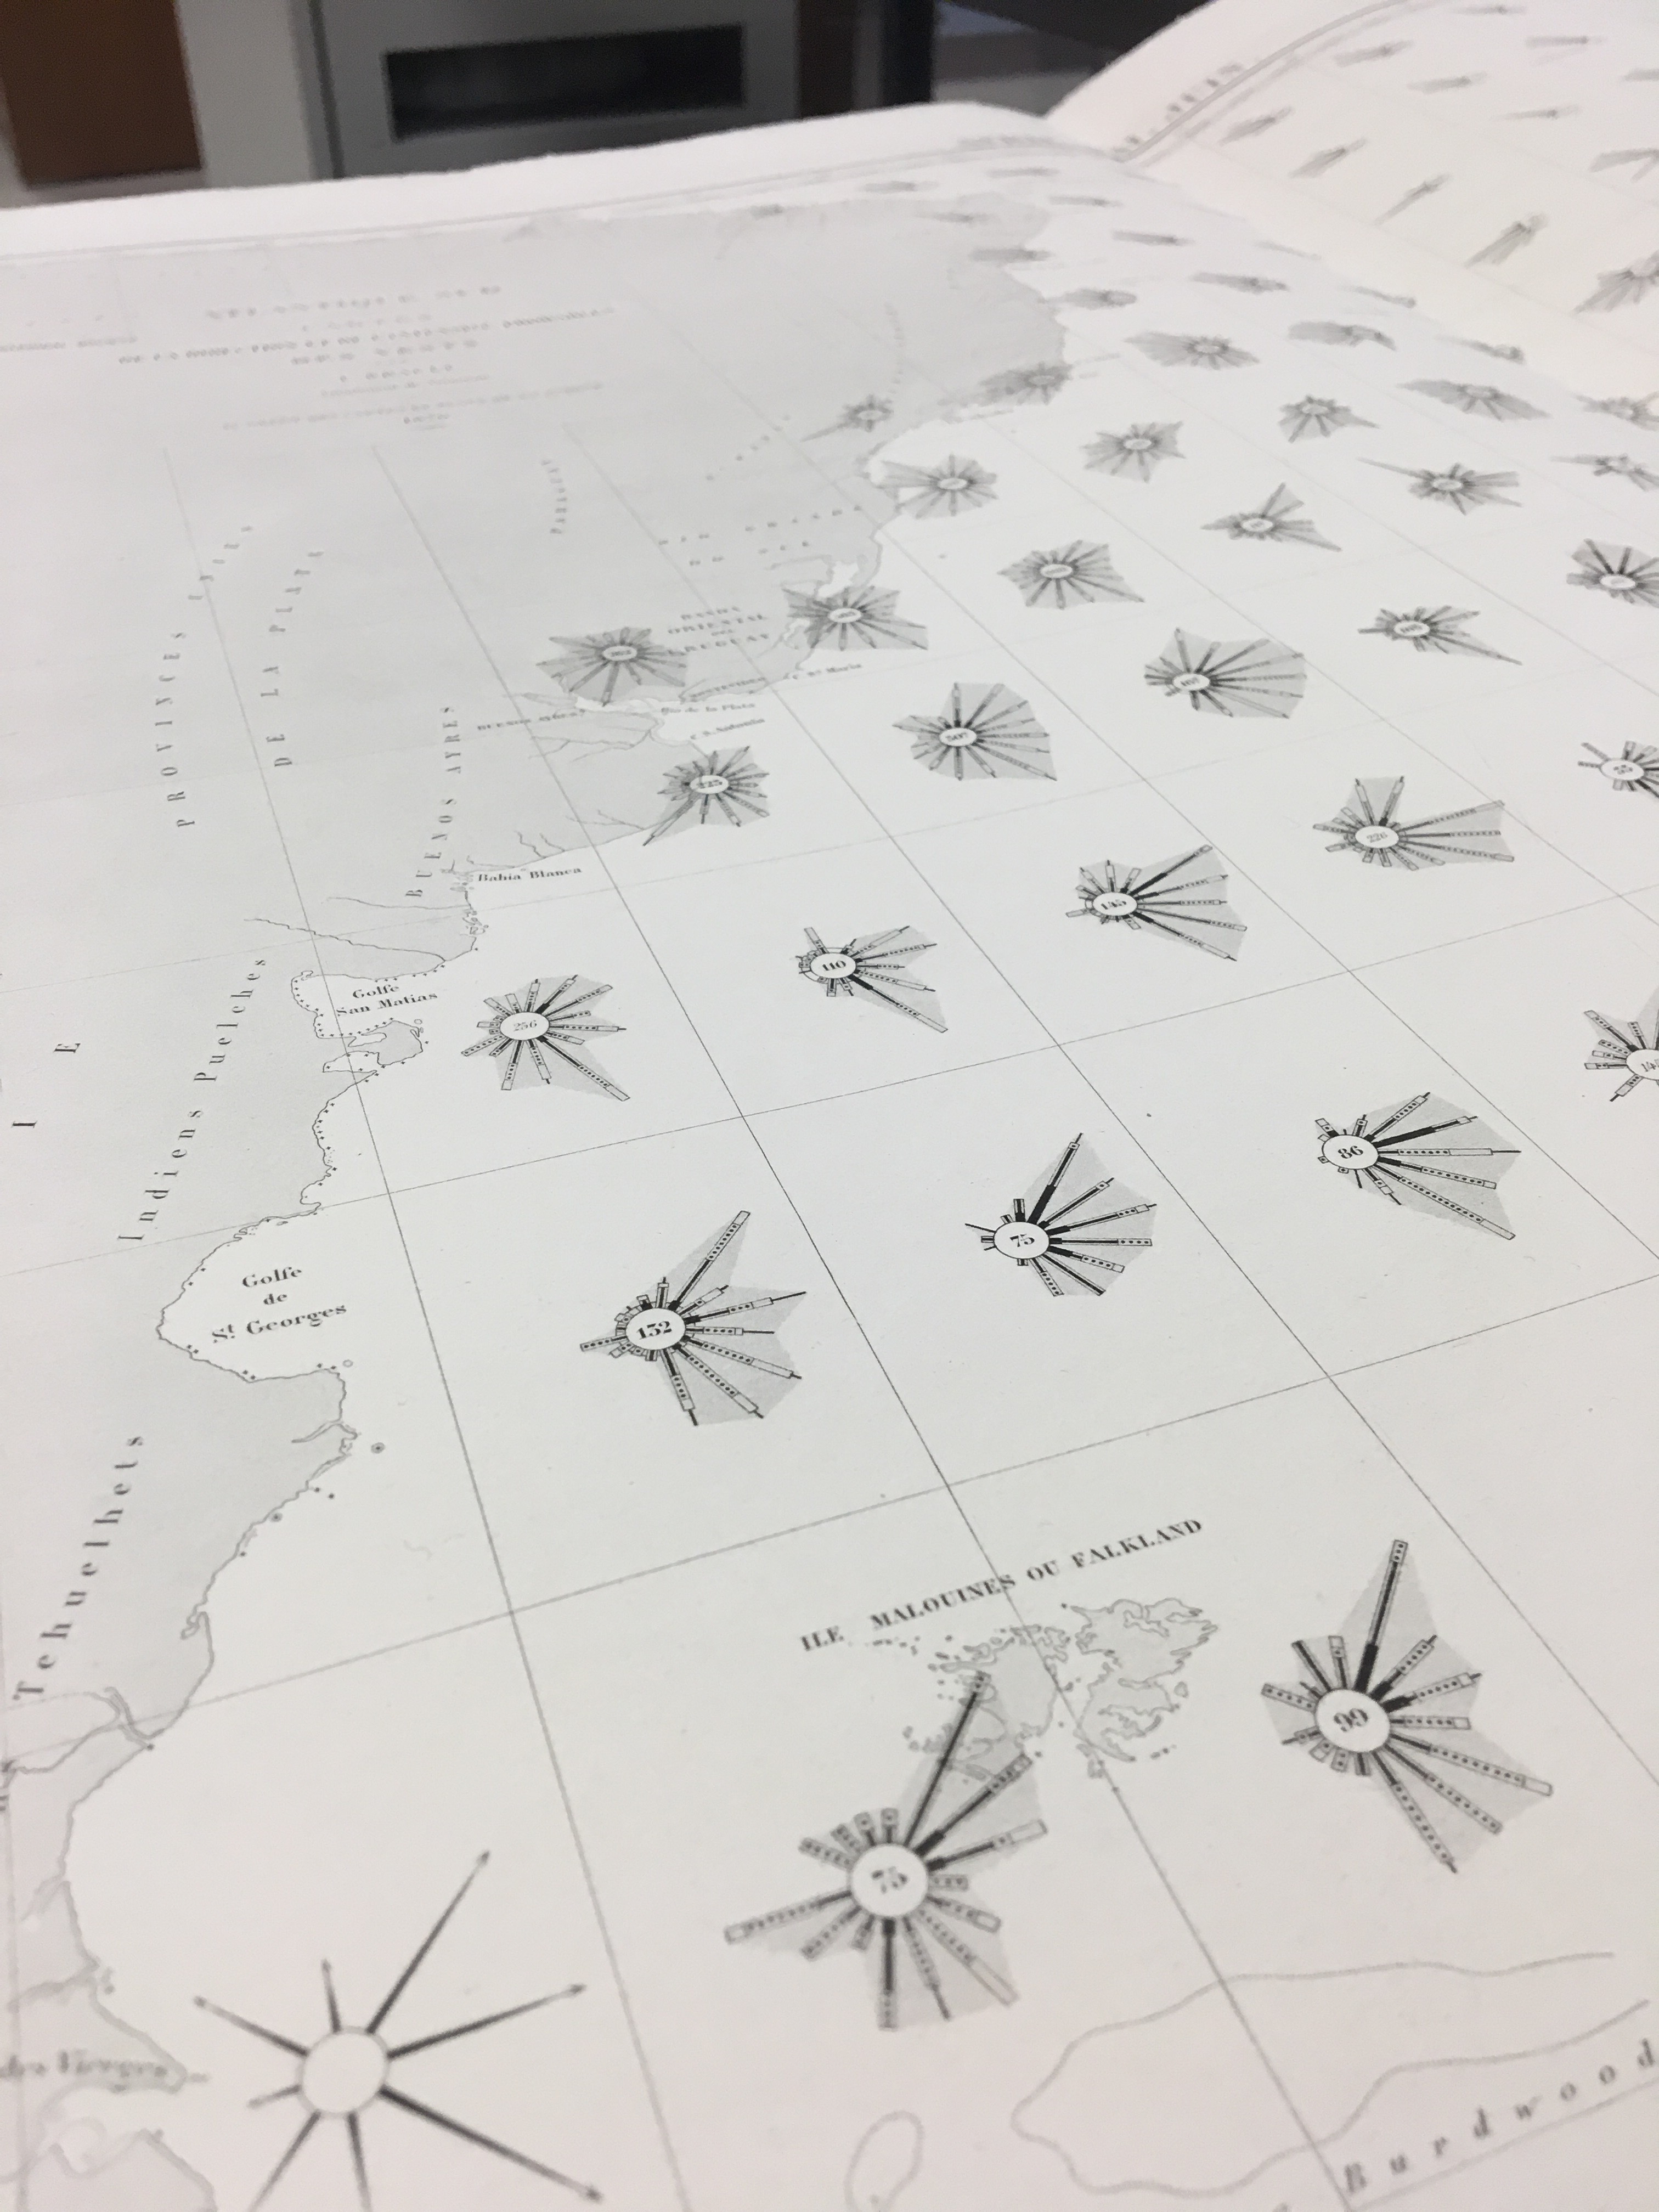
One aspect of the 19th and 20th Century nautical charts that continues to amaze me is the craftsmanship. I am currently working on the AGS Library’s set of Argentinian charts. Working with charts in a variety of languages means learning the various nuances of how the language is used in cartography, especially abbreviations. One abbreviation that had us scratching our heads for a little while was “dib.”, which we would see in the bottom right margin of the sheet accompanied by a name. I later found that this stood for dubujado or drawn and was again impressed by the level of craftsmanship and precision that is involved in cartography, especially in the days before computers.
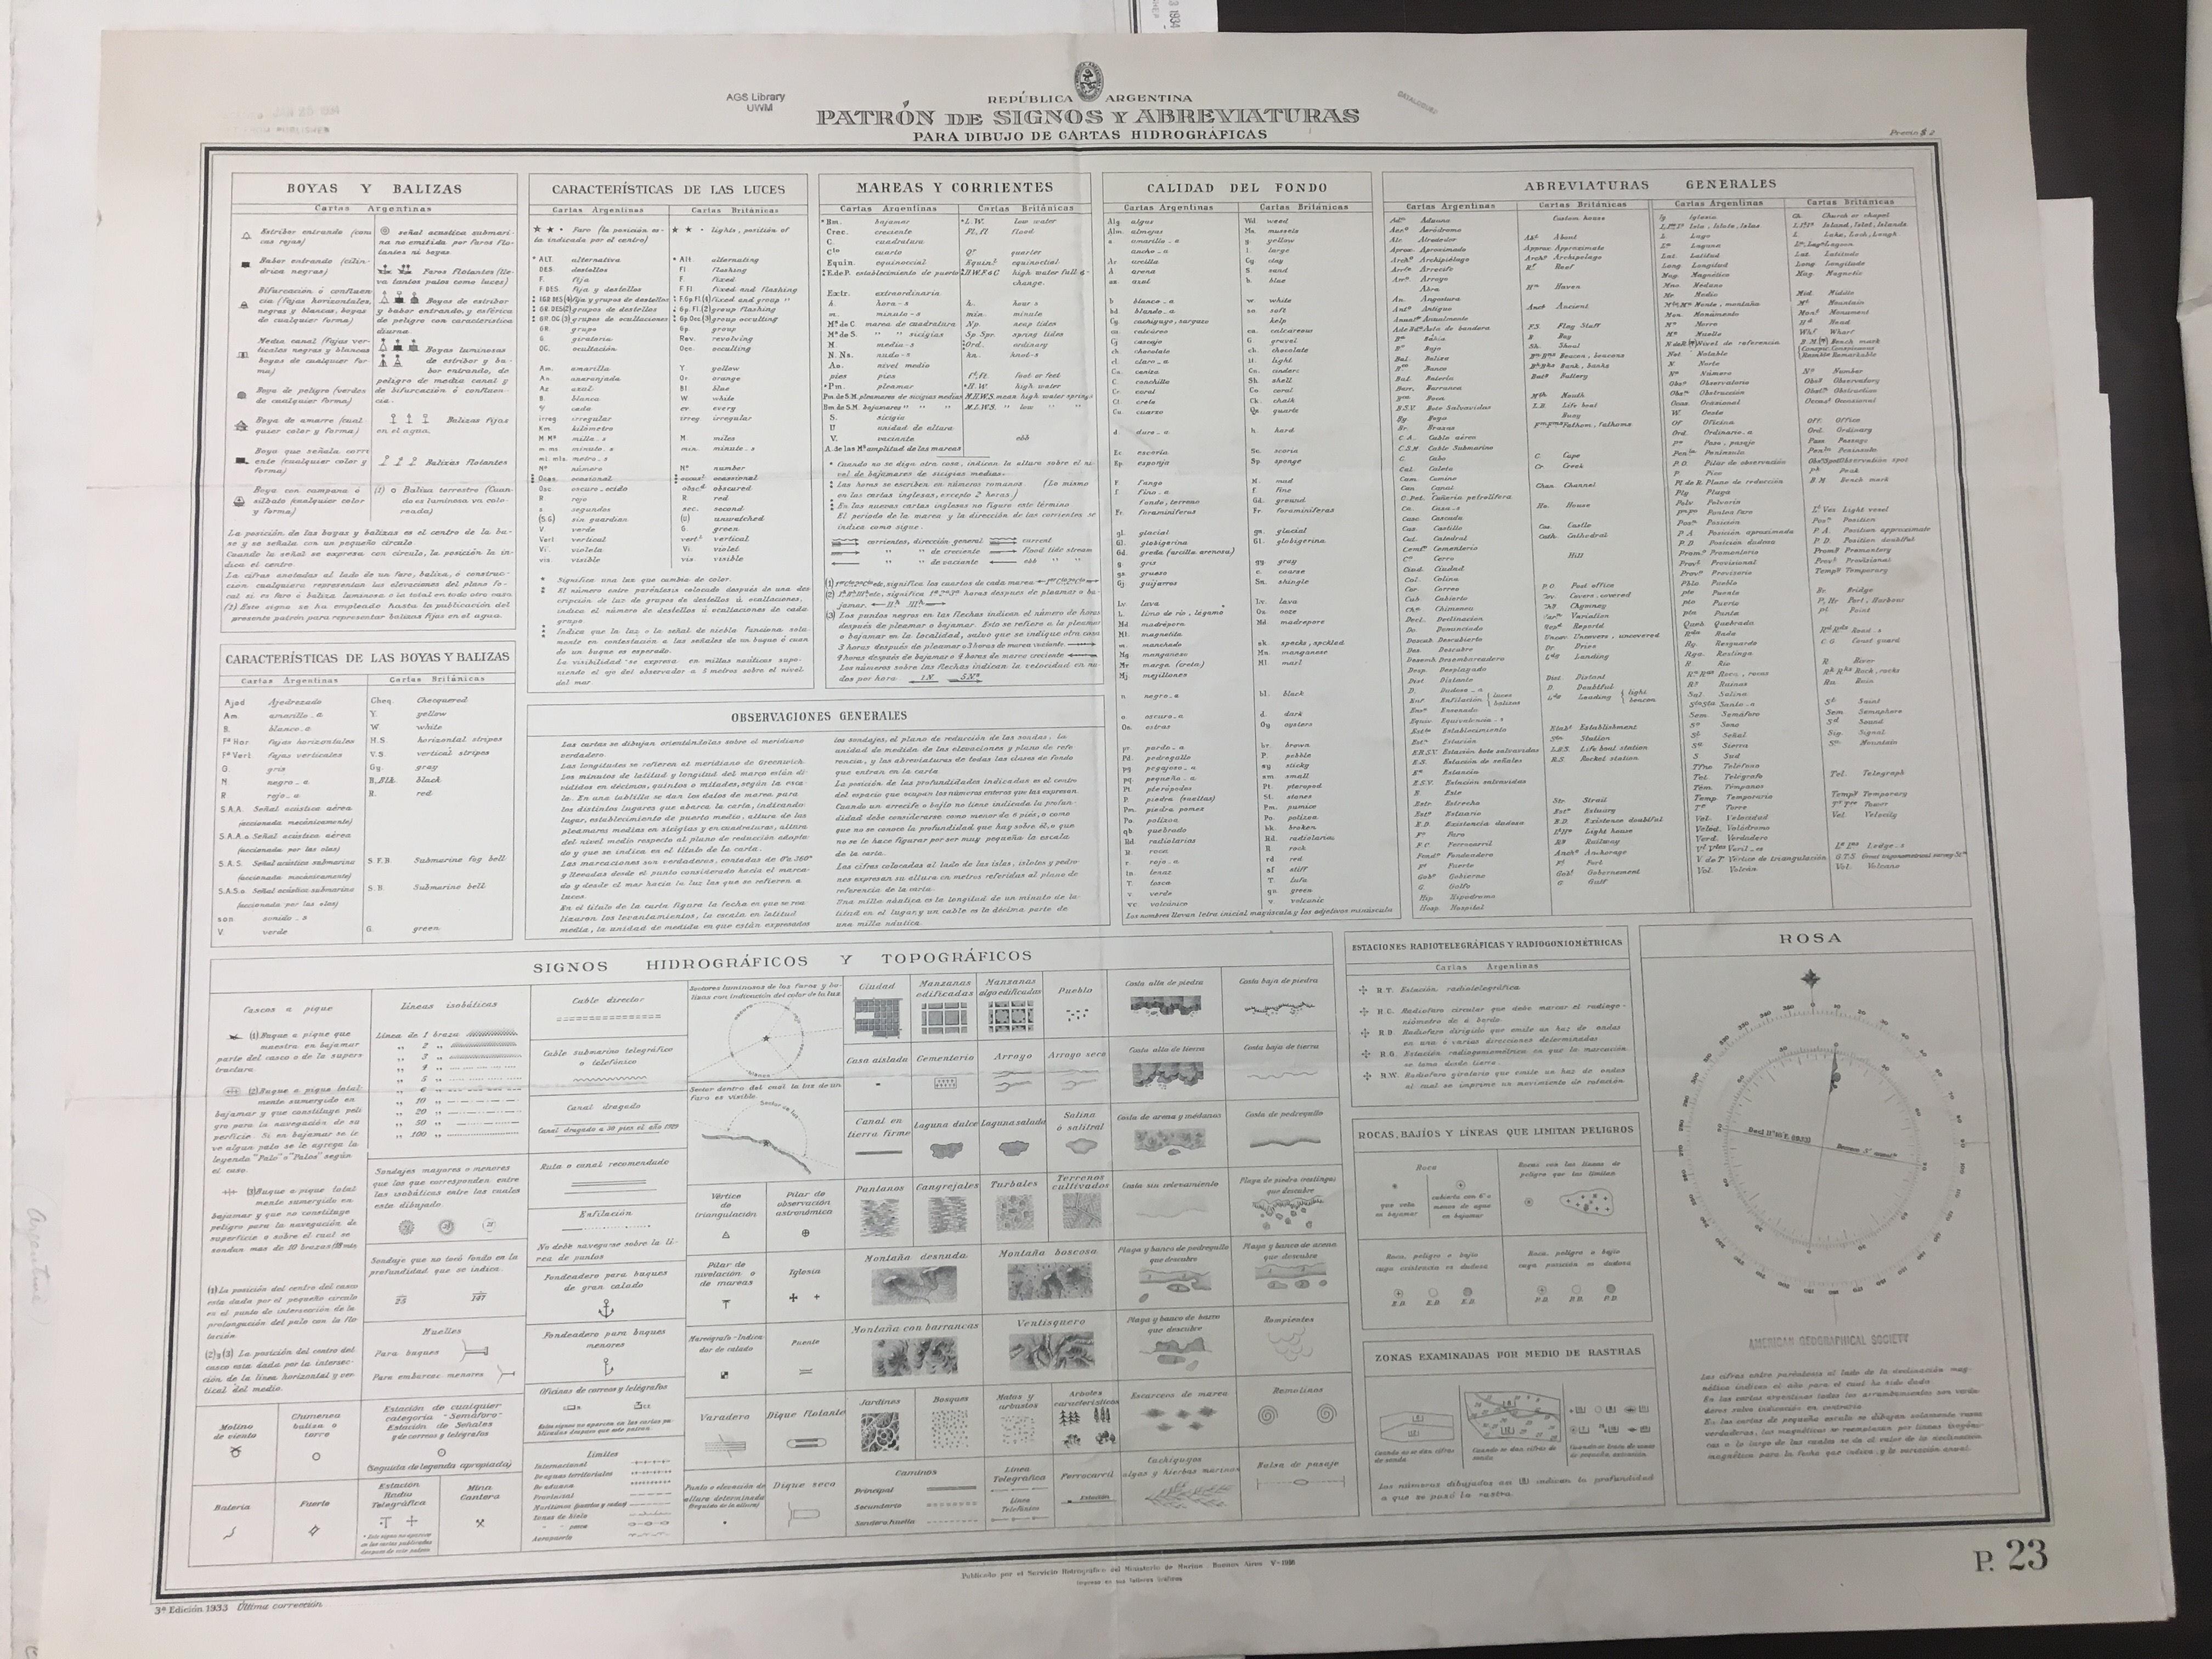
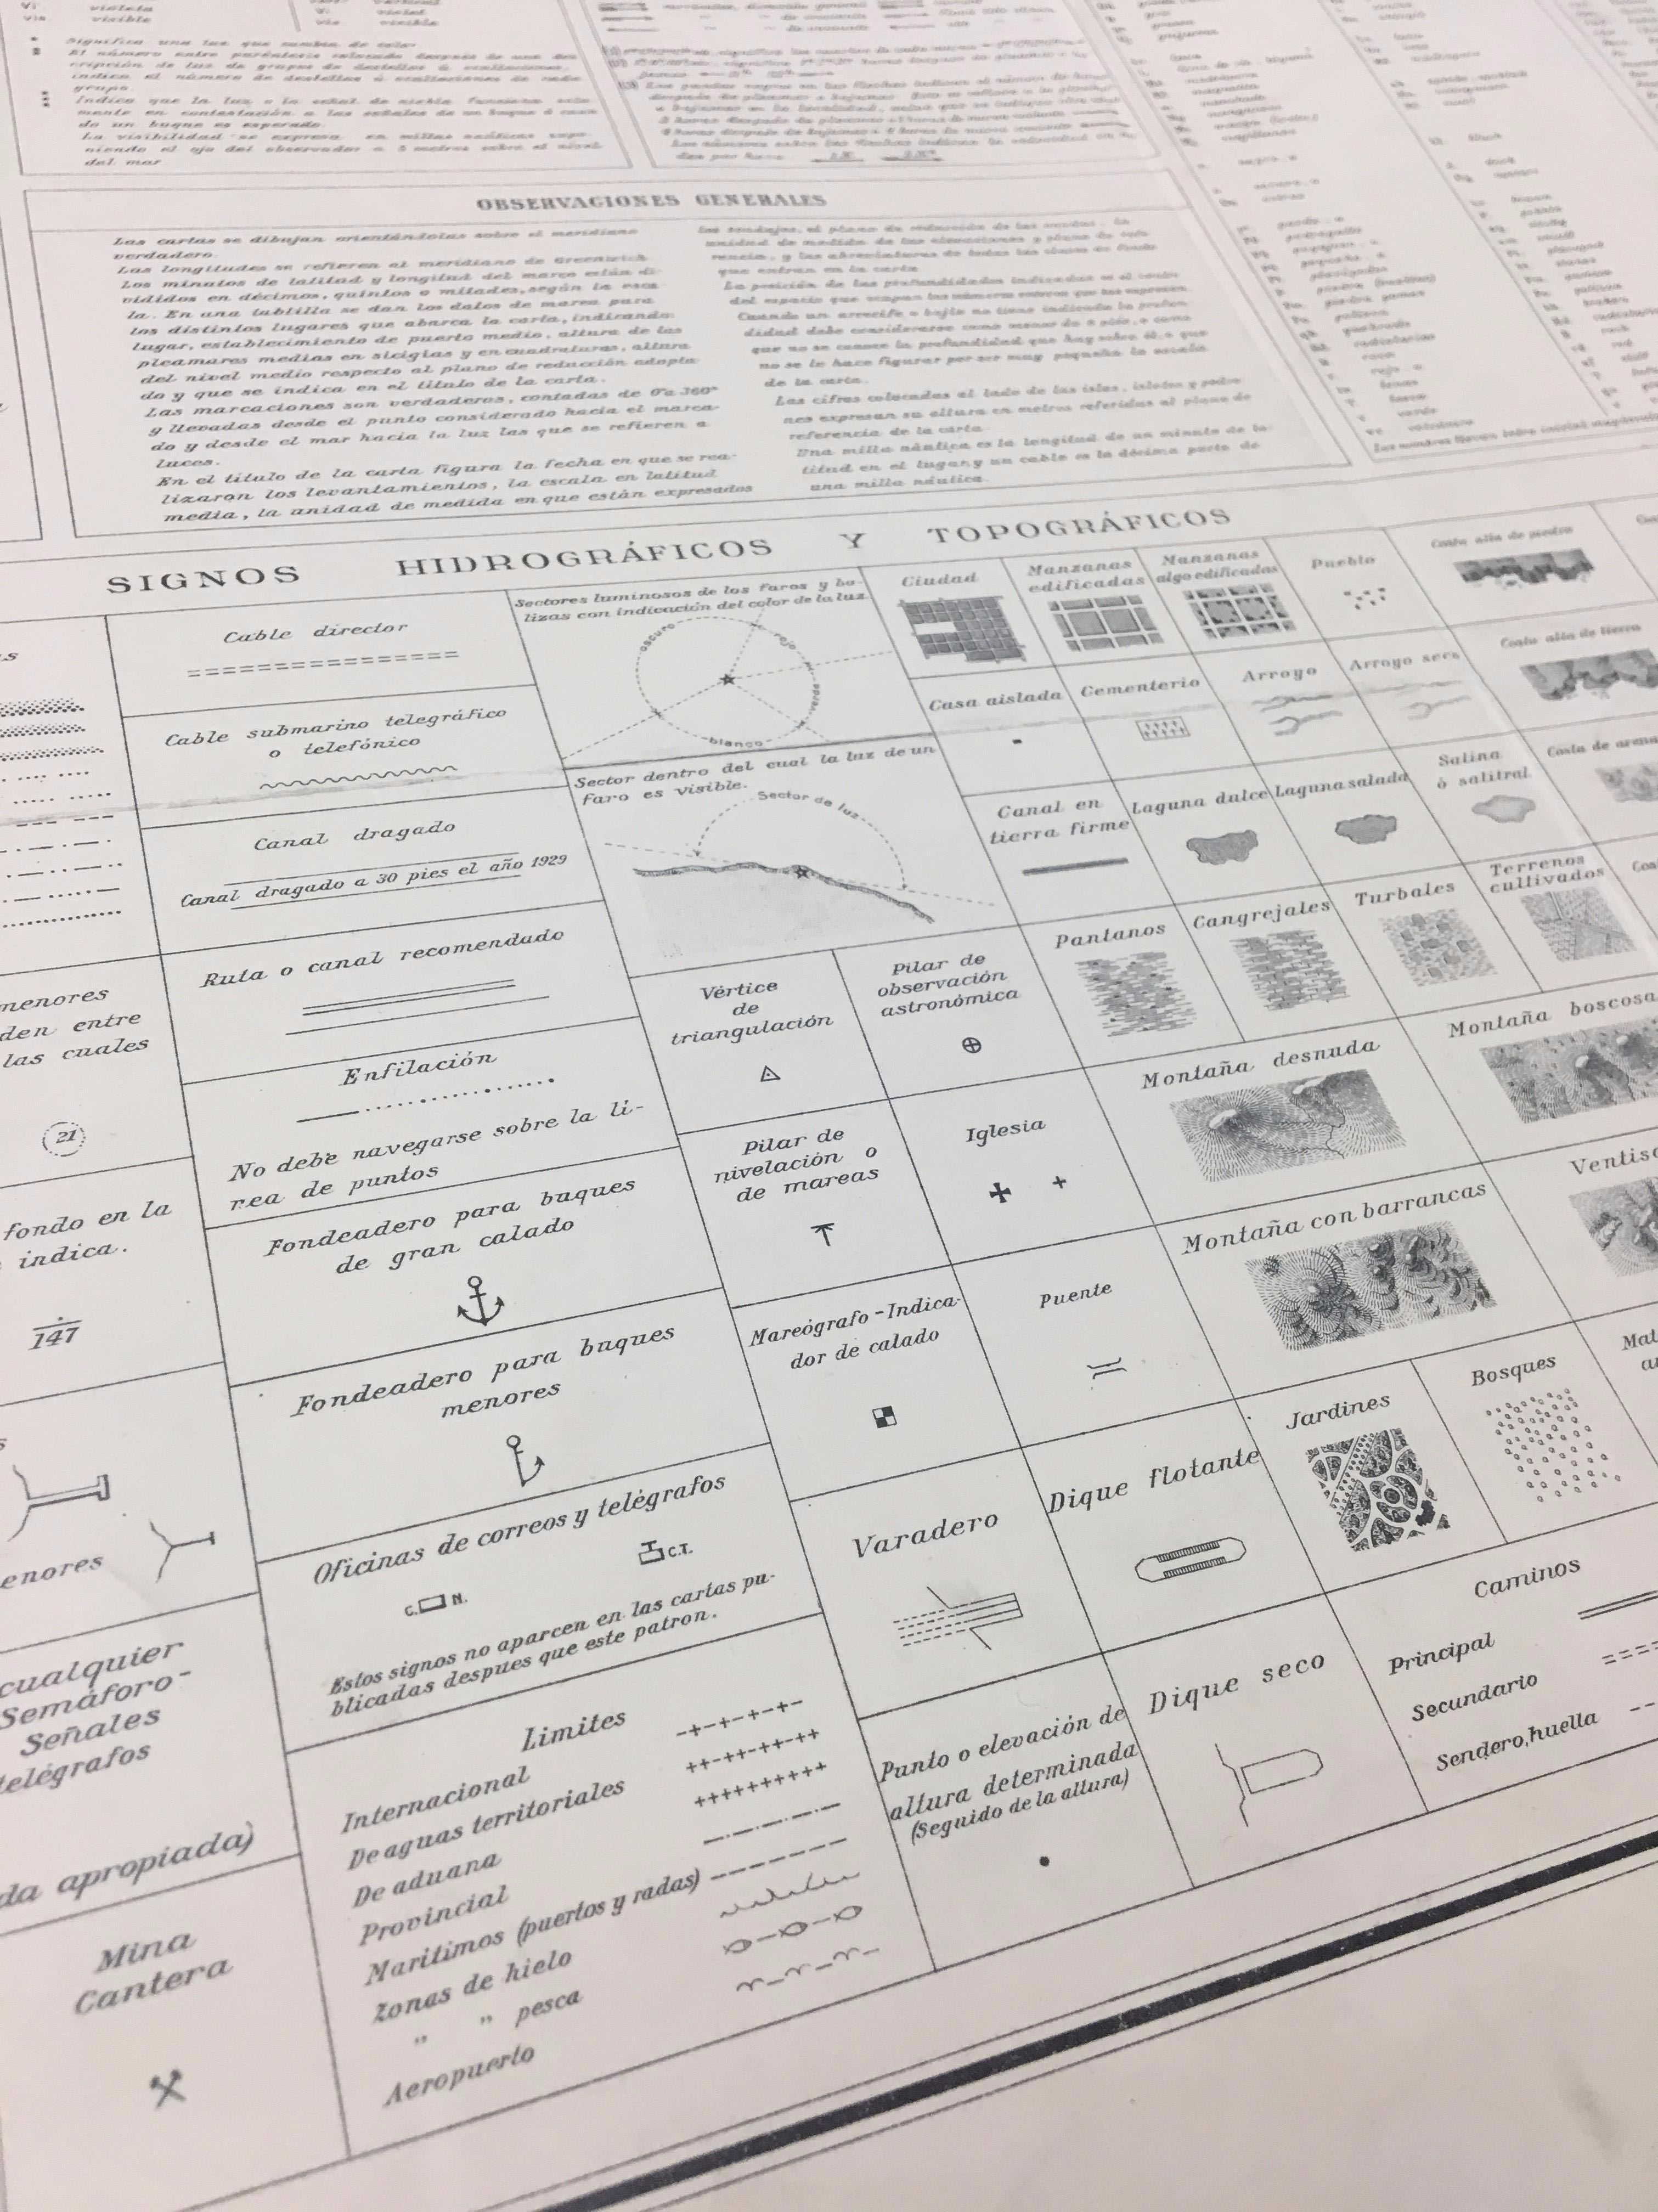
While cataloging the Argentinian charts I came across a chart containing keys for abbreviations, signals and topographic and hydrographic symbols used in the drawing of the charts in the series. This is a reference guide for those who would use the charts. Note the variety of styles that were done by hand before maps were engraved and then printed (click the image for an enlarged view).

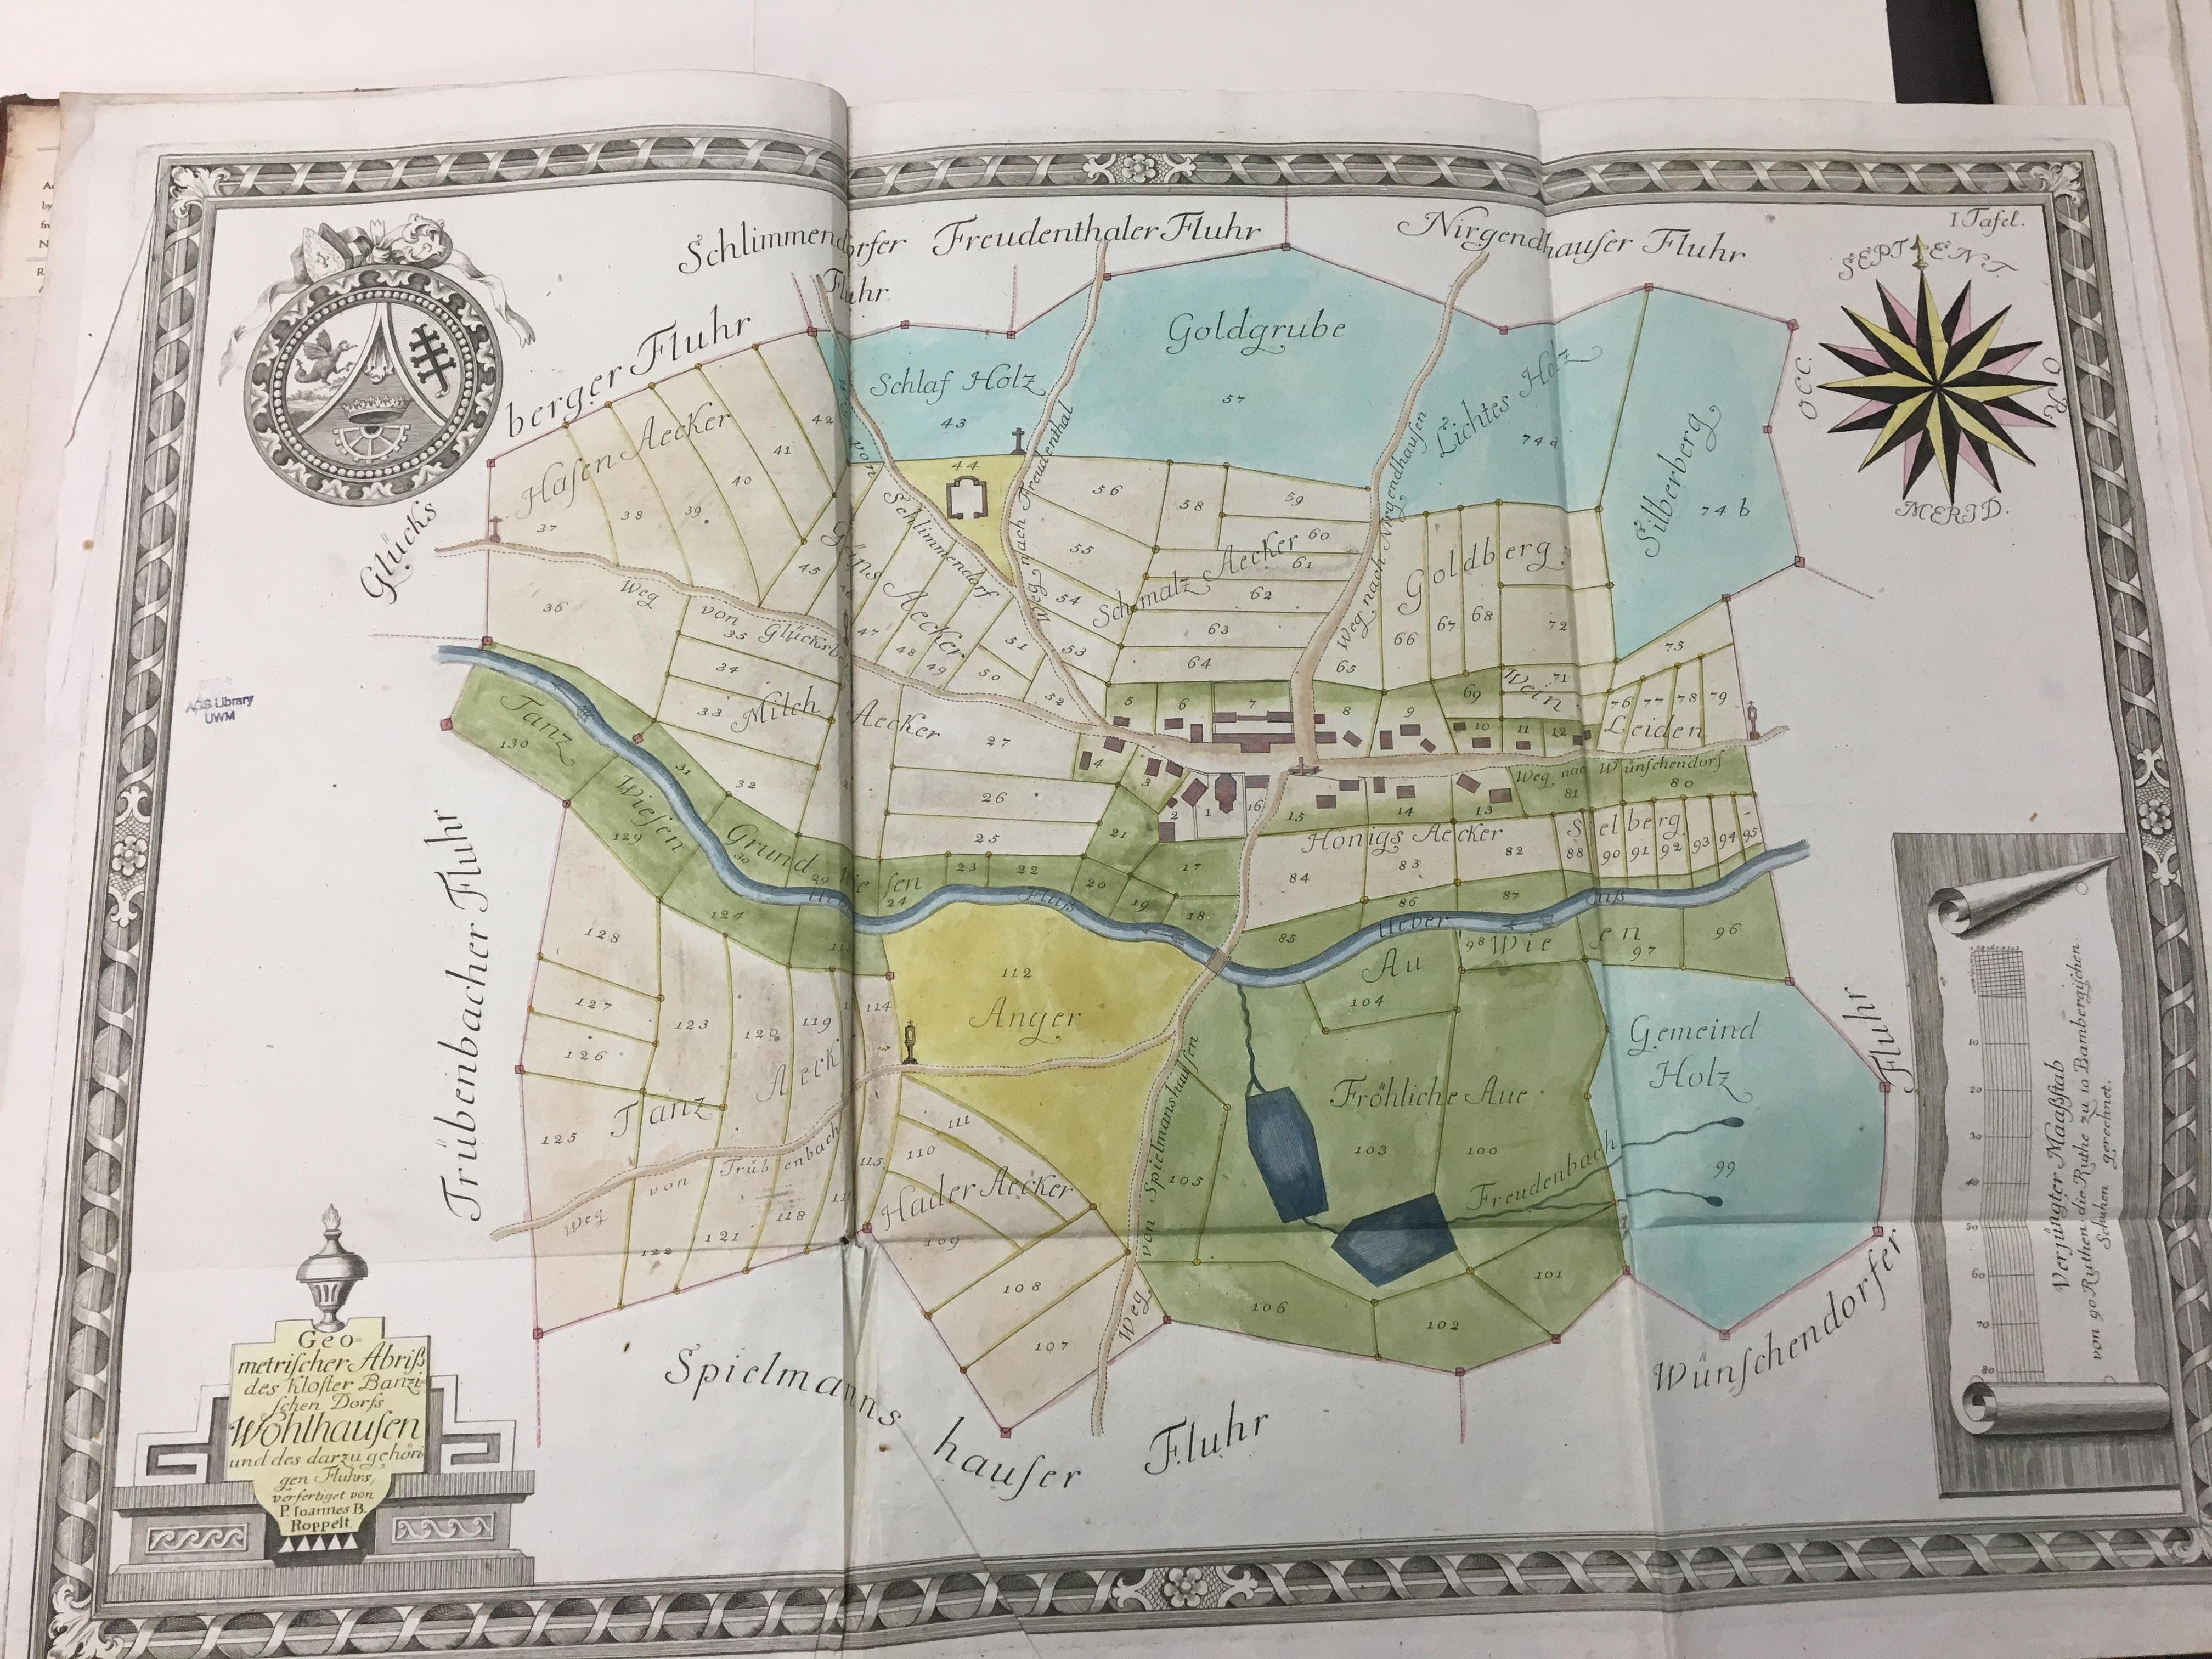
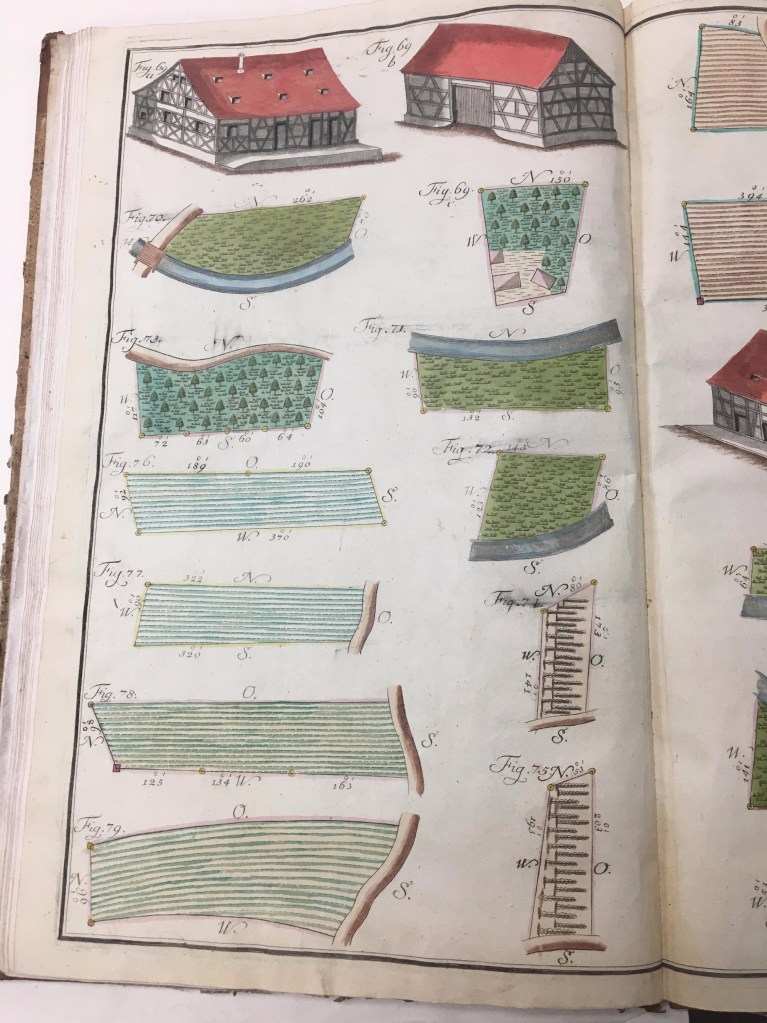
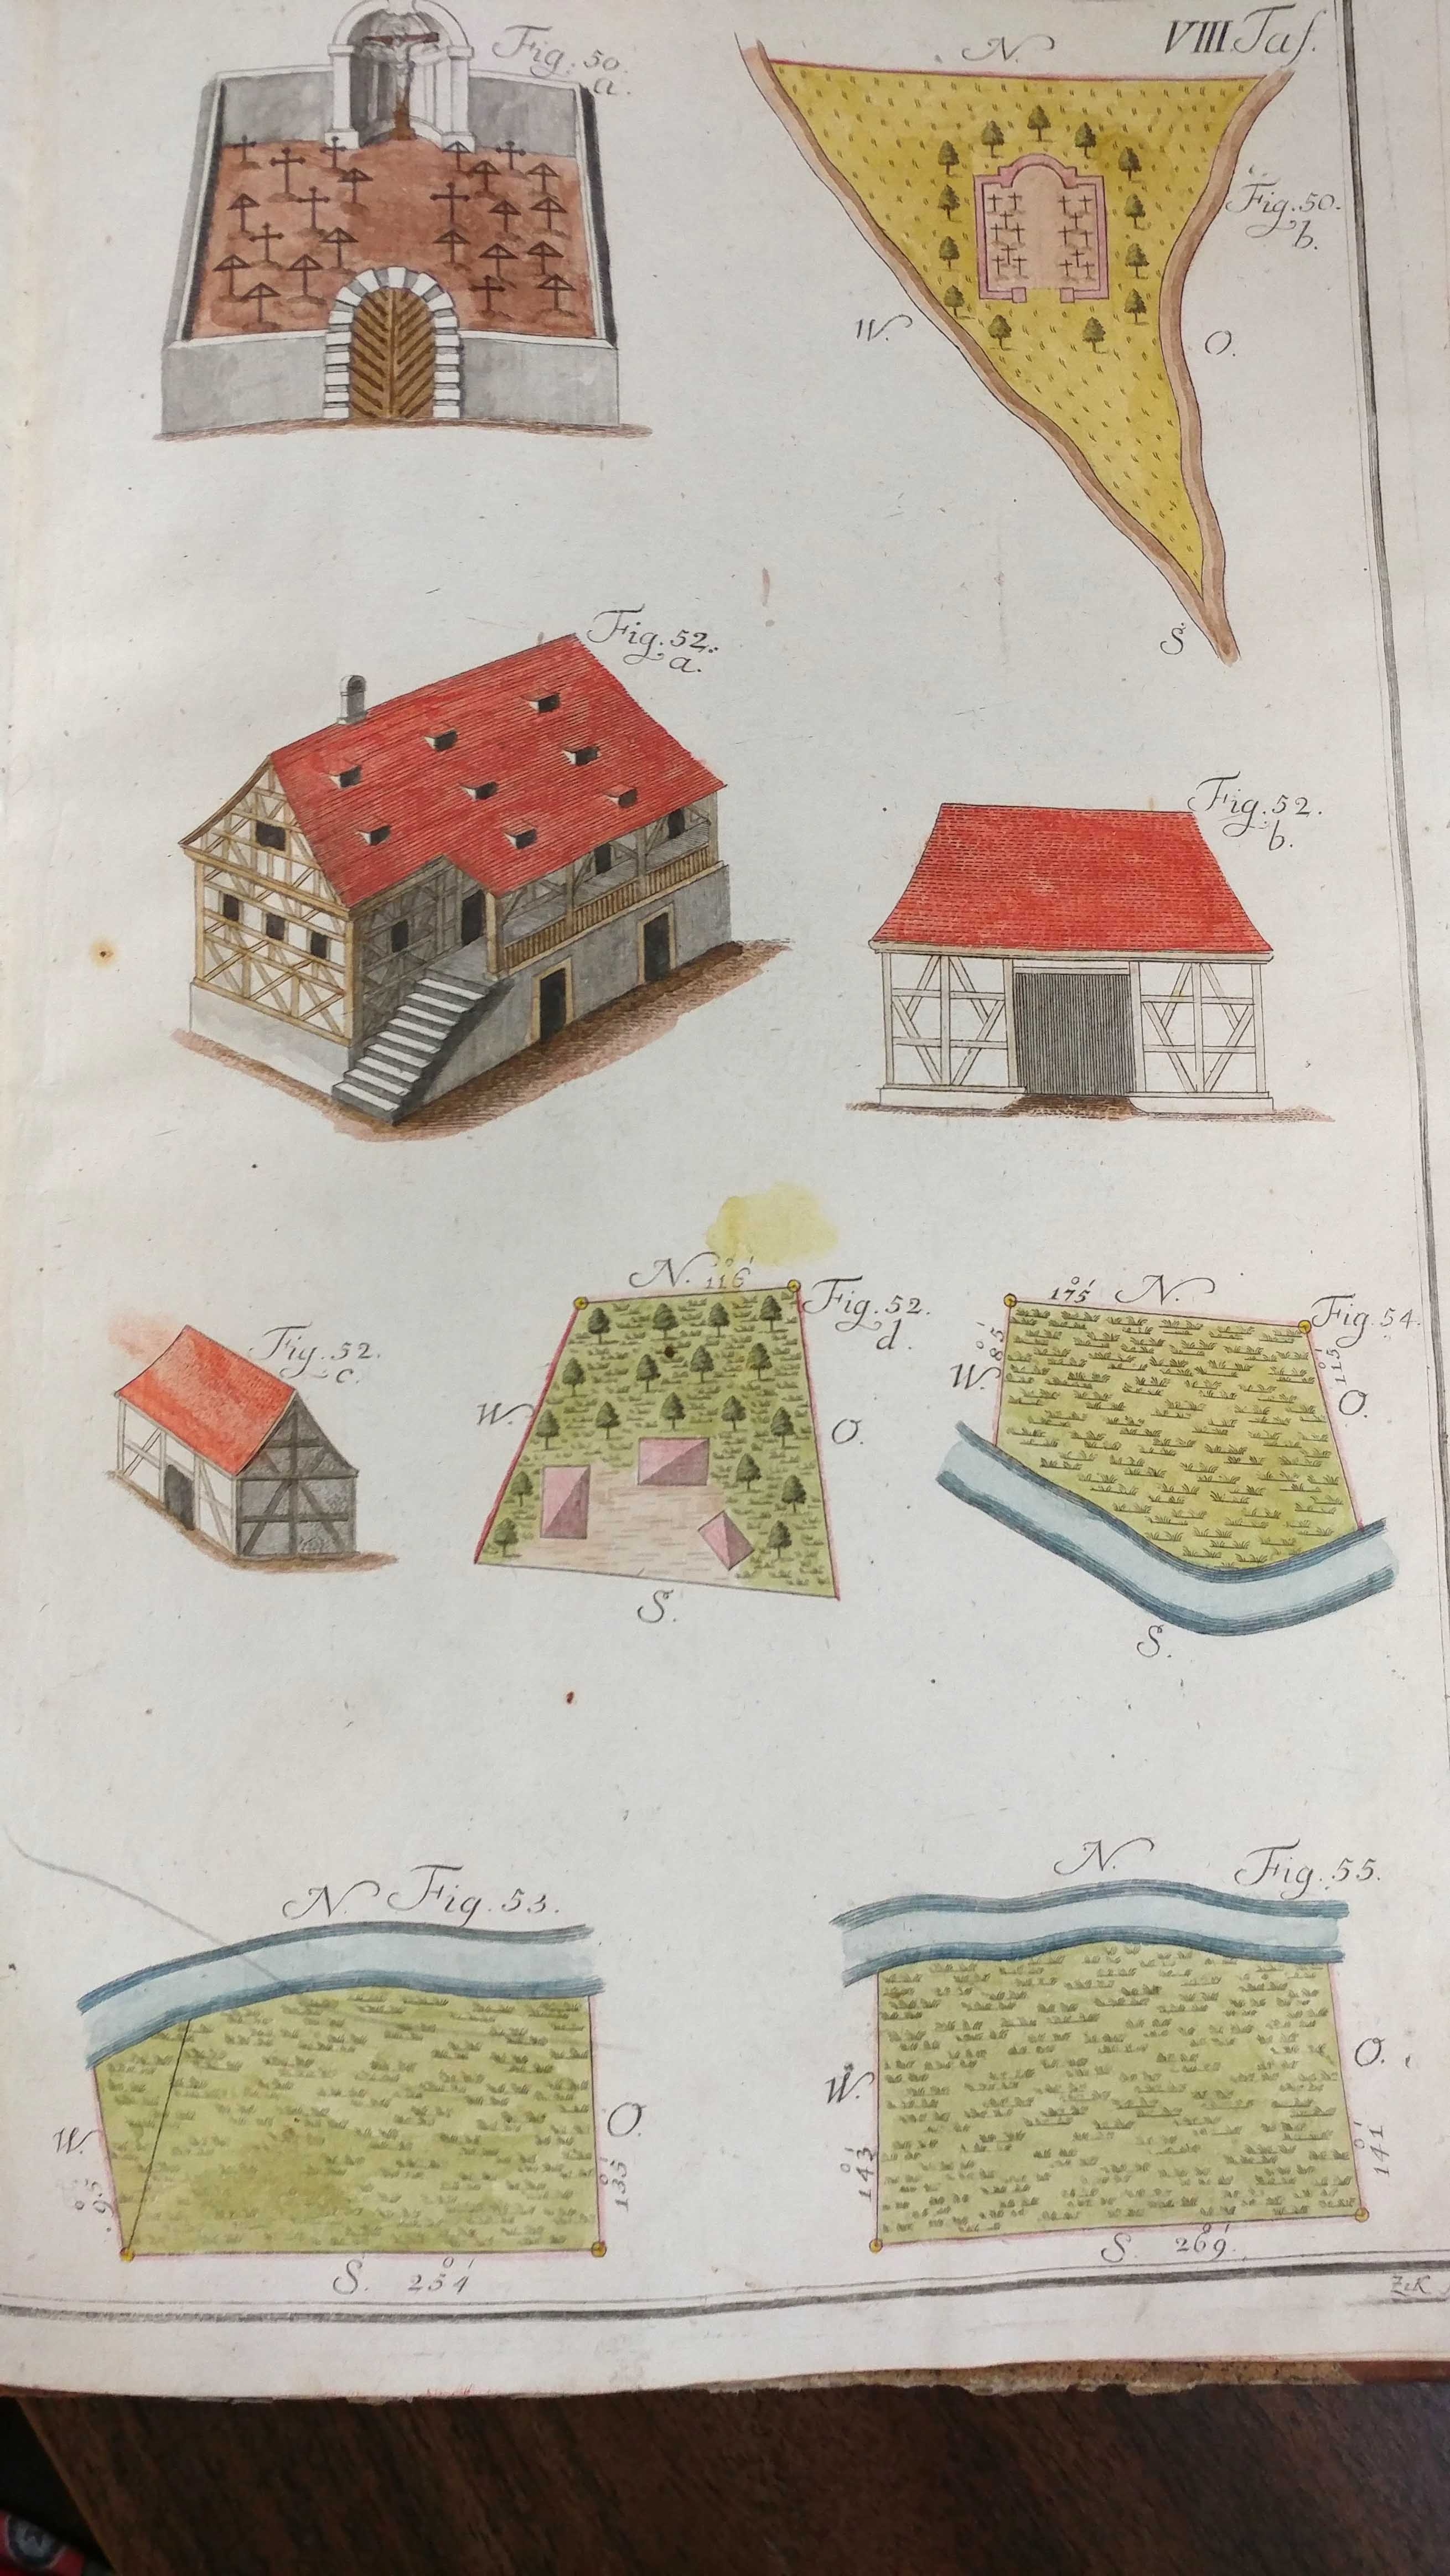
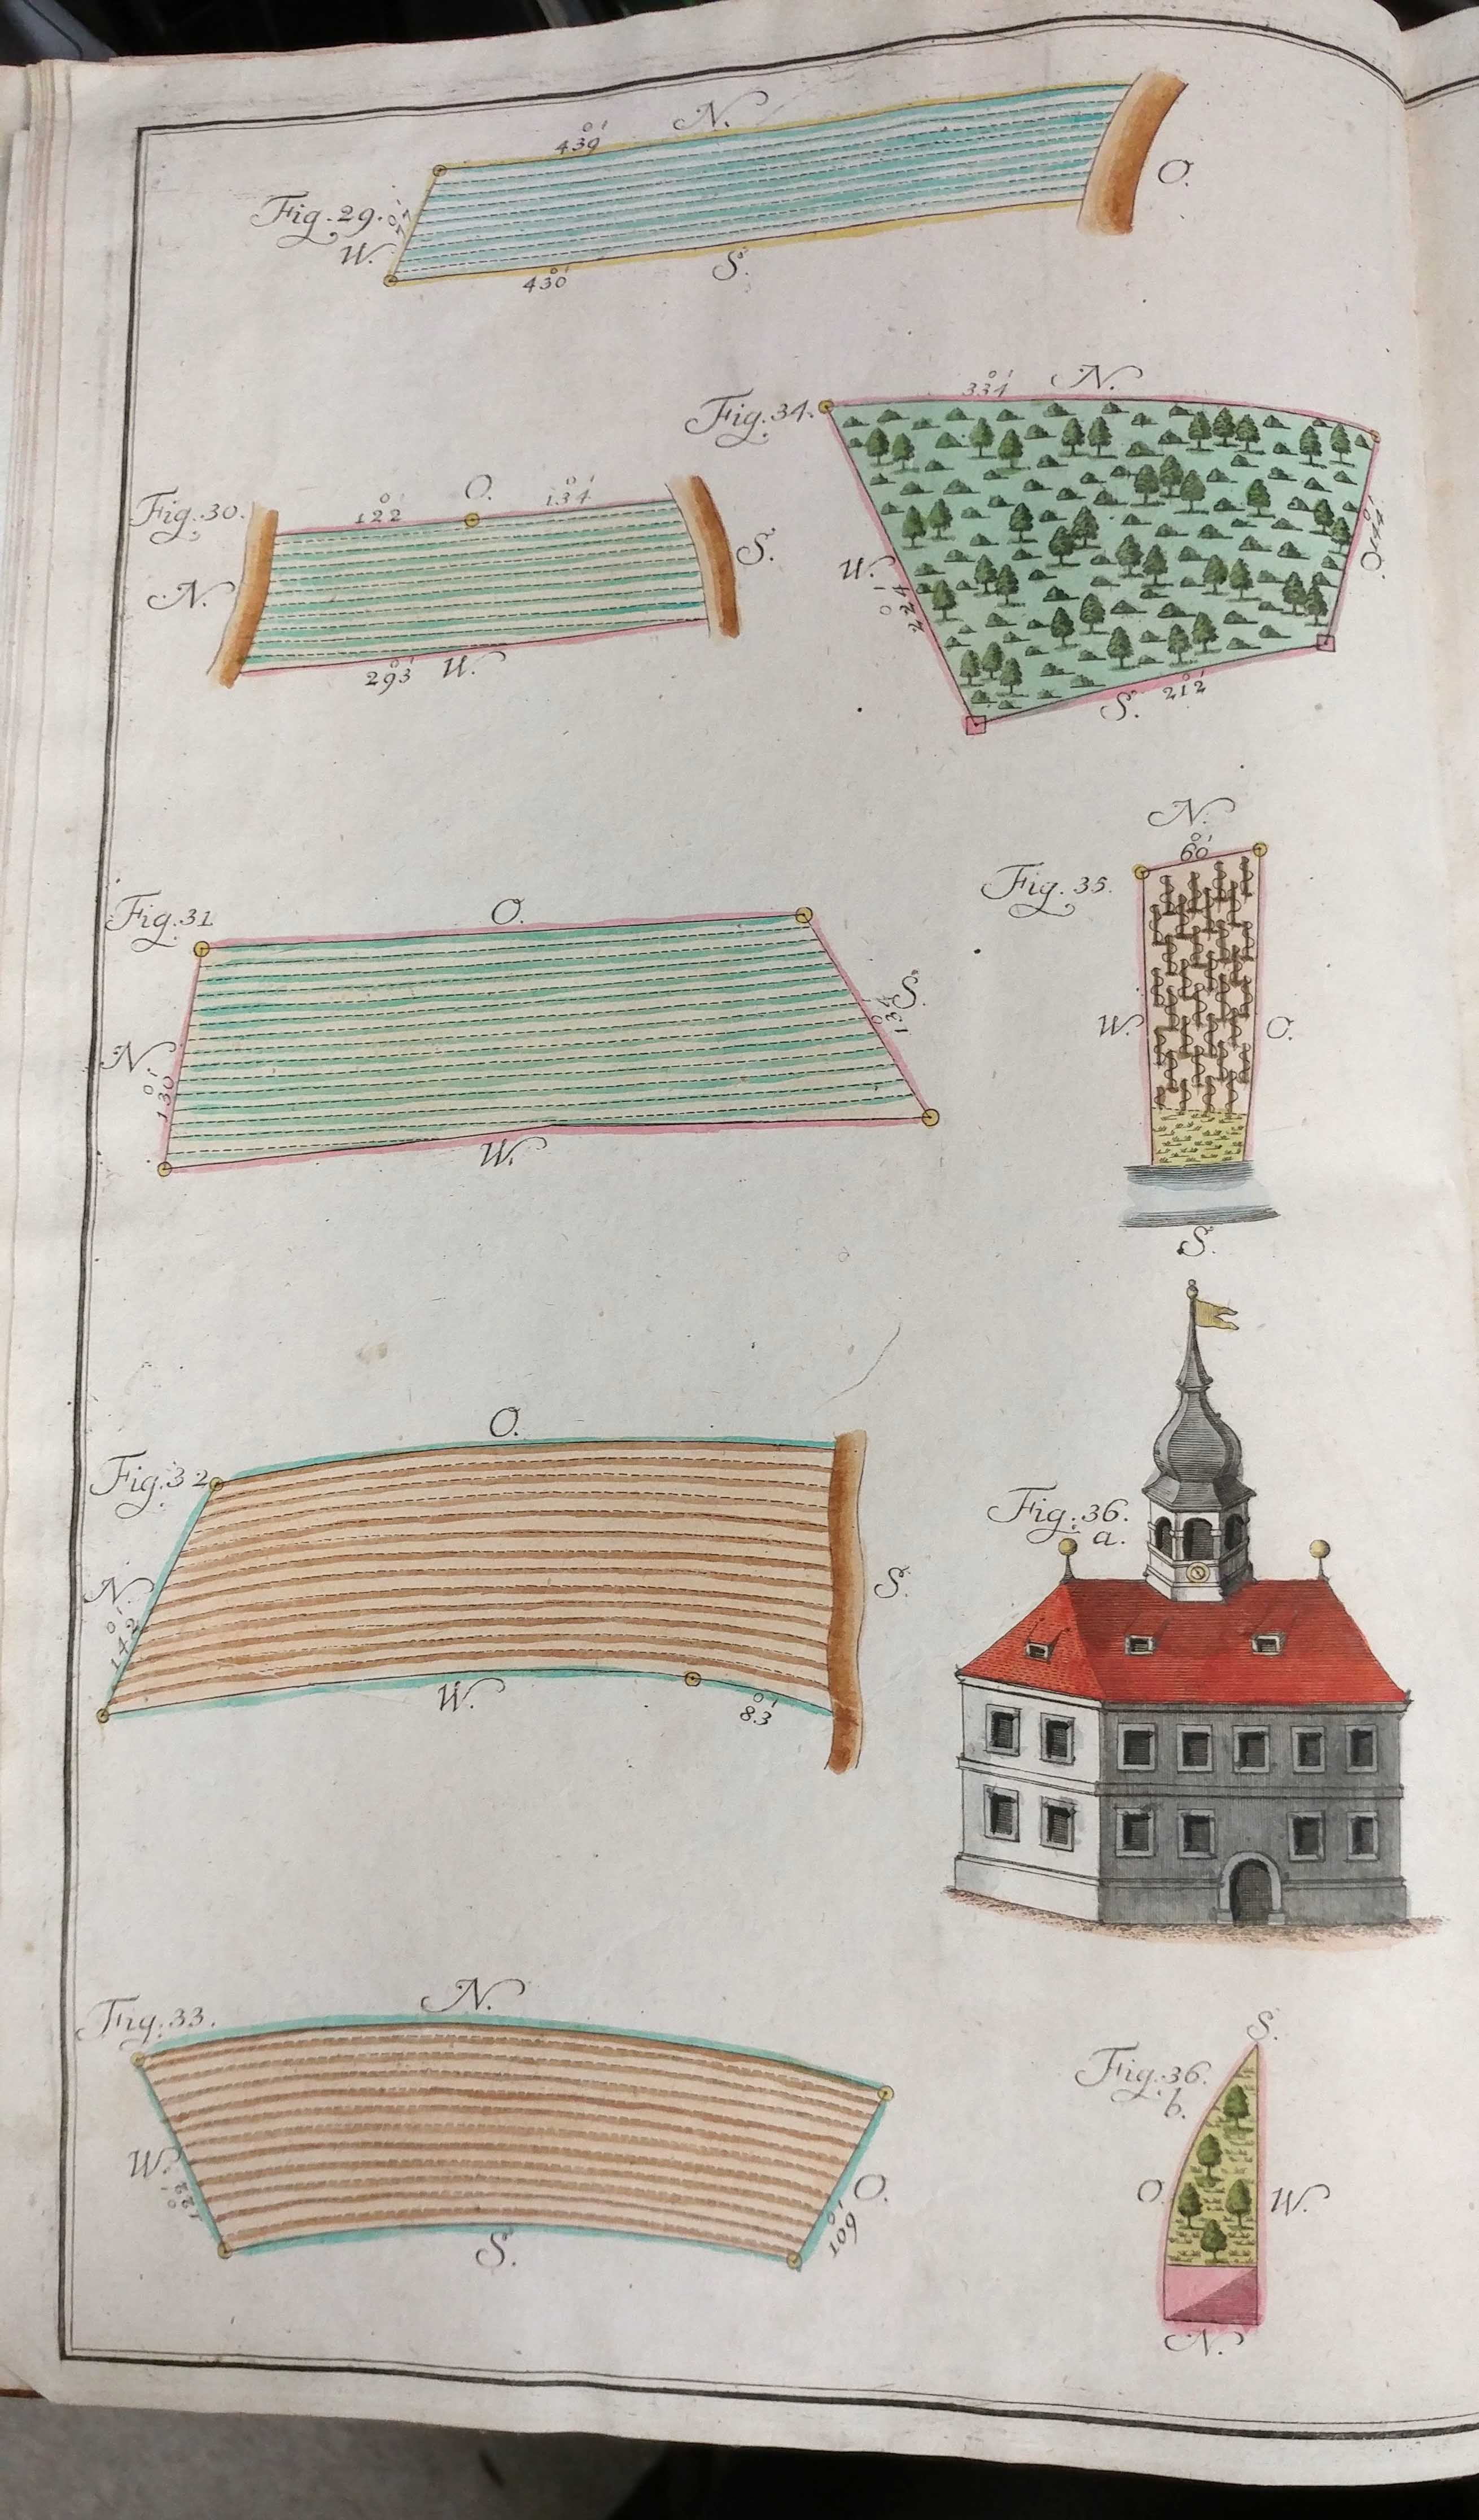
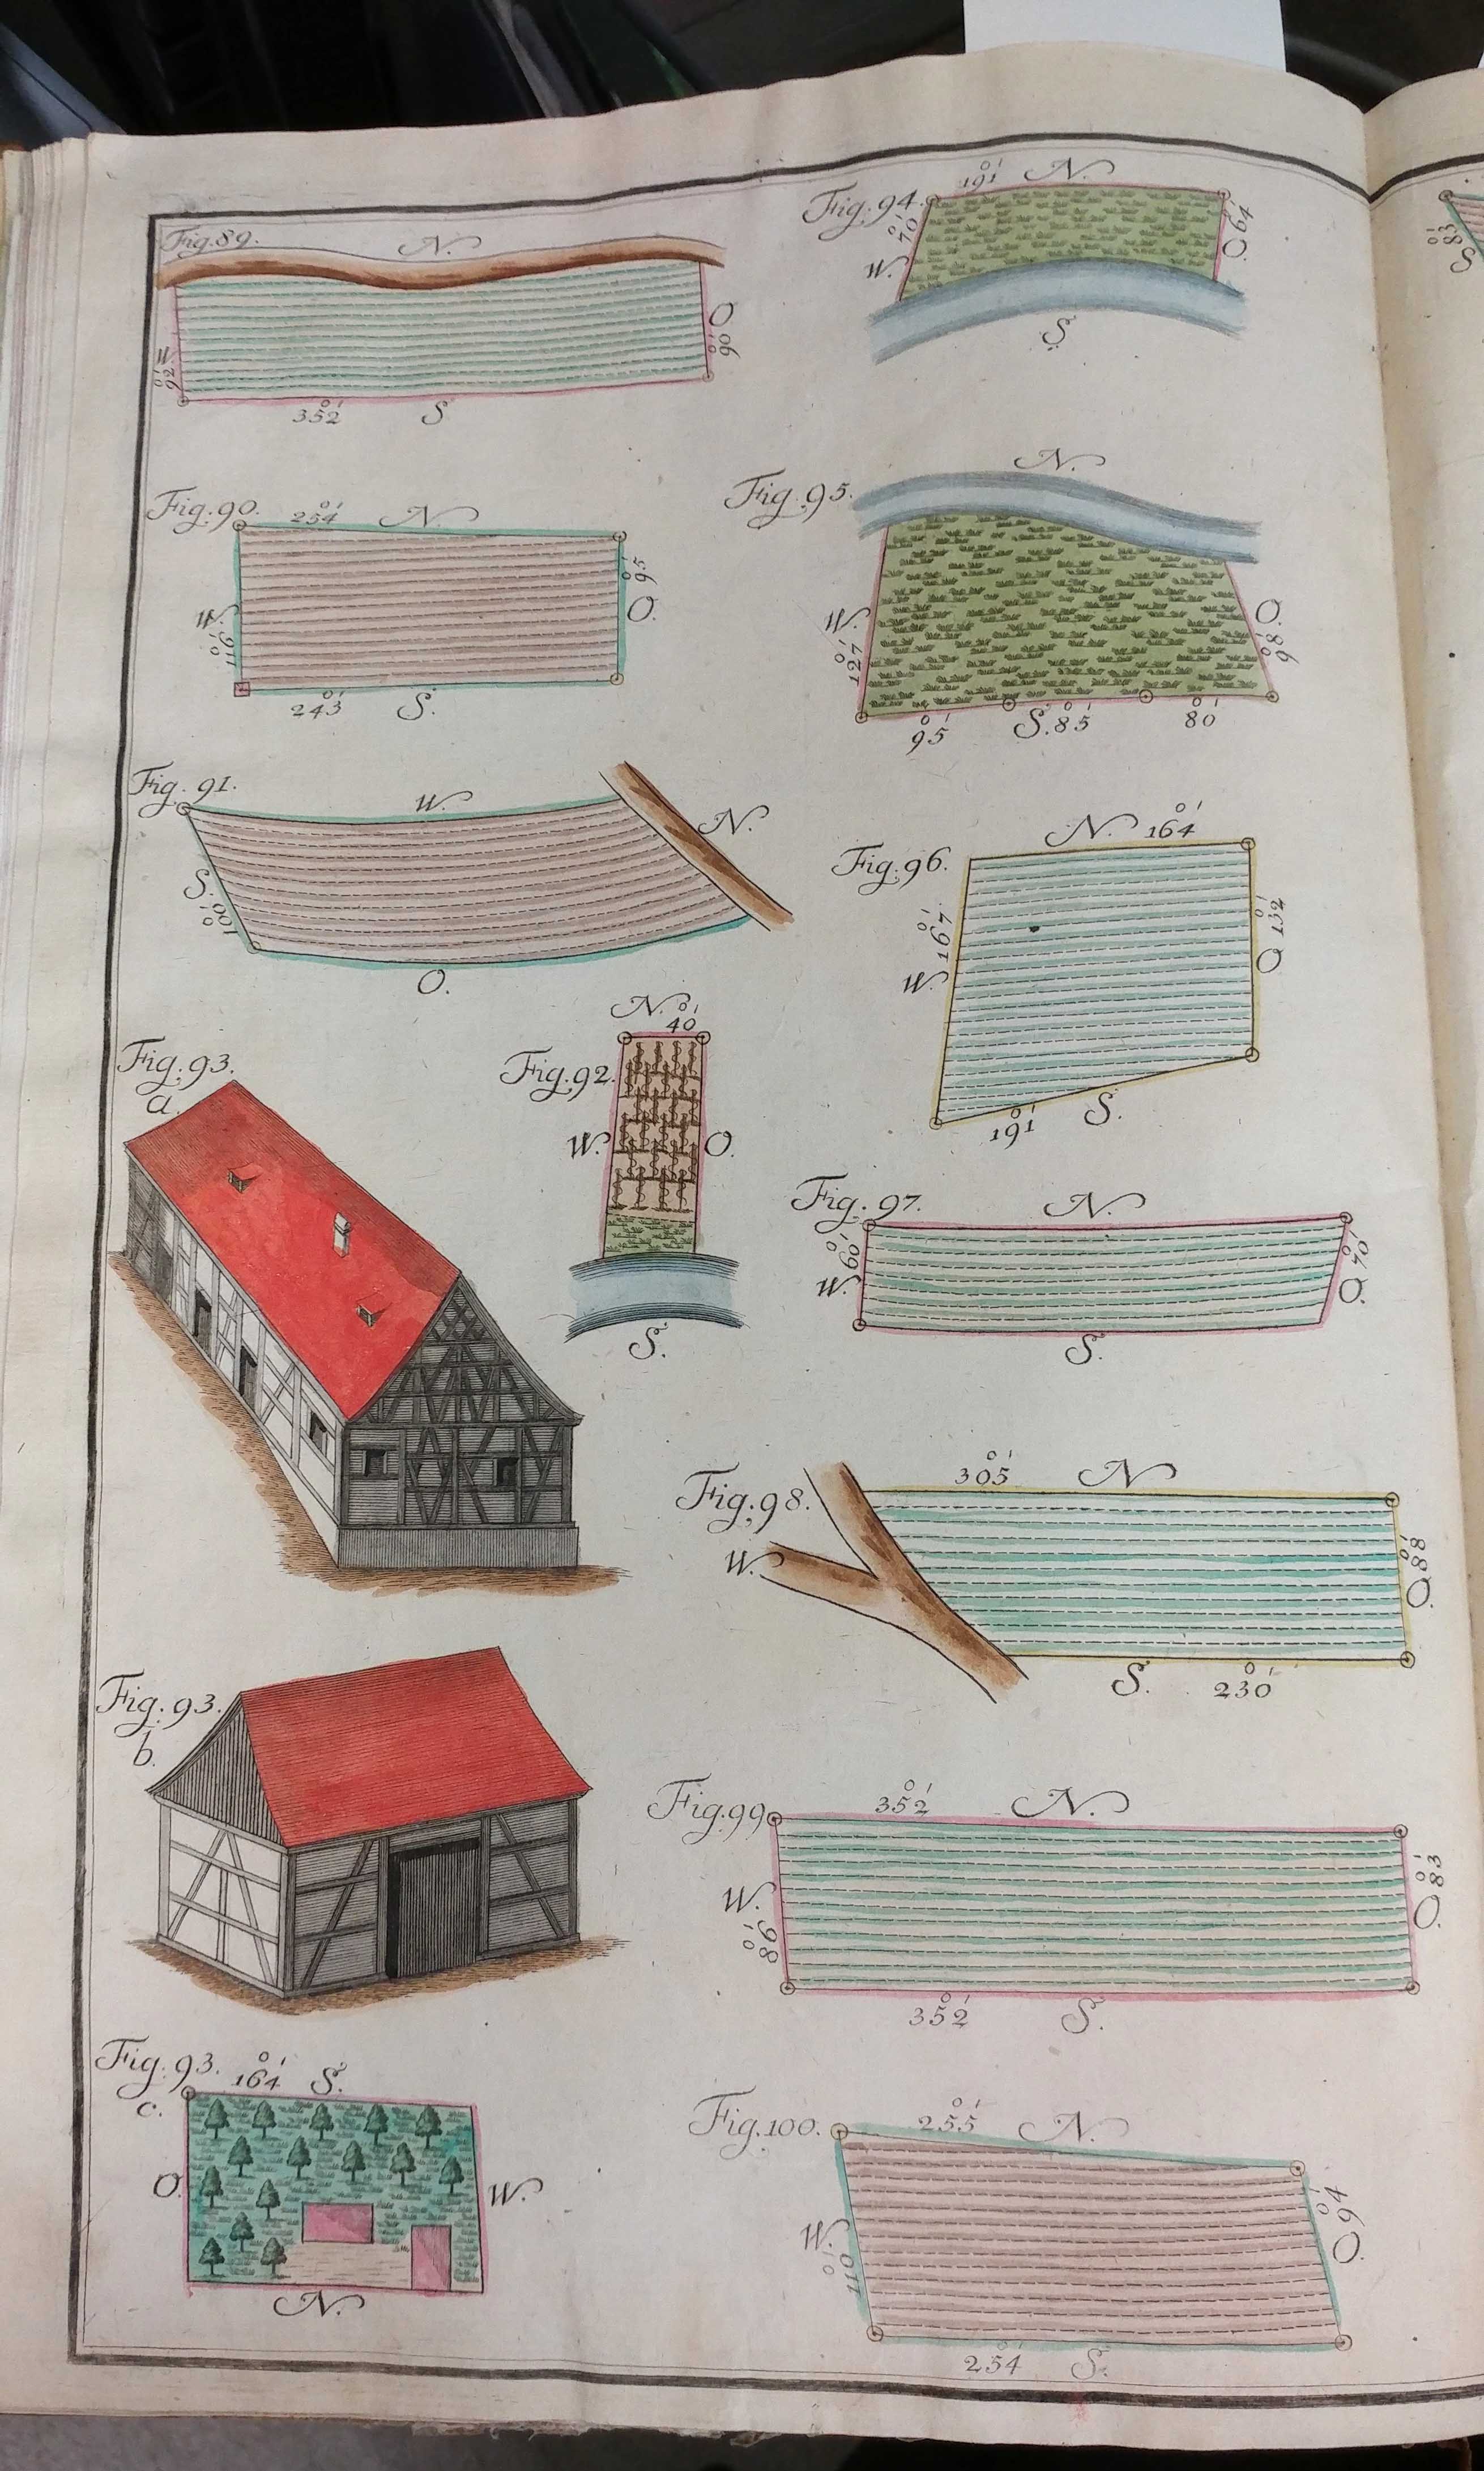
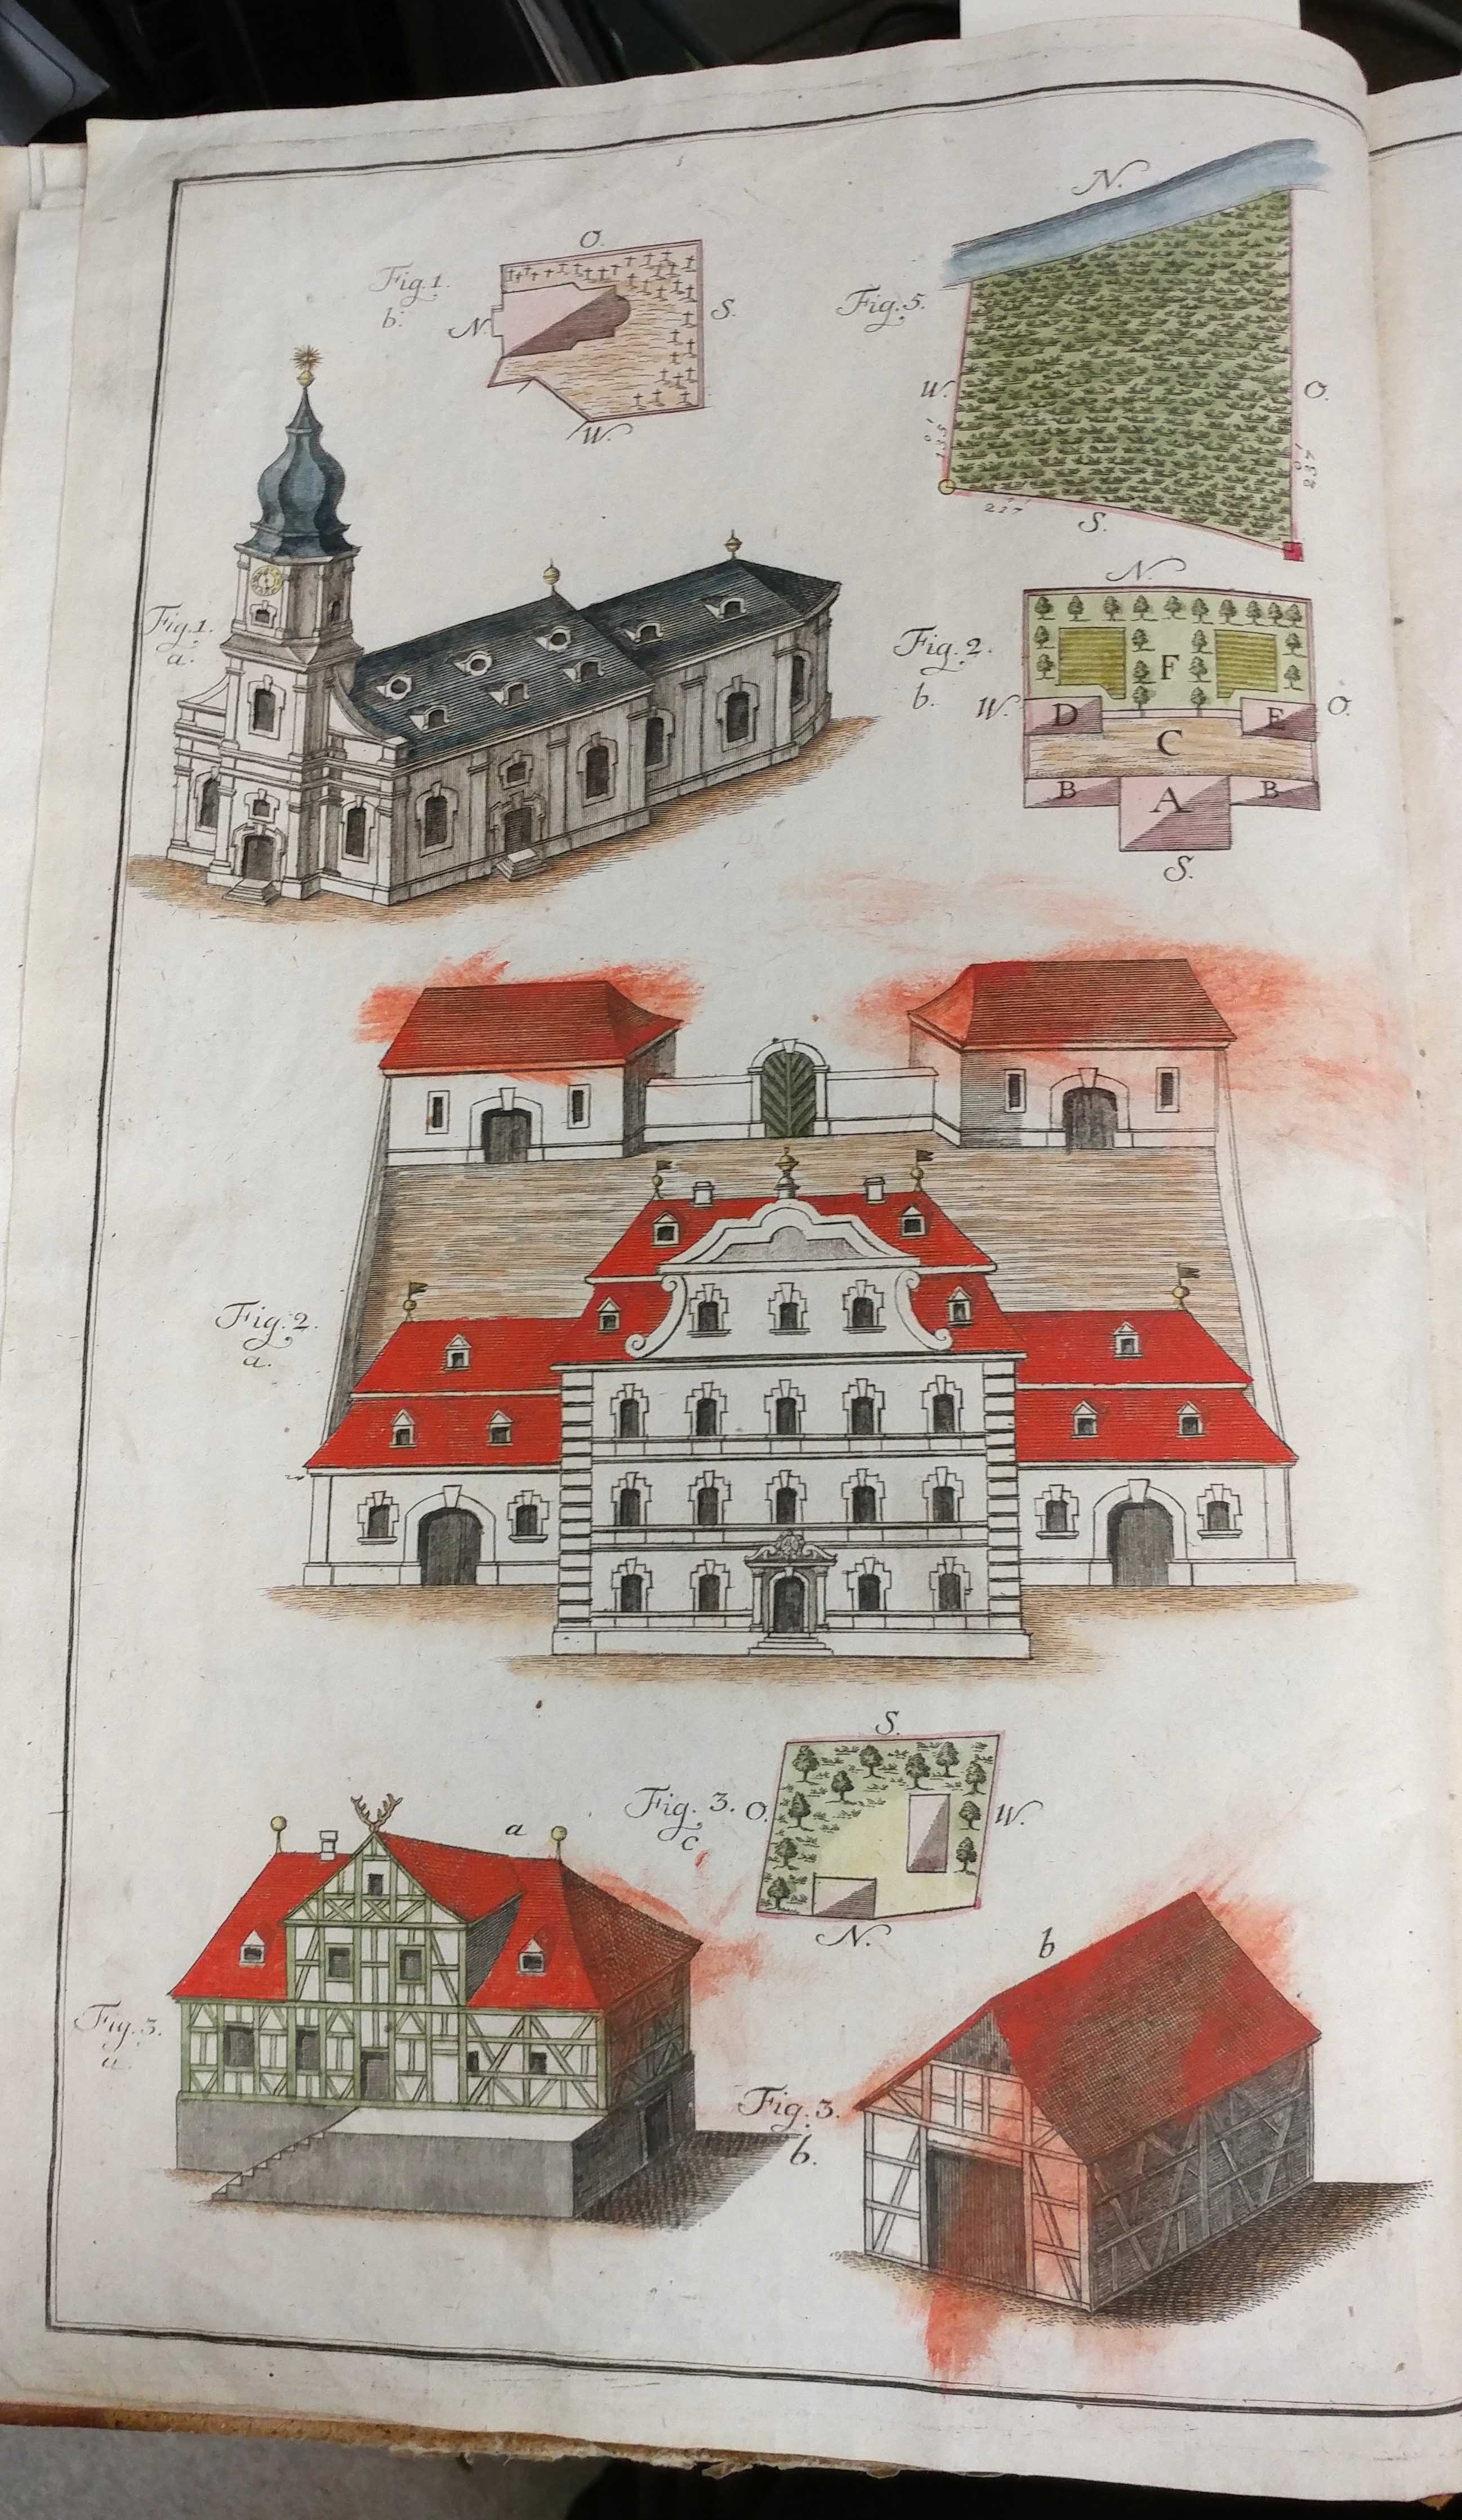
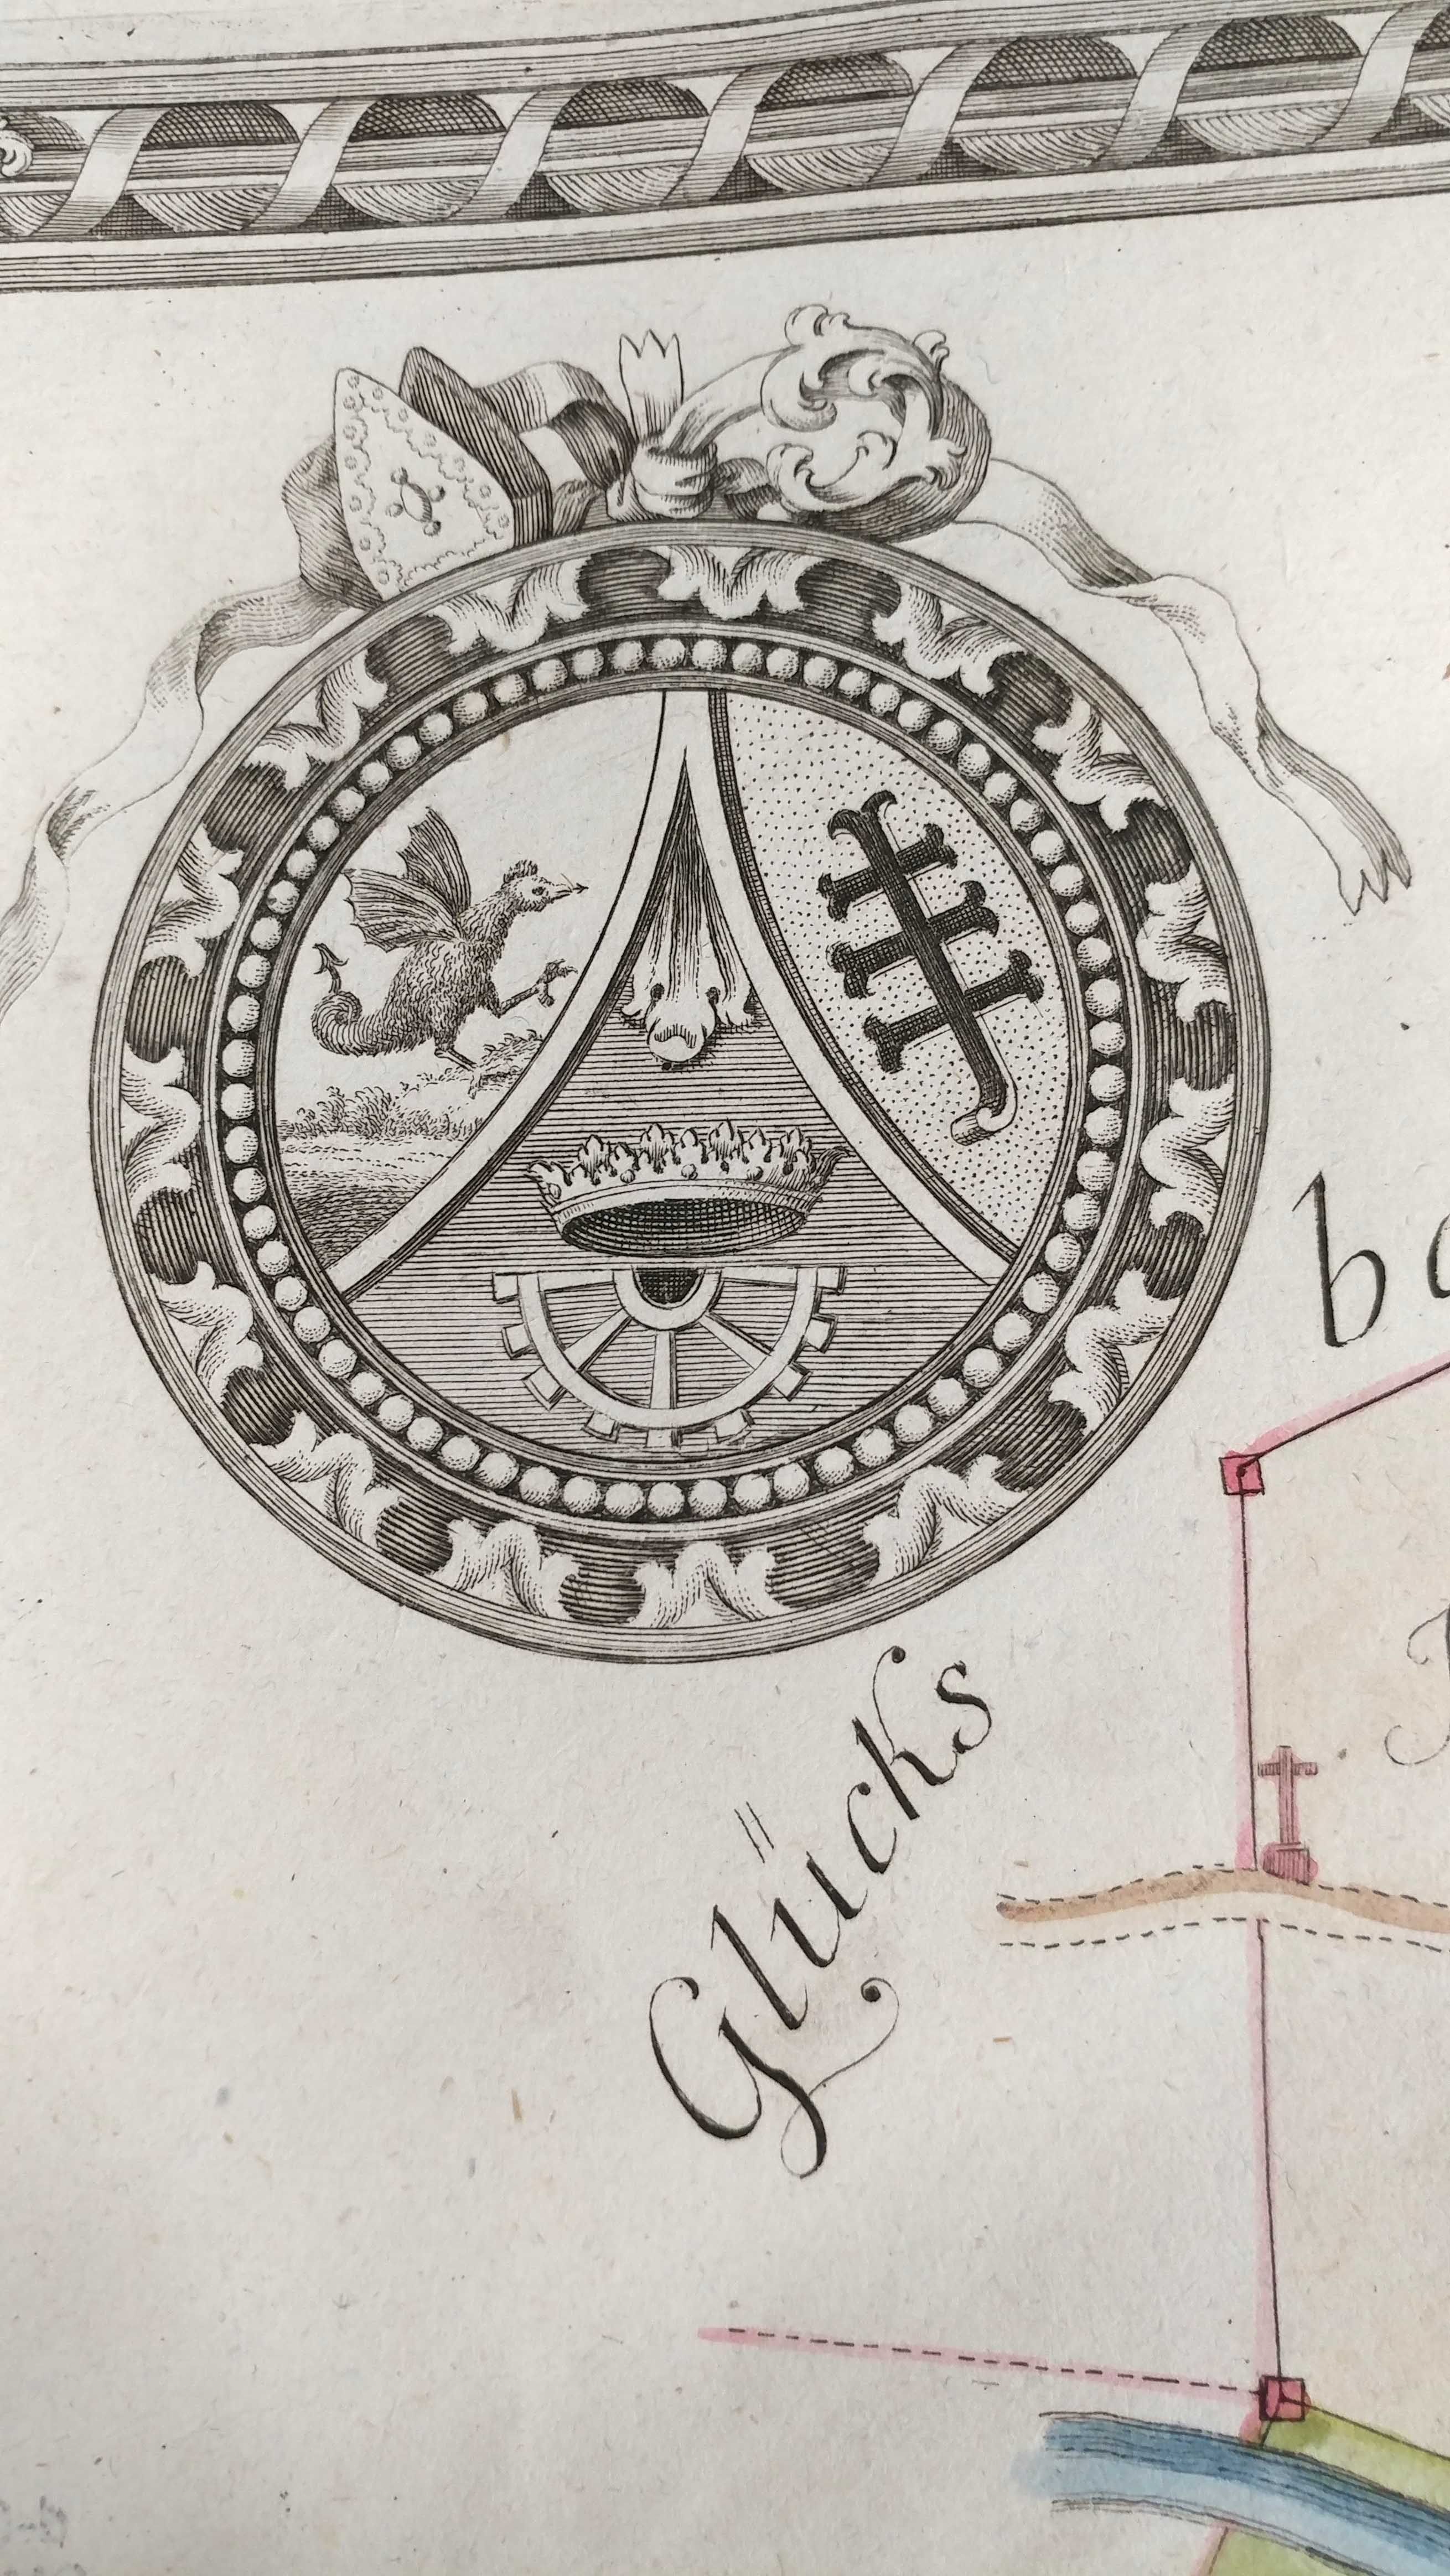
…And now for something different but related. How did a cartographer learn the skills necessary to draw maps? For an example of this we turn to the Practischer Entwurf eines neu zuerrichtenden Urbariums (1792). The book contains practical illustrations of (fictional) maps meant as a “how to” guide for cartographic drawing. This volume contains beautiful colored examples of cartography, but perhaps the most fun are the fictional places depicted on the maps. One map features such locations as Schmaltz Aecker (lard lands), Hader Aecker (discord lands) and a section labeled Anger that despite translating to “green” is actually colored in yellow.
French nautical charts at the AGSL
by Sam Balistreri-Daum
I have been working as an intern here at the American Geographical Society Library for the past few months, and my work is focused on indexing and cataloging 19th and 20th Century nautical charts. These charts originate in various countries consisting of hydrographic surveys from around the globe. This has been an amazing project to be involved with and I would like to share my progress on the French nautical charts created by the Service hydrographique de la Marine and its predecessor, the Dépôt des cartes et plans de la Marine.
The Service hydrographique de la Marine (today the Service hydrographique et océanographique de la Marine or SHOM) is an office of the French Ministry of Defense, established in 1720. While there are obvious military and strategic implications for the creation of detailed nautical charts, the Service Hydrographique also provided a public service by making accurate charts available to navigators sailing for business and recreation. (Wikipedia) The collection of French nautical charts at the AGSL features charts from around the world including South and Central America, Southeast Asia, Africa, the Polar Regions, the Pacific Islands and Europe as well as world maps and various tidal and atmospheric charts.
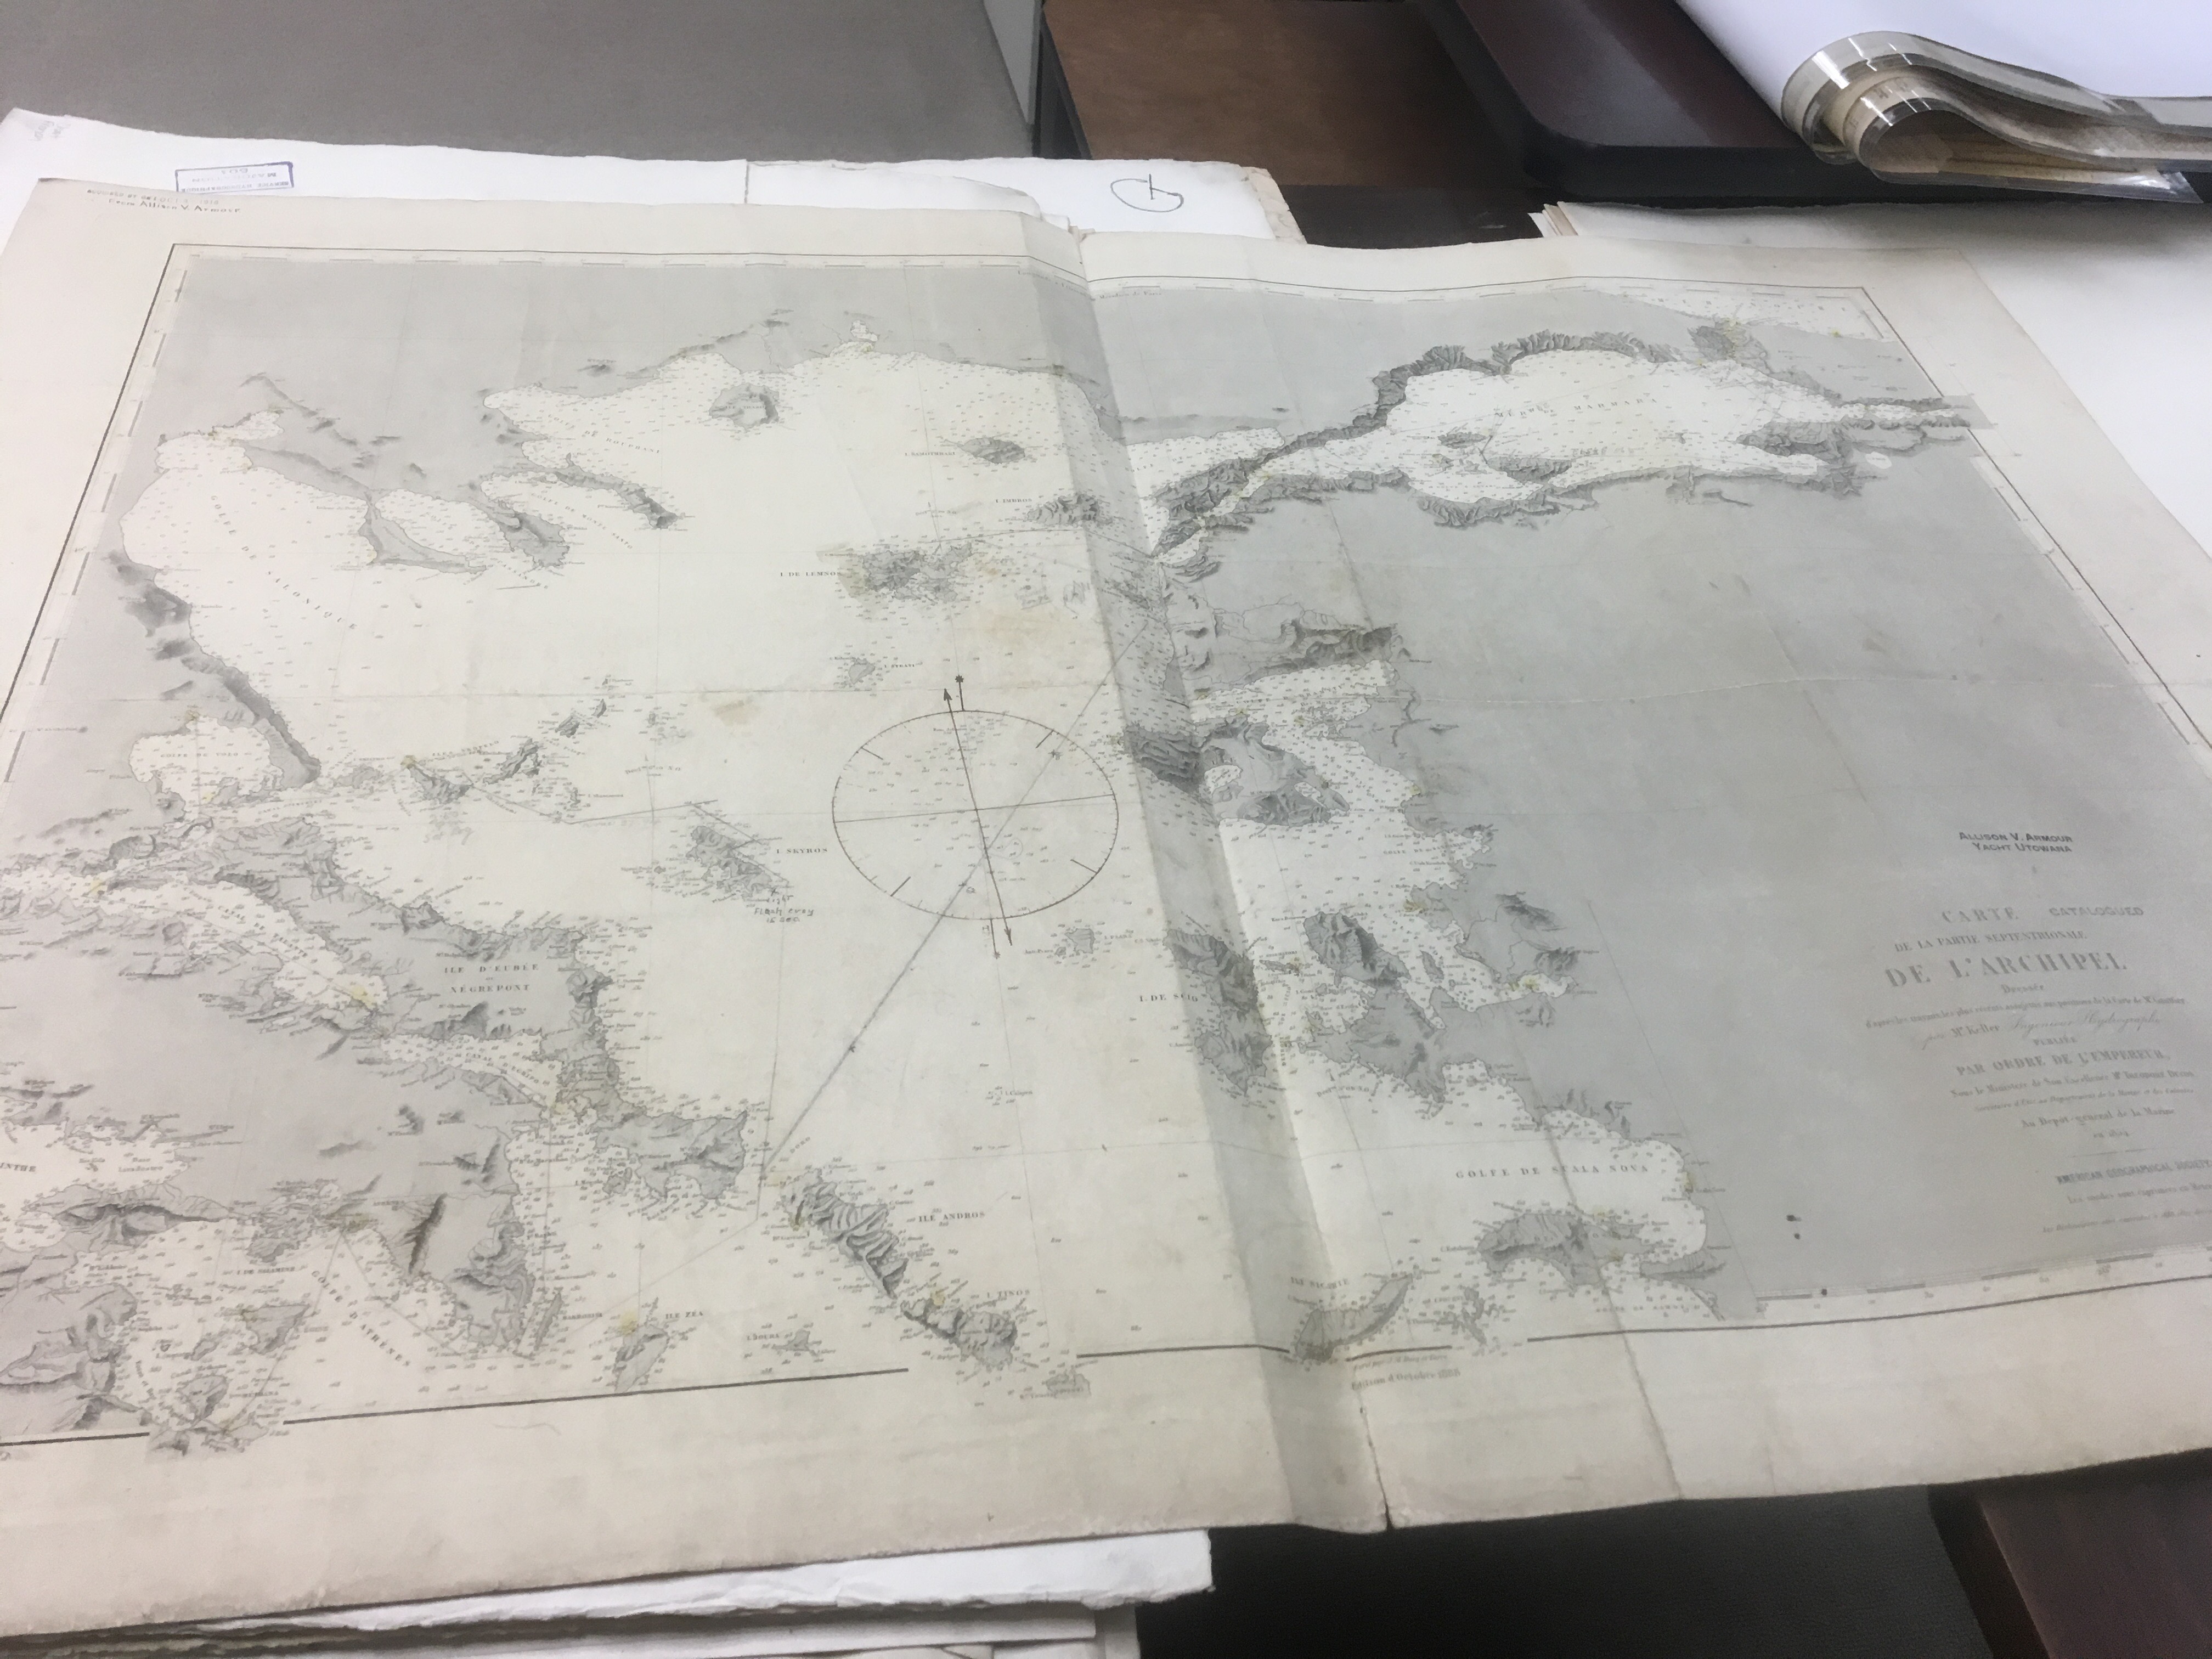
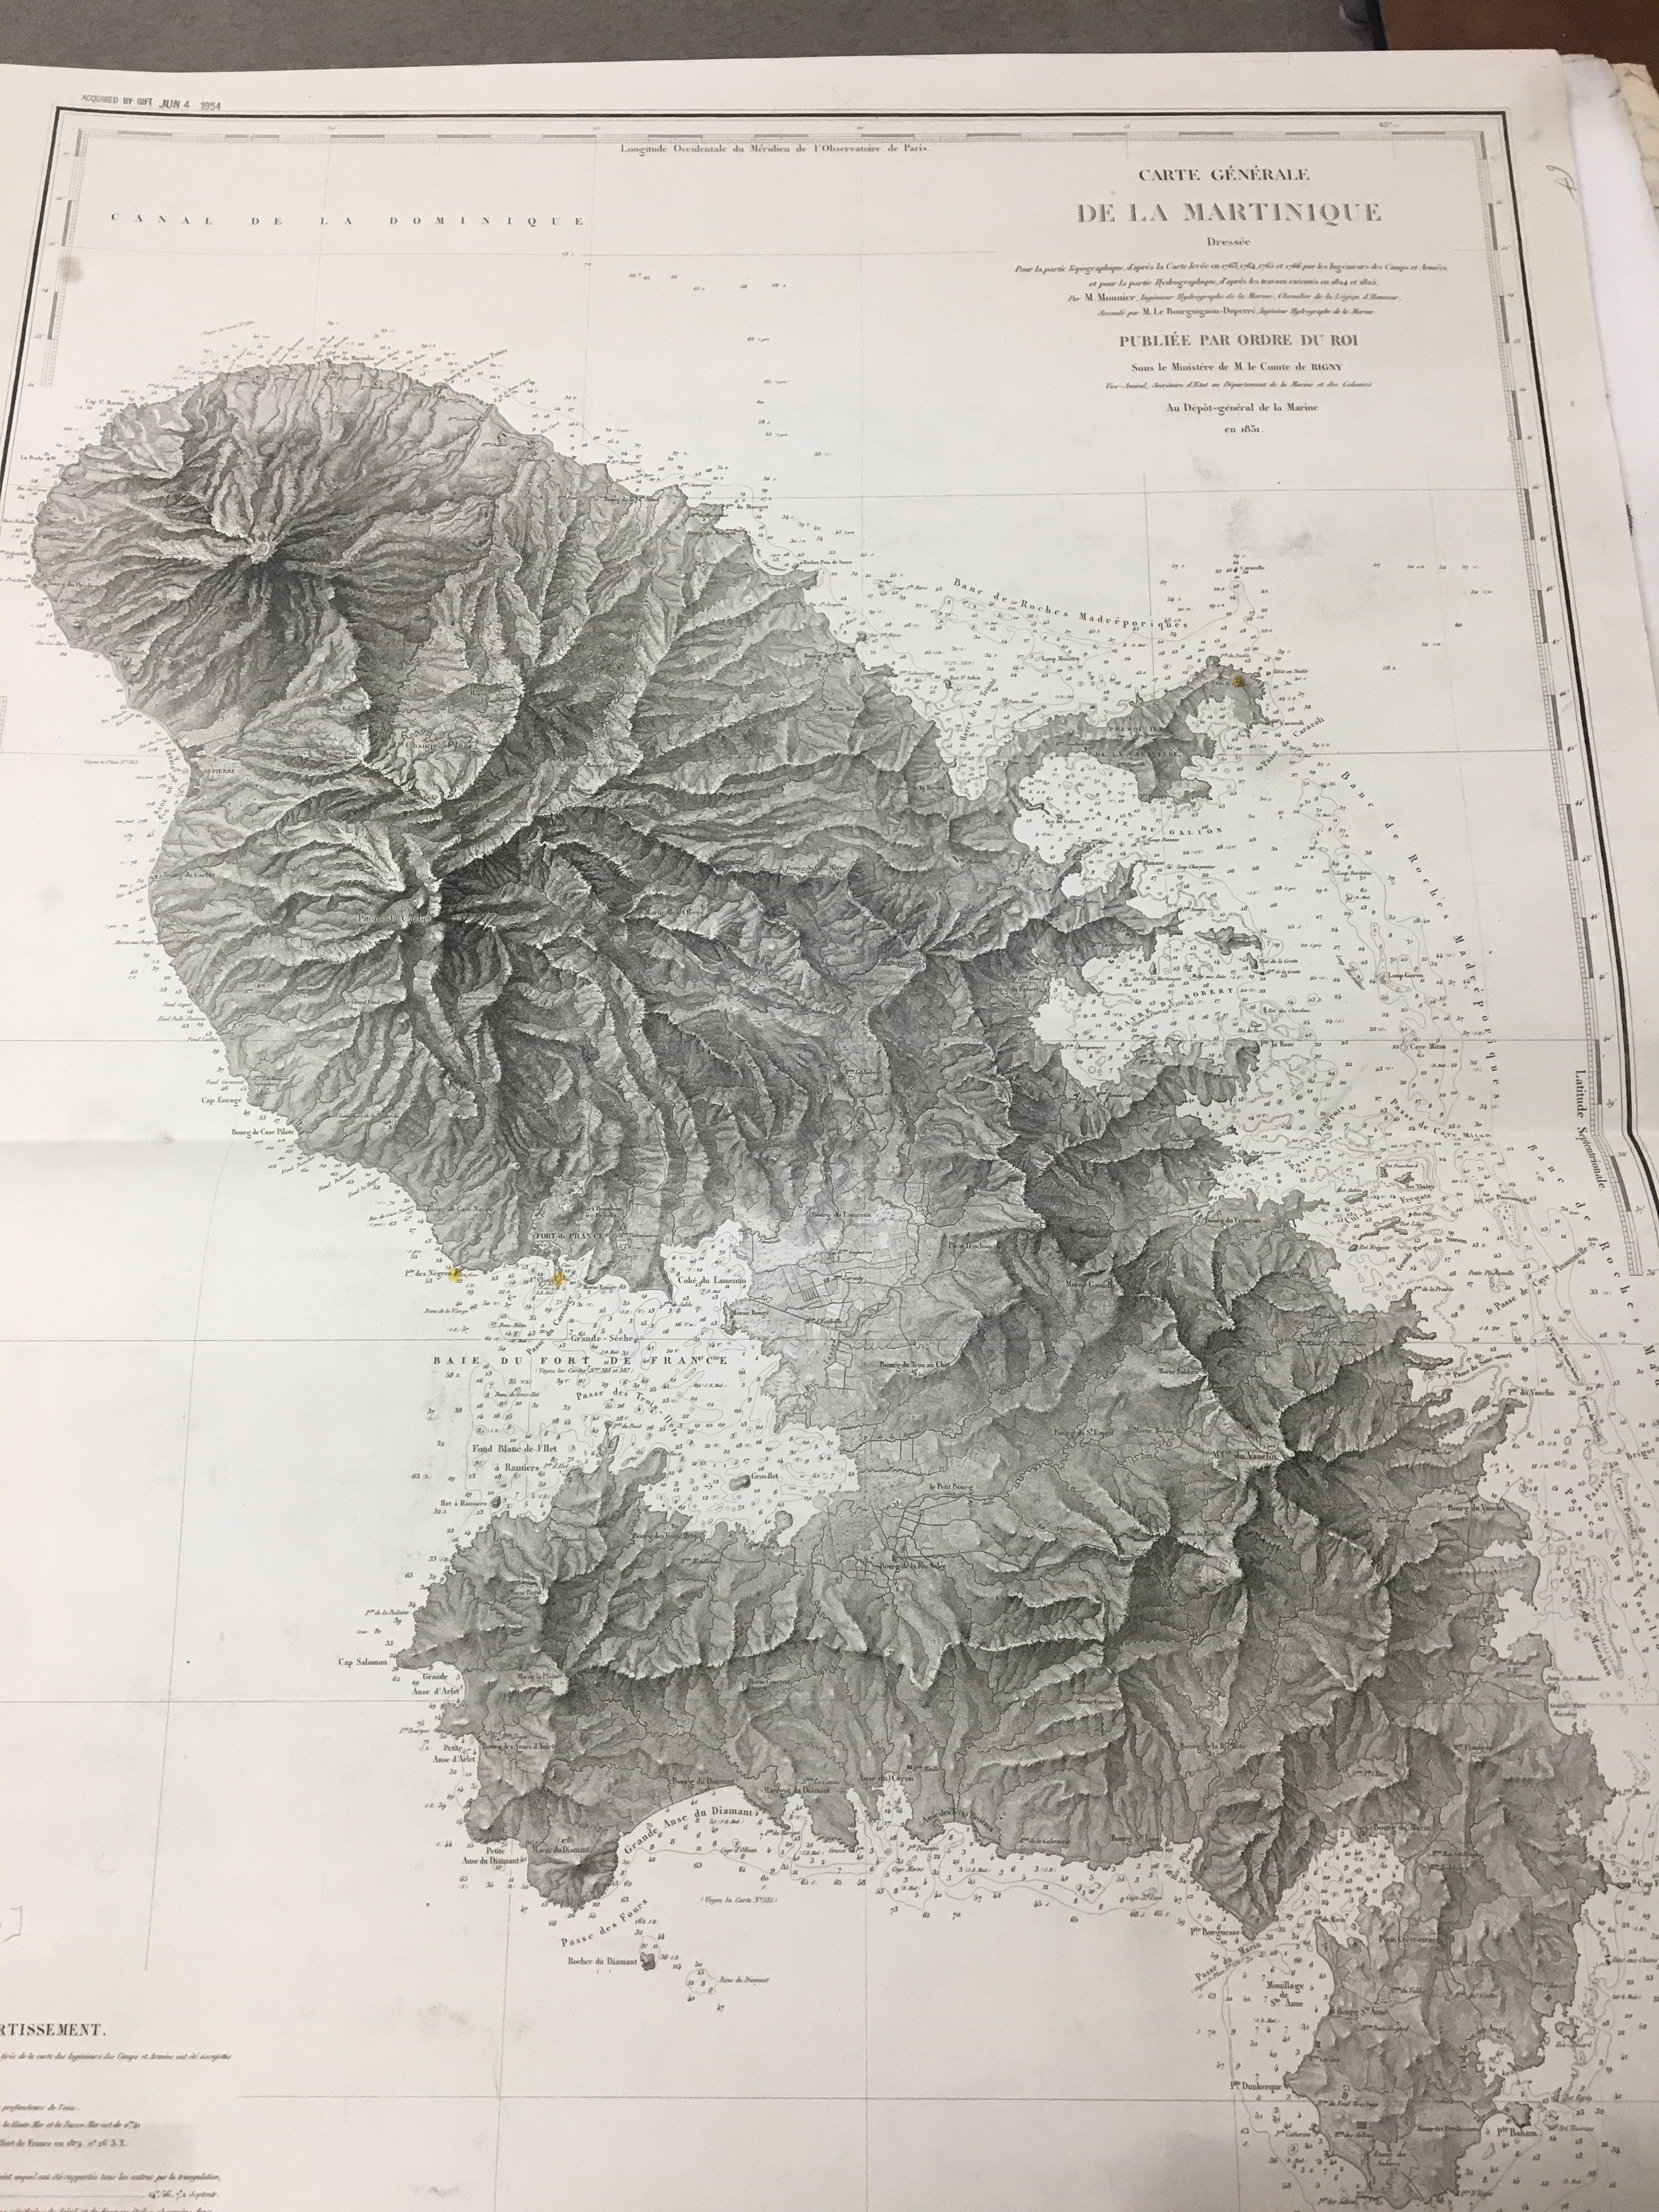
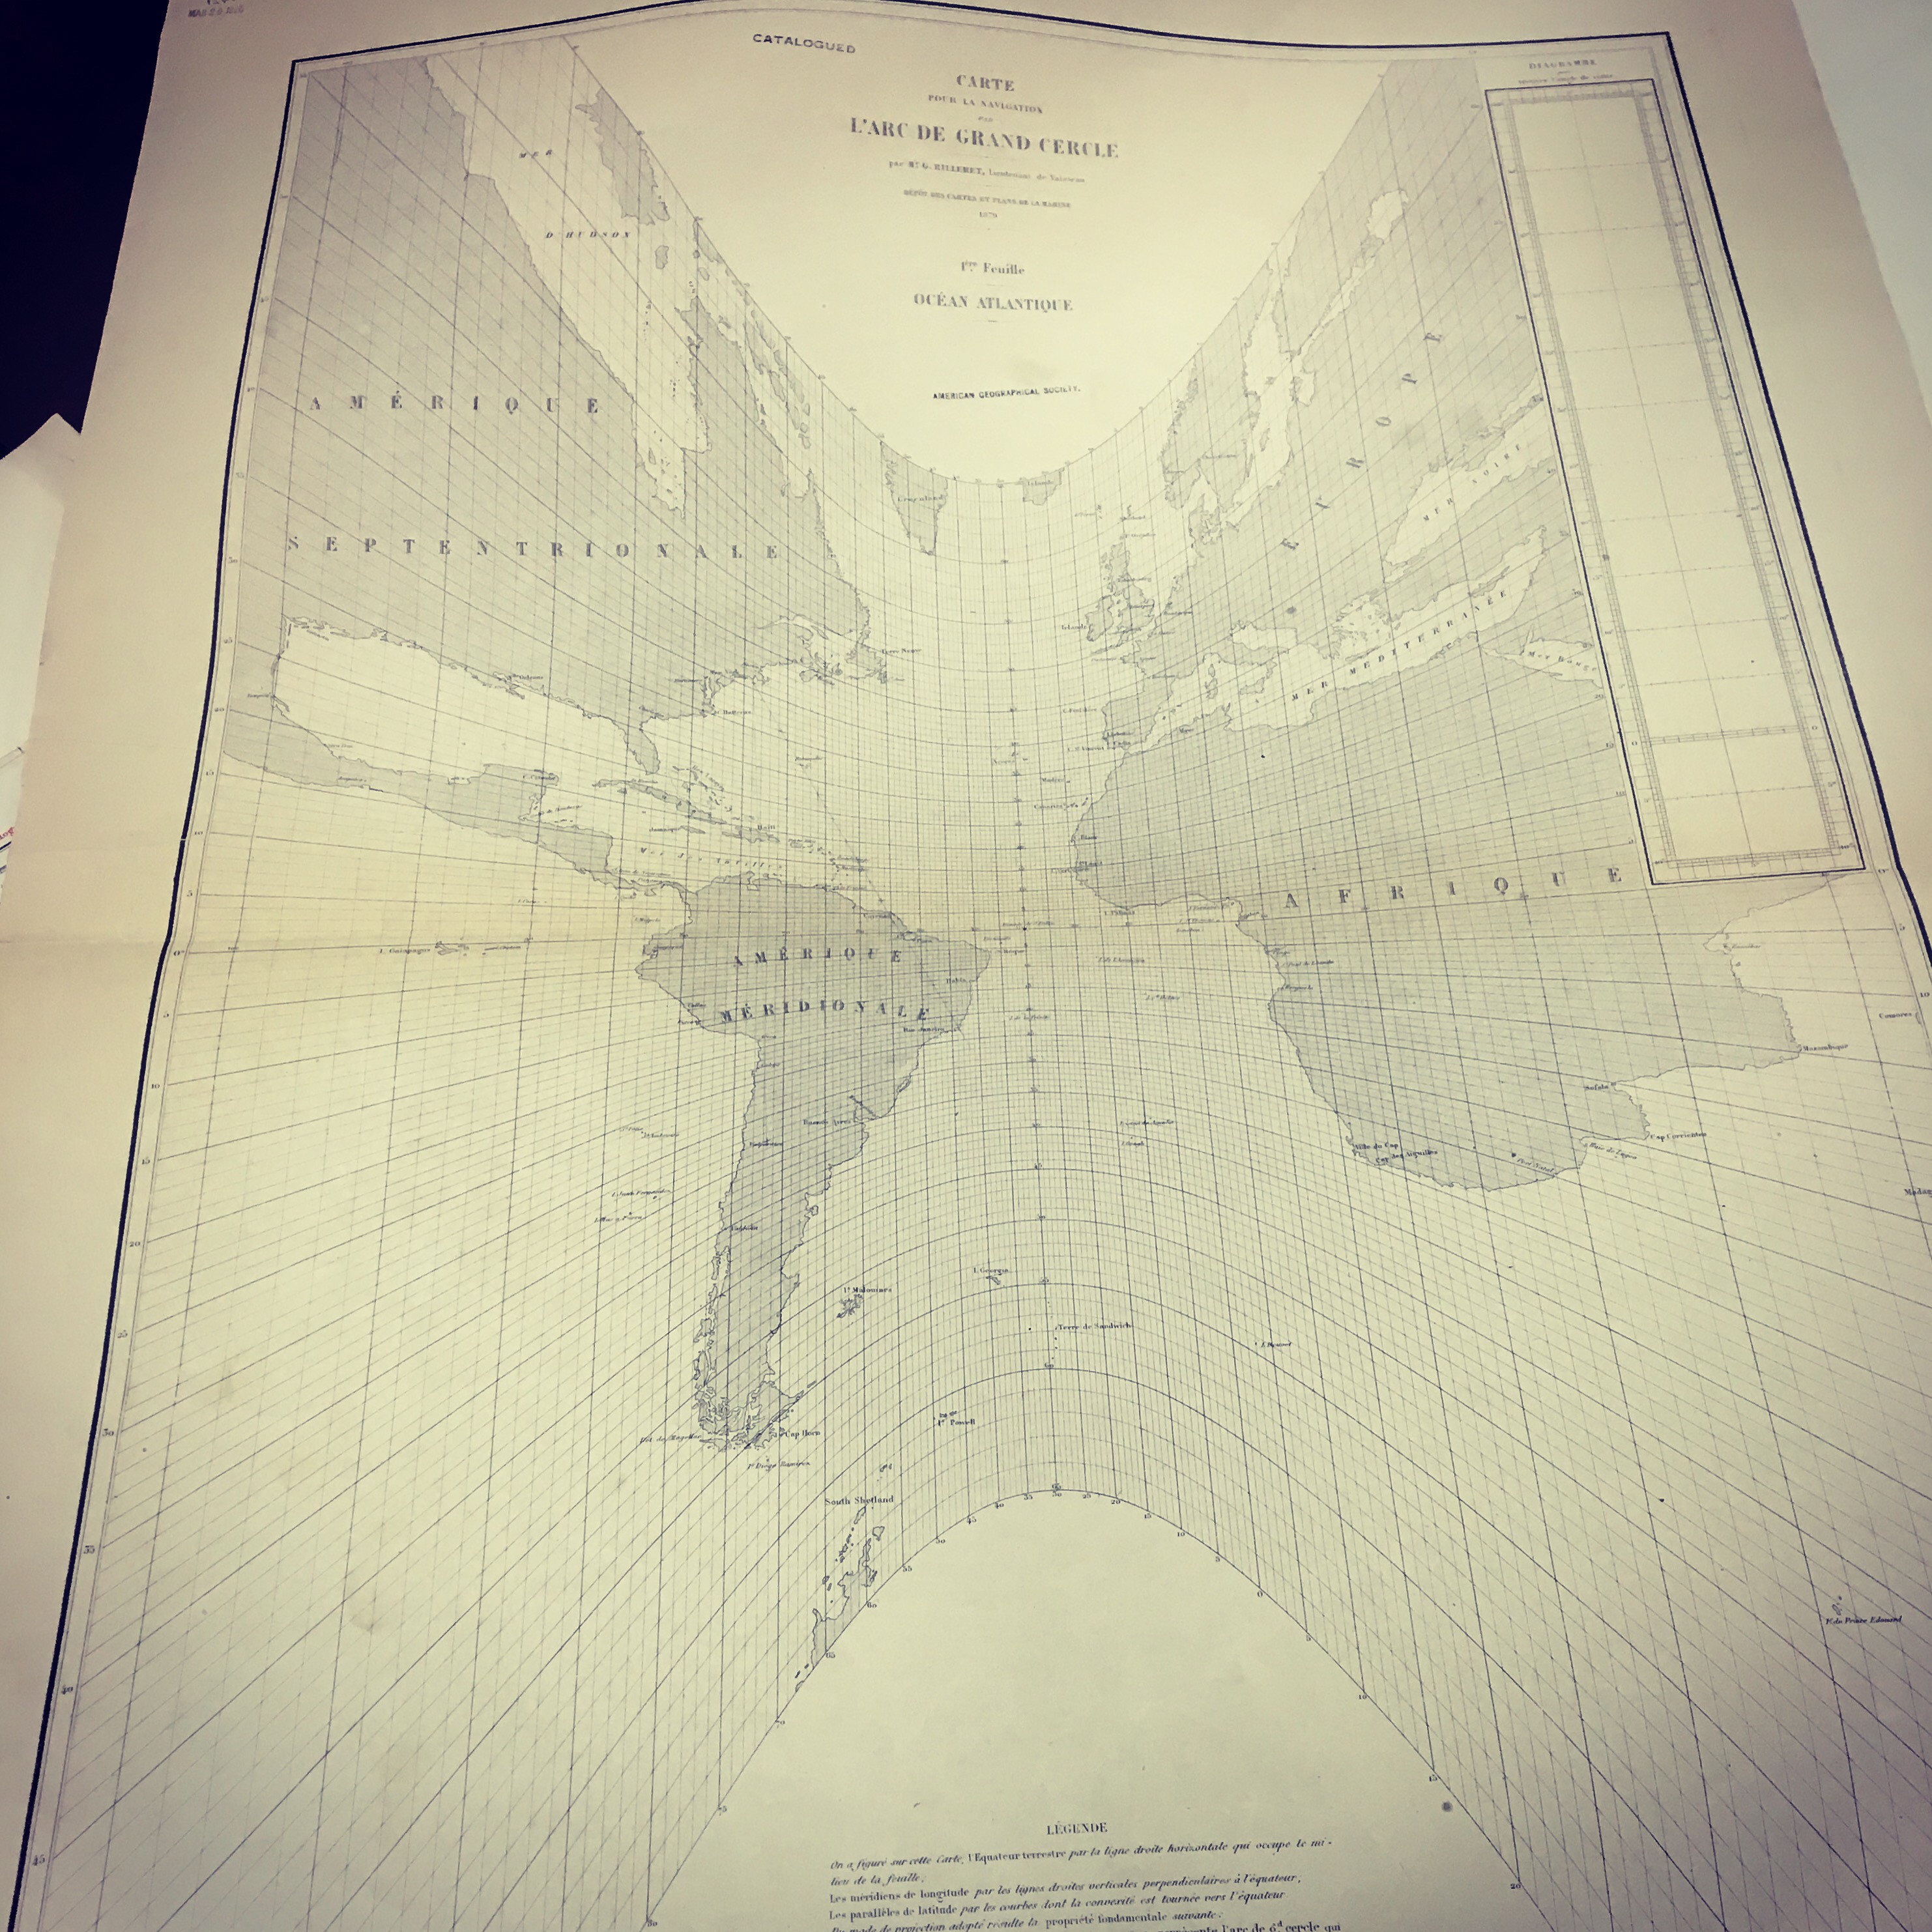
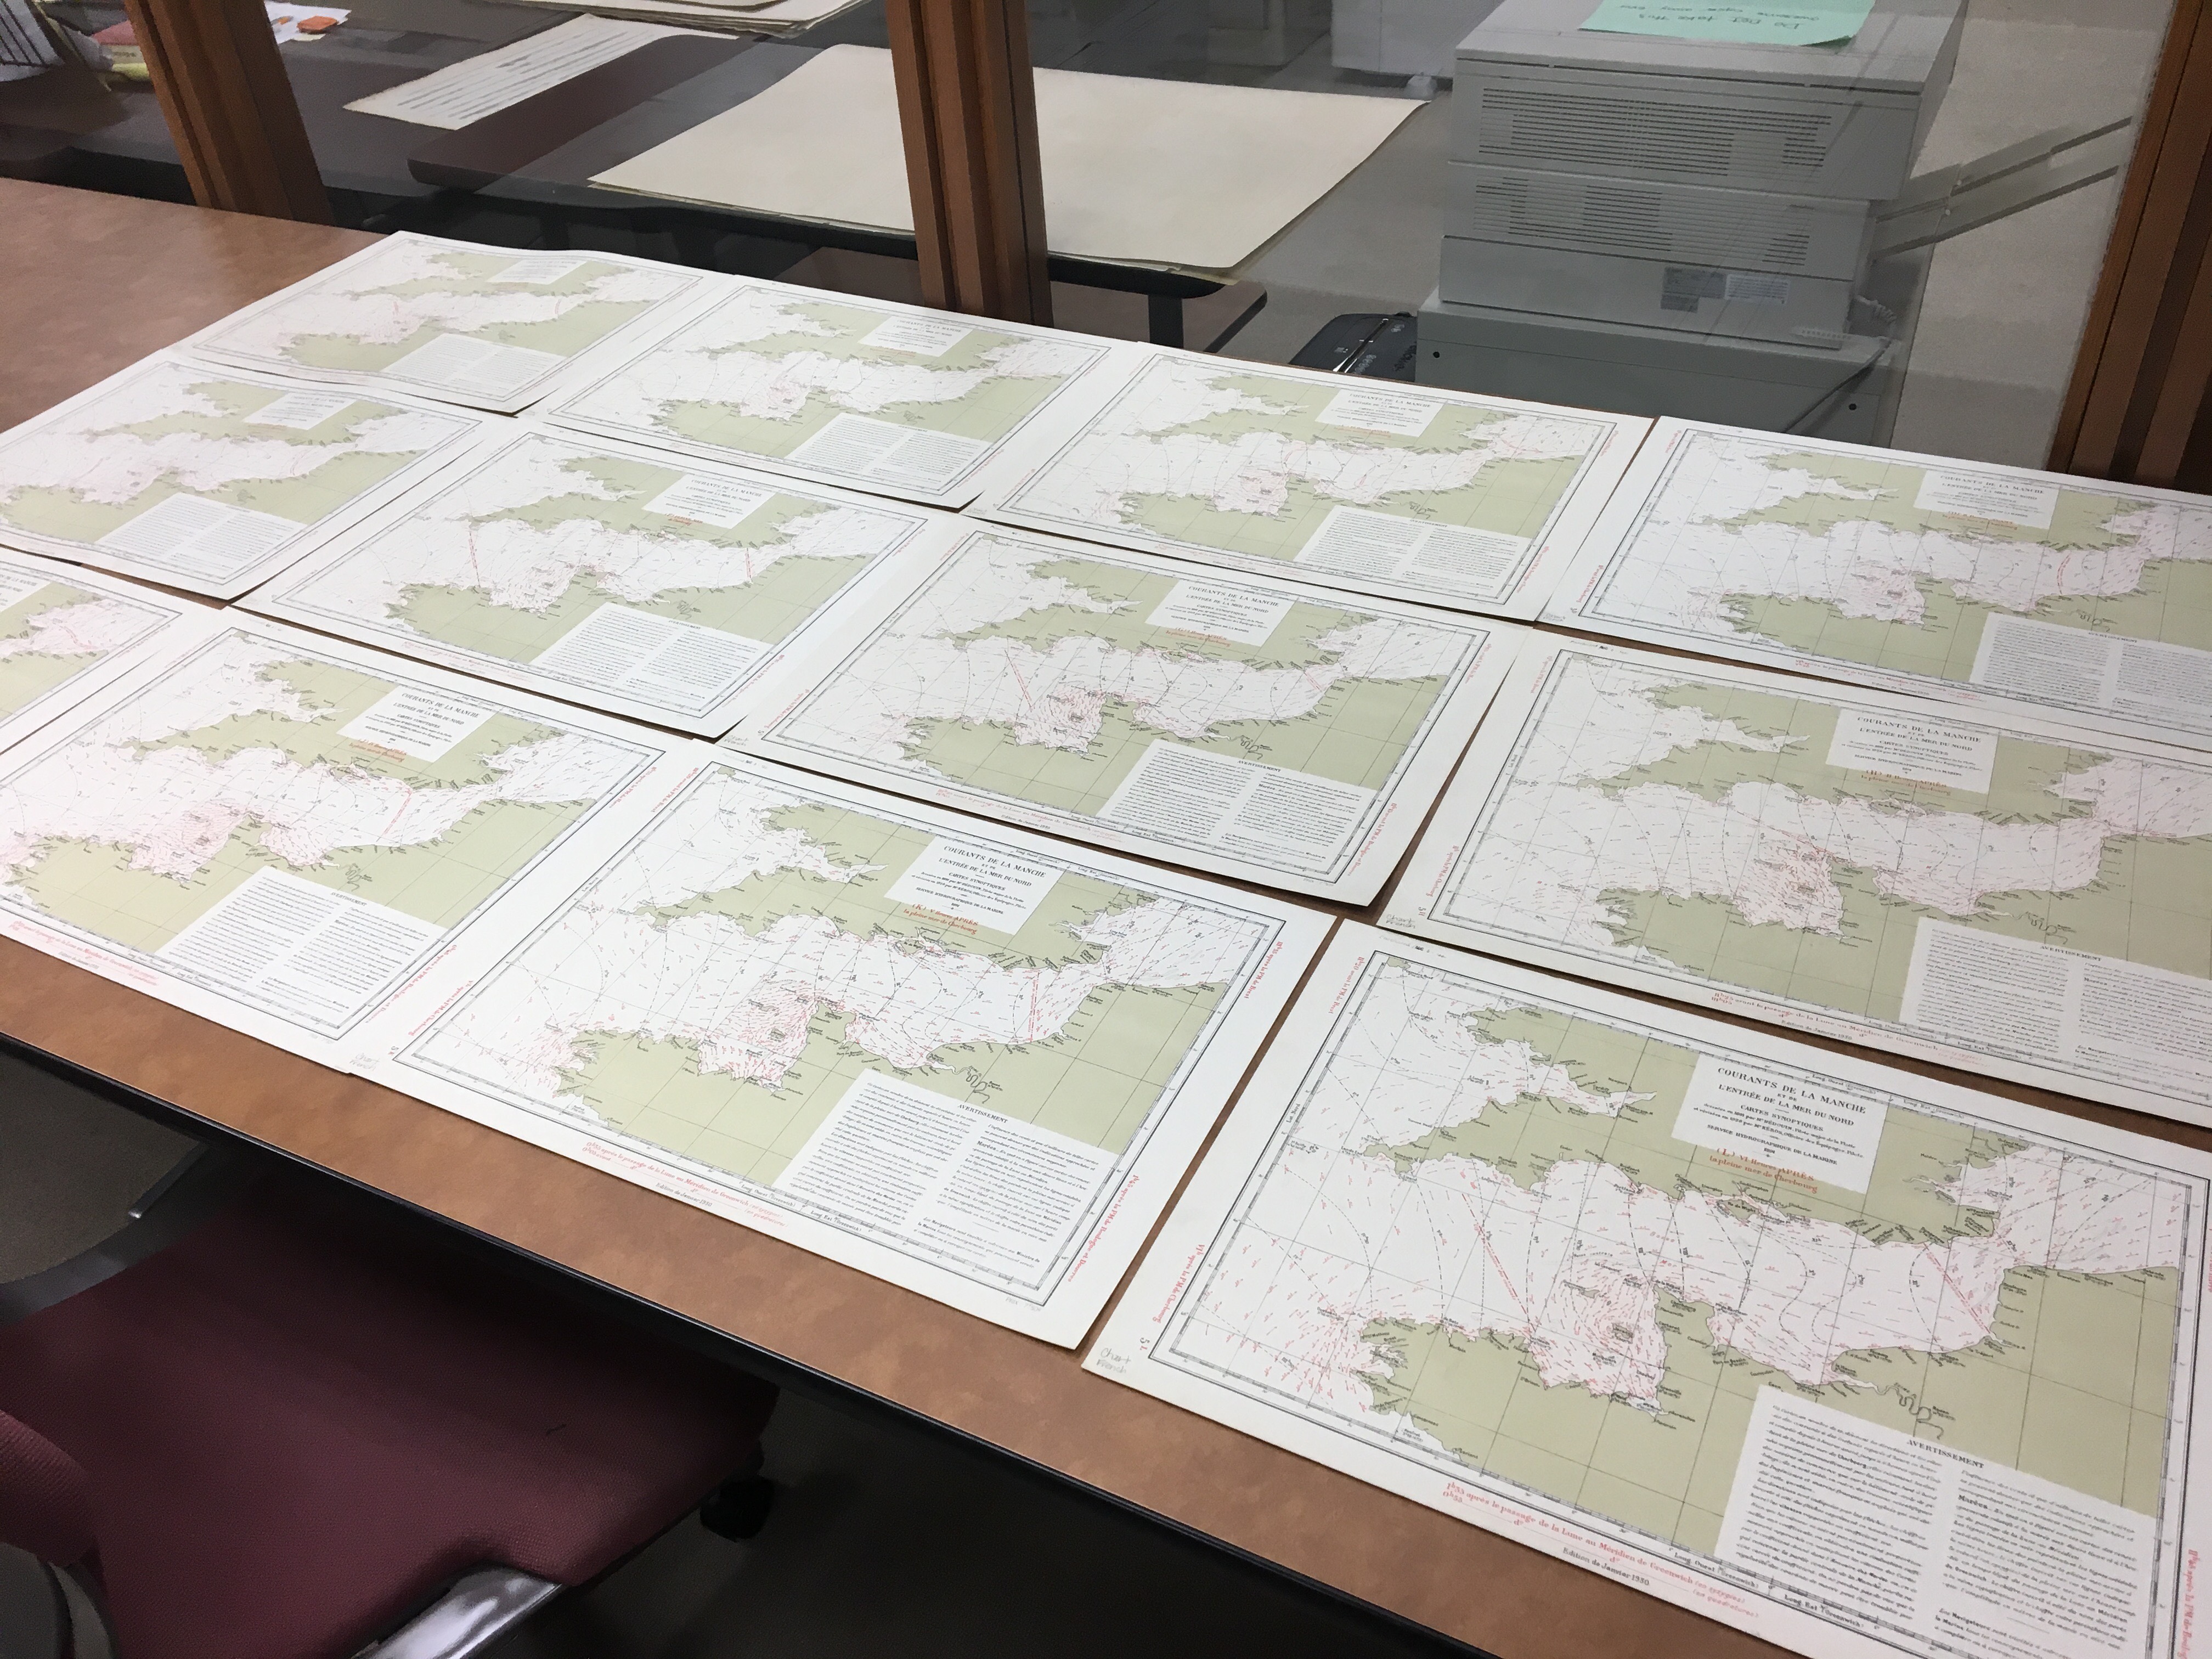
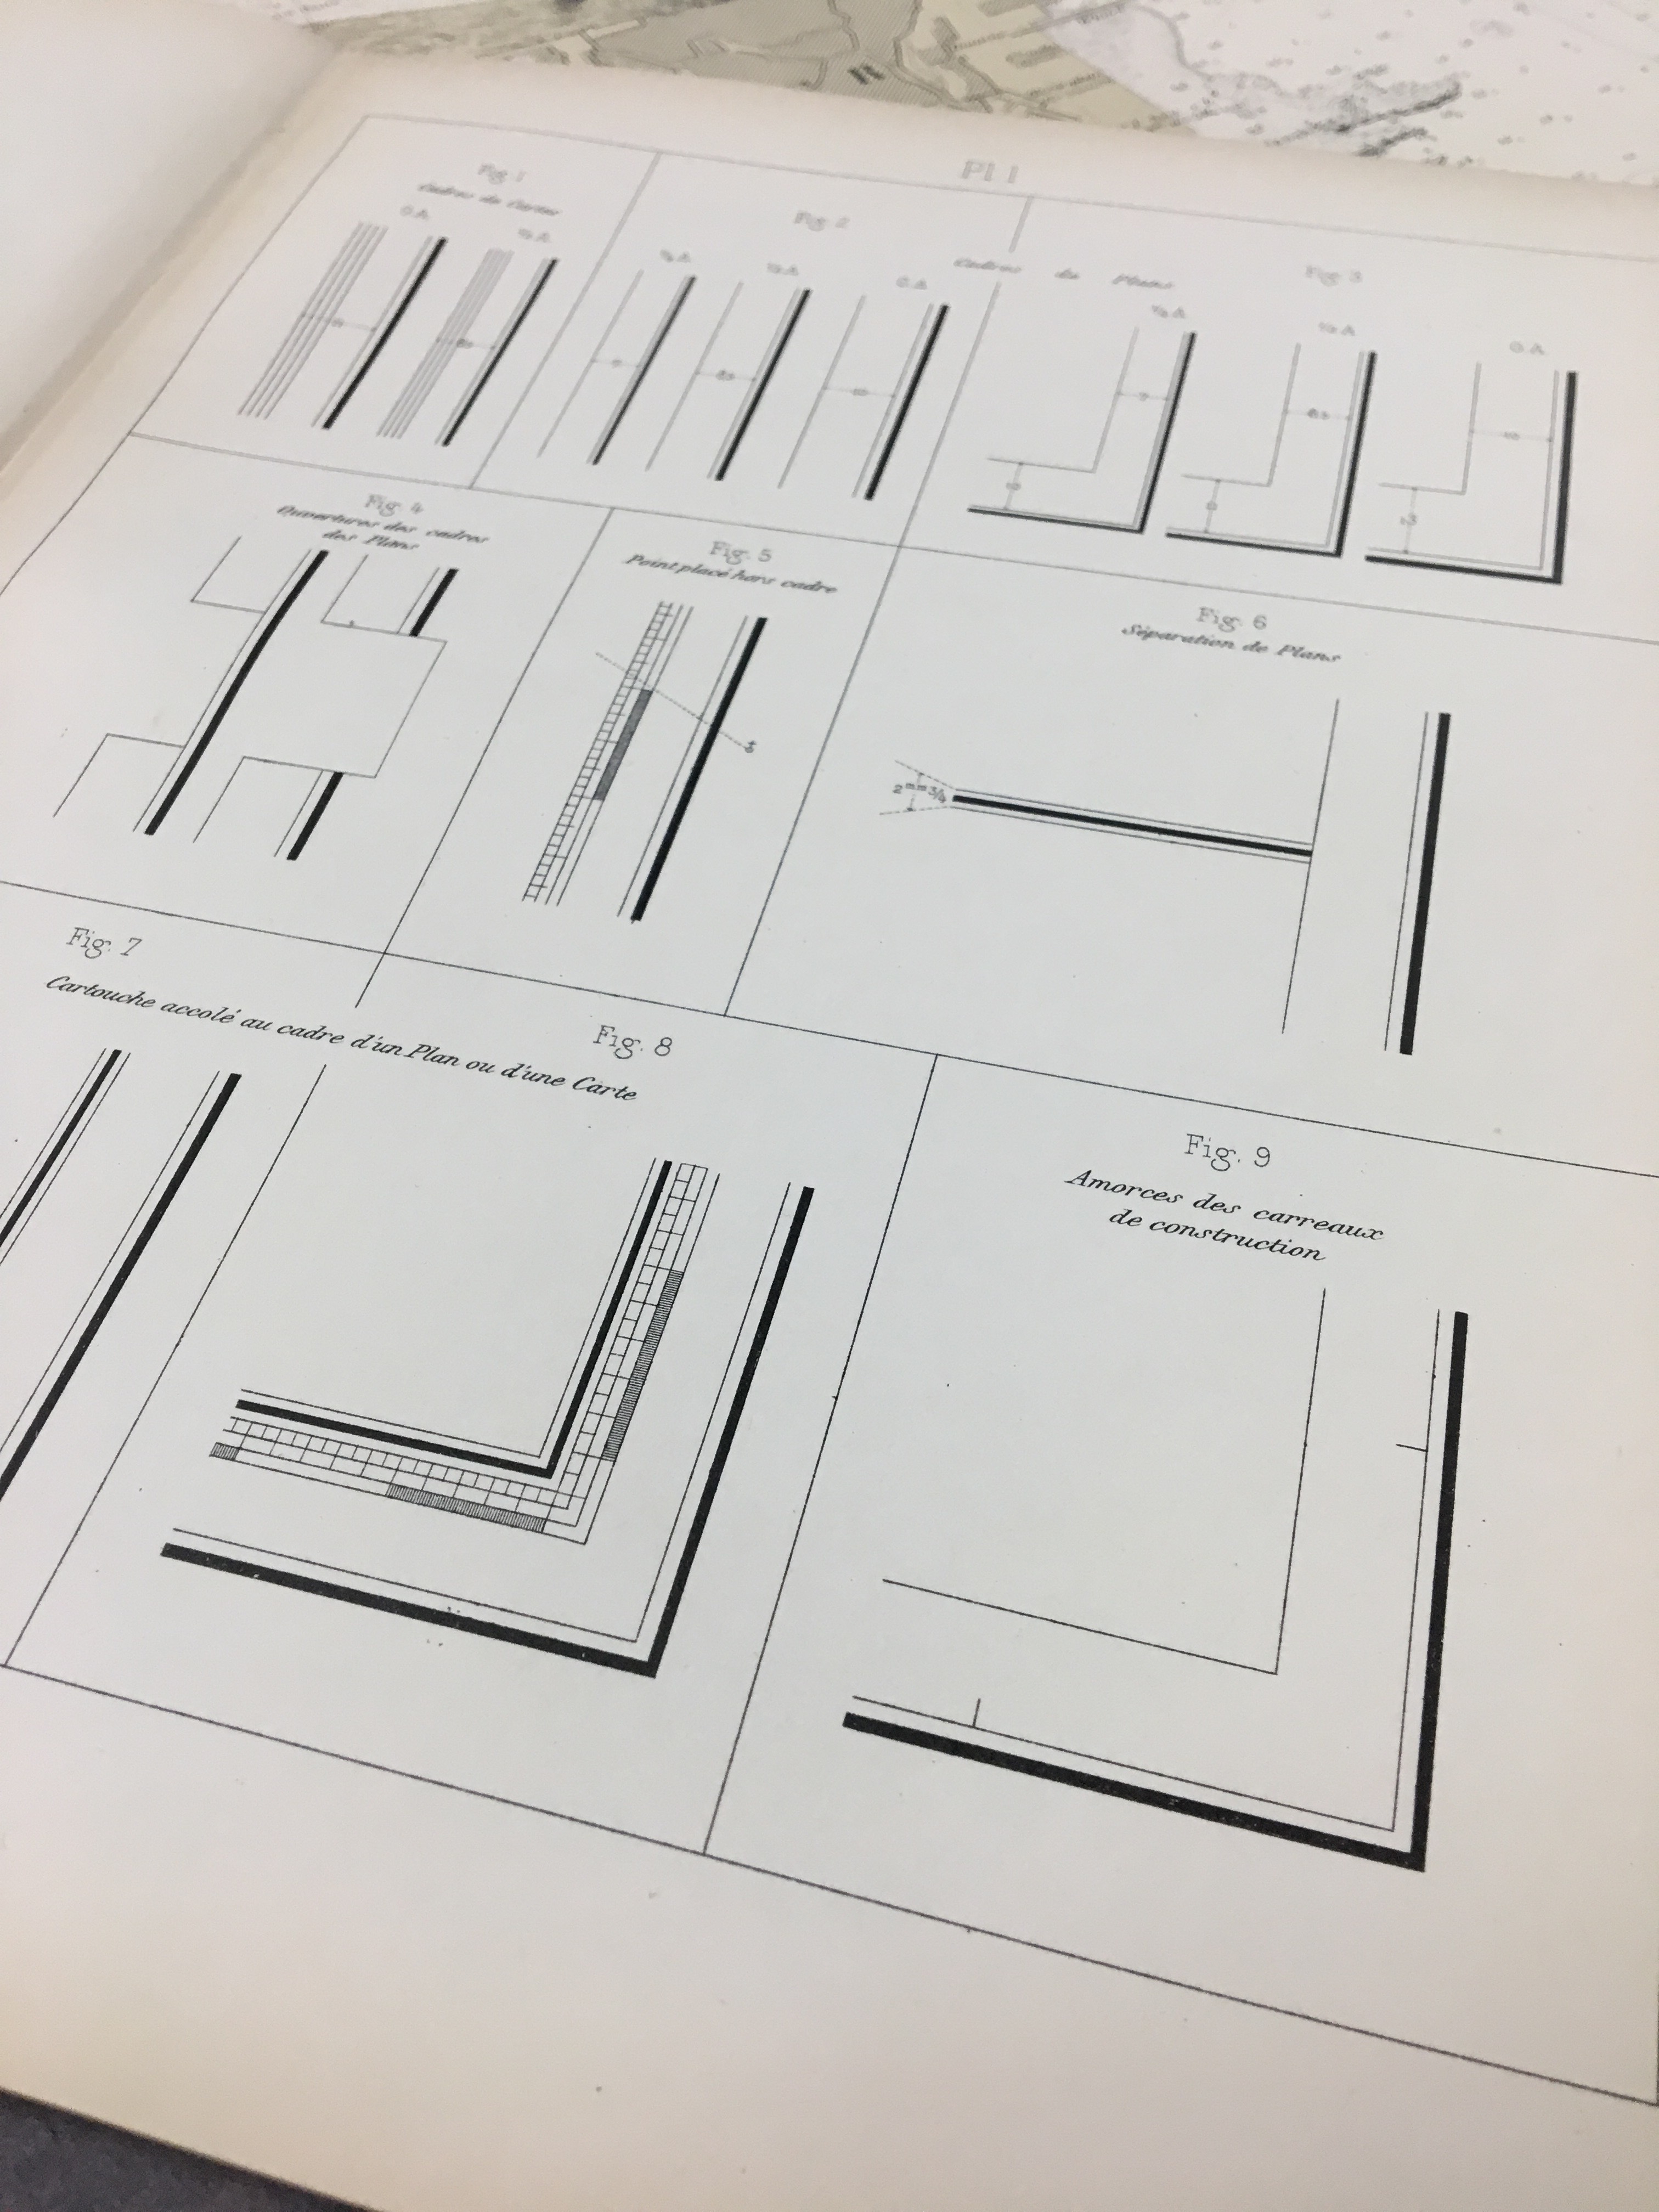
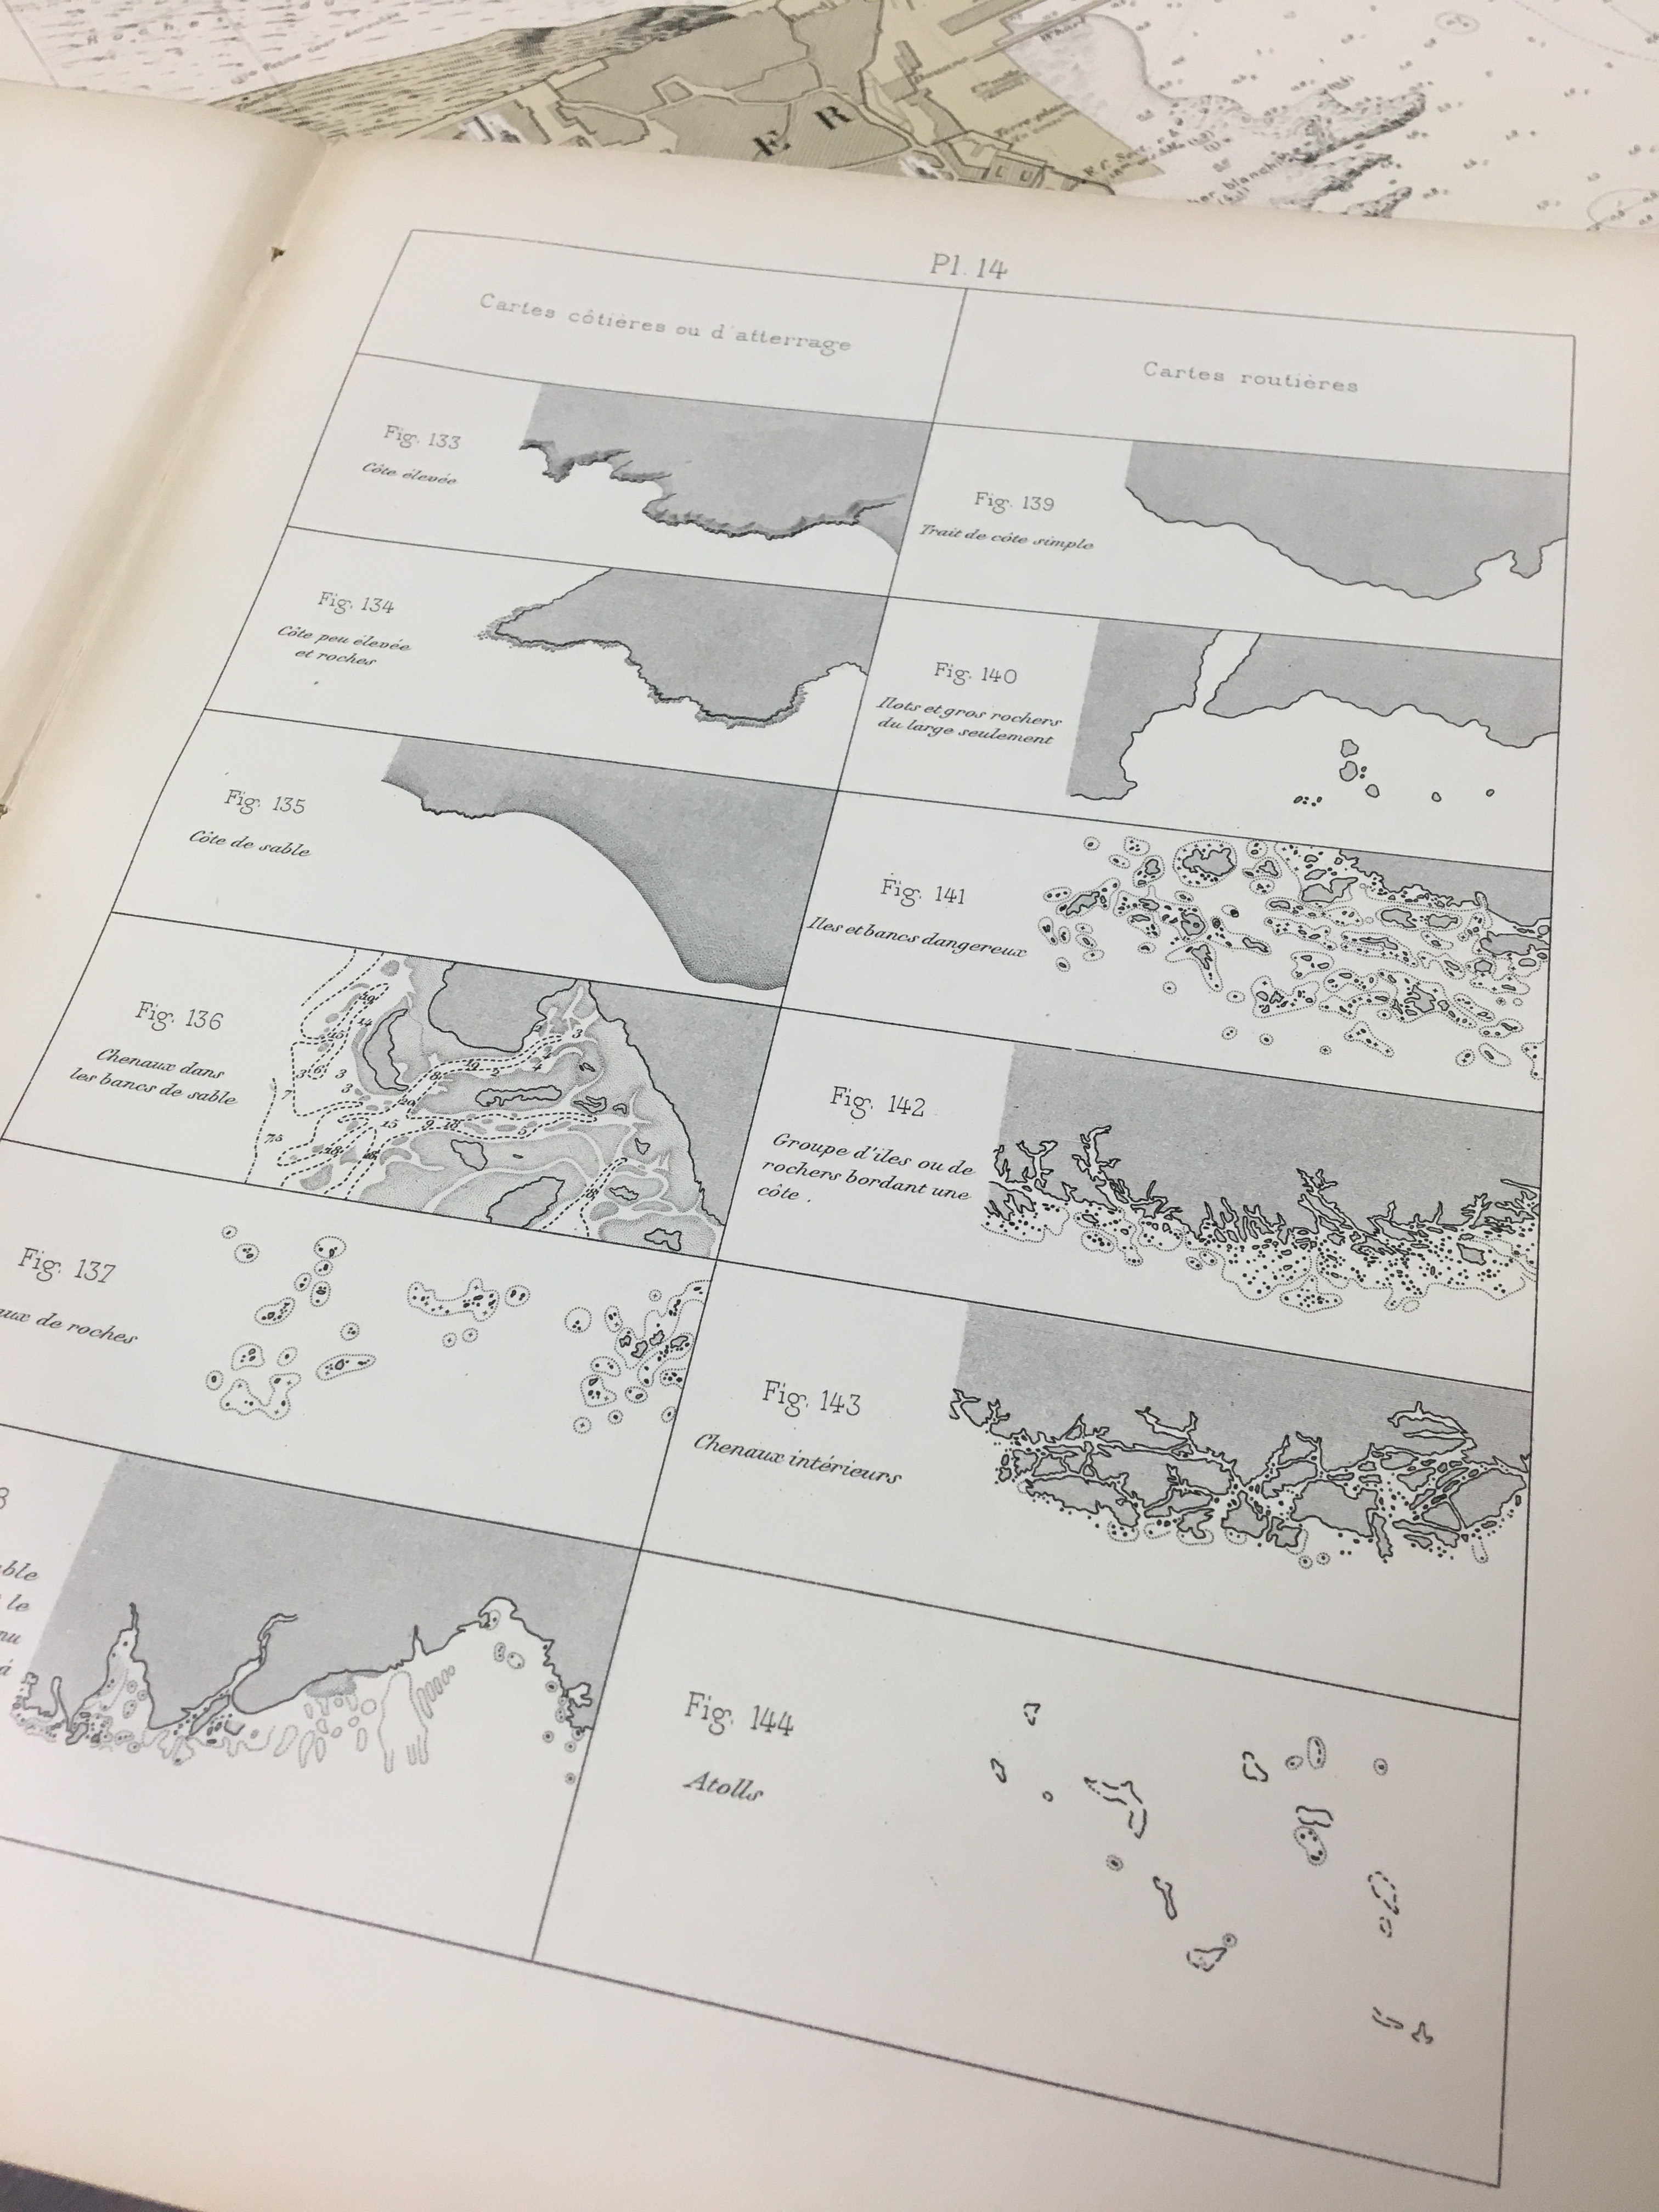
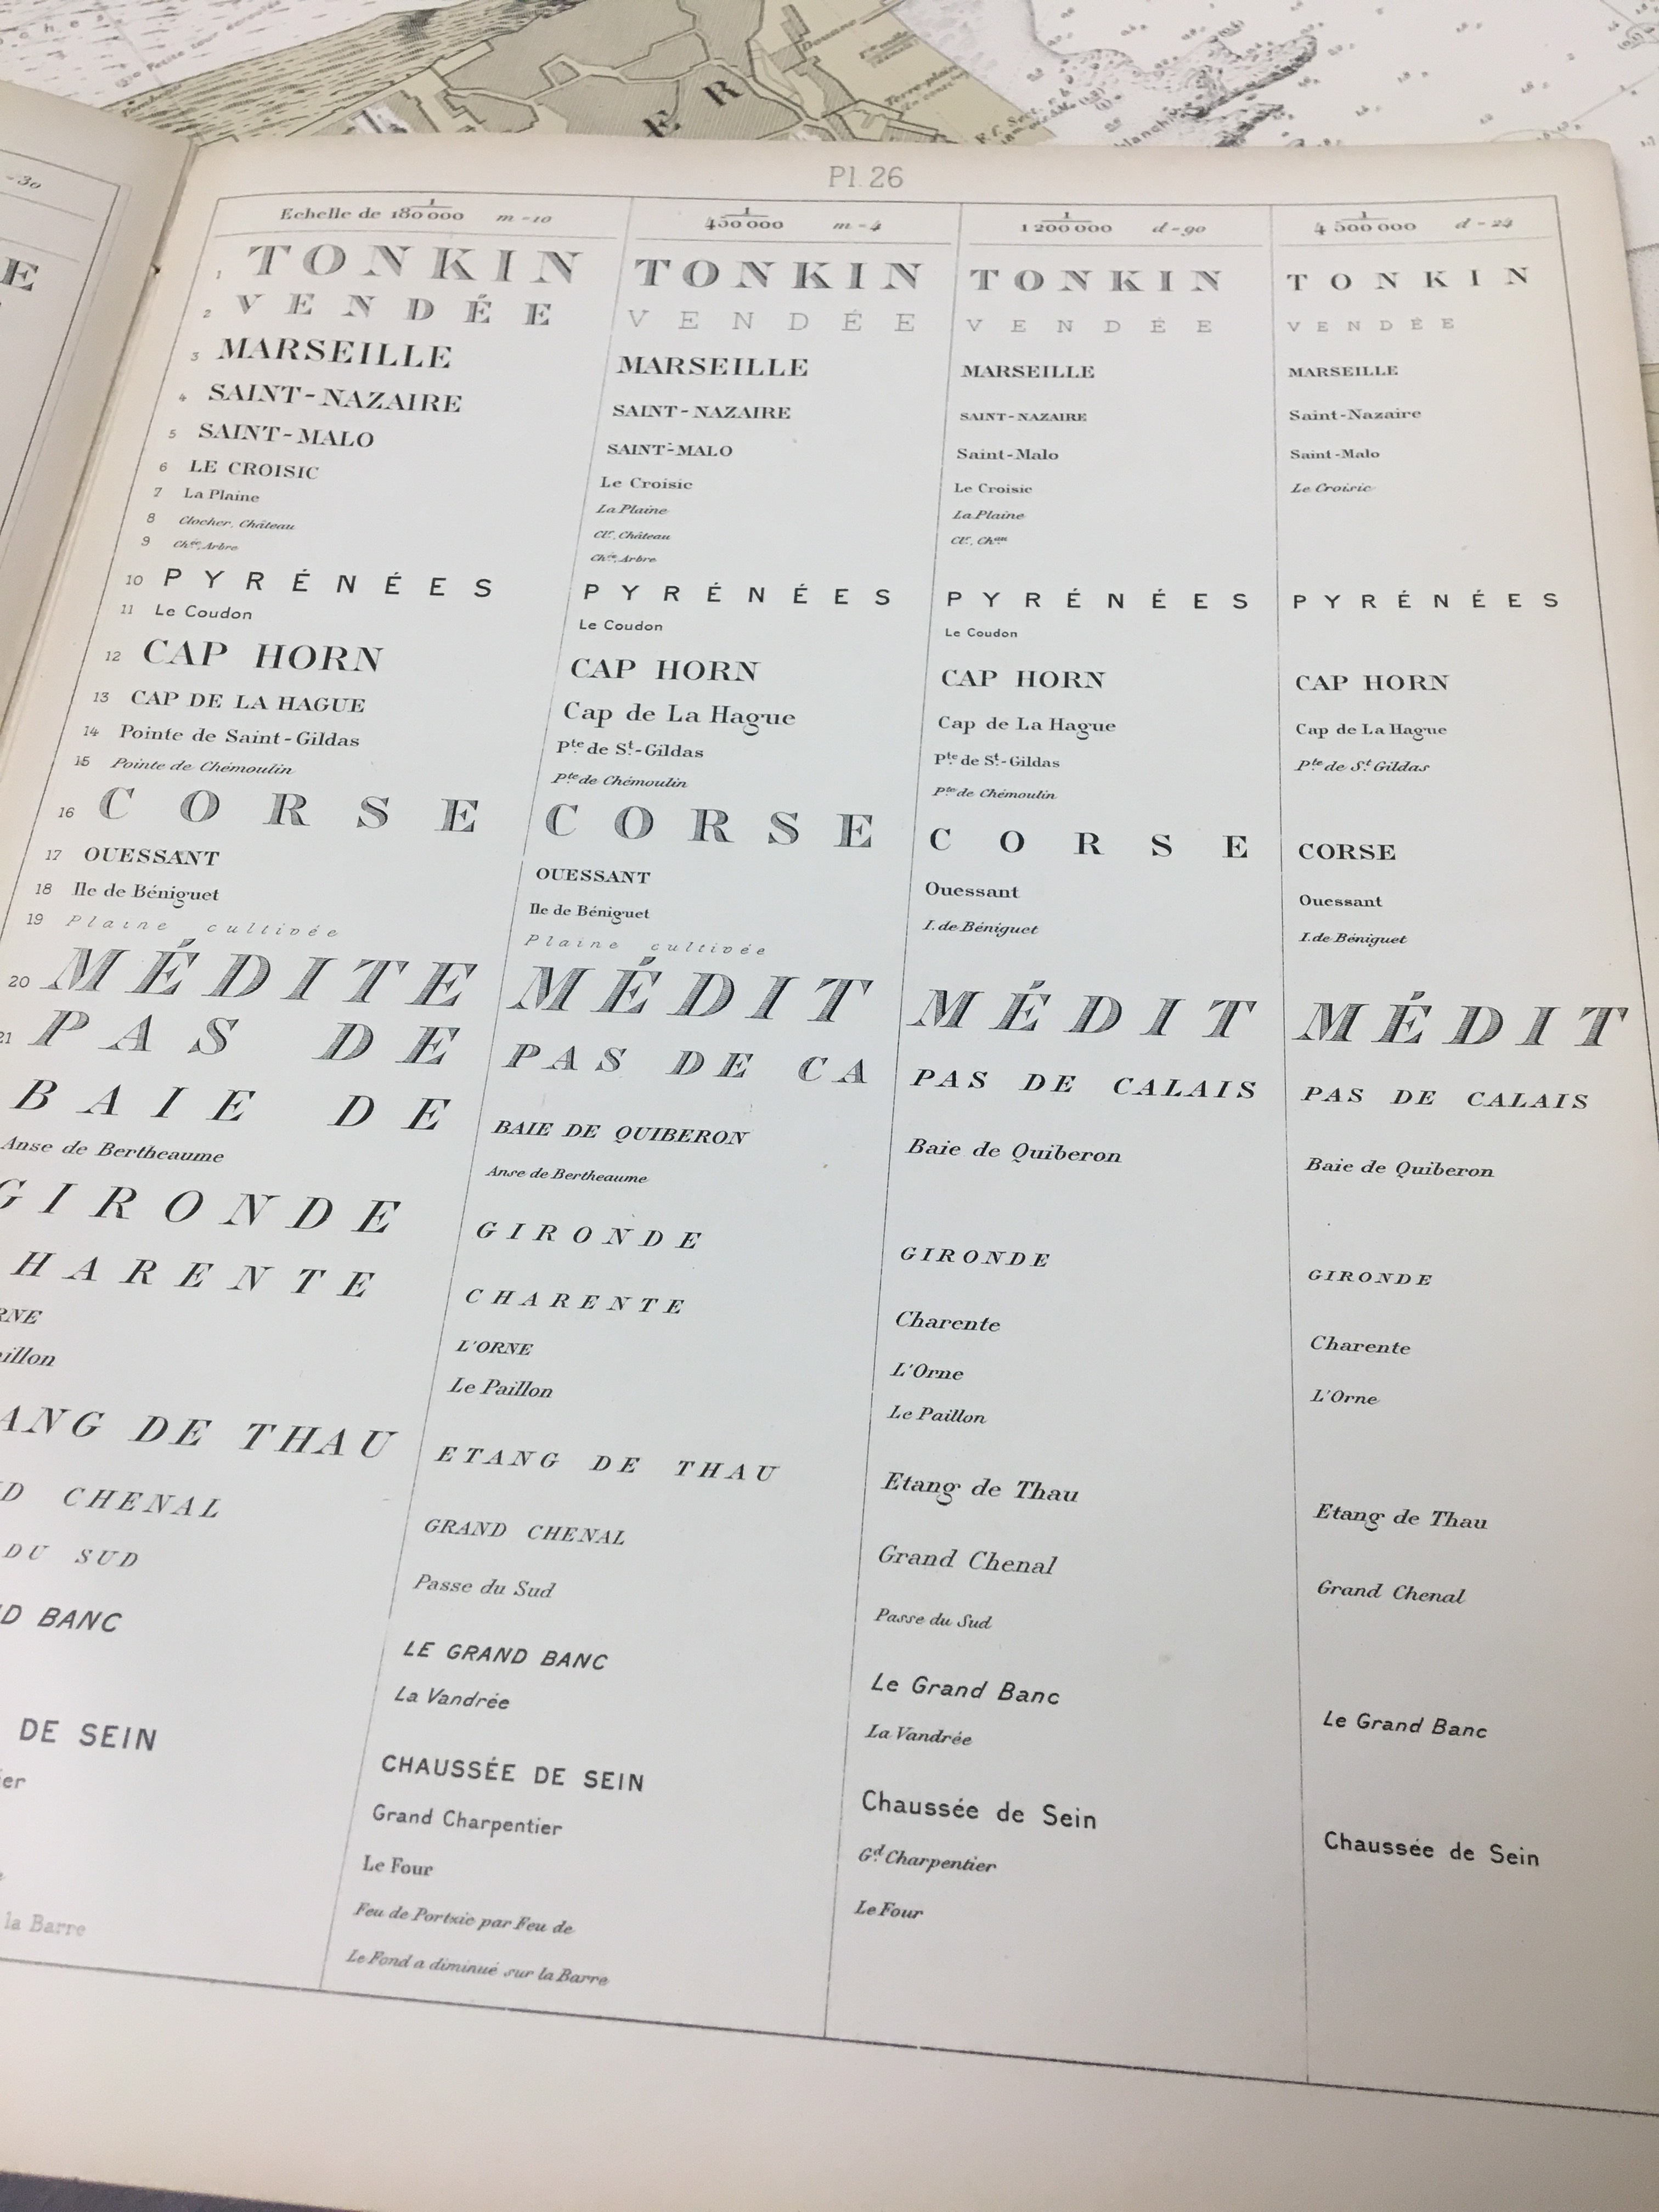
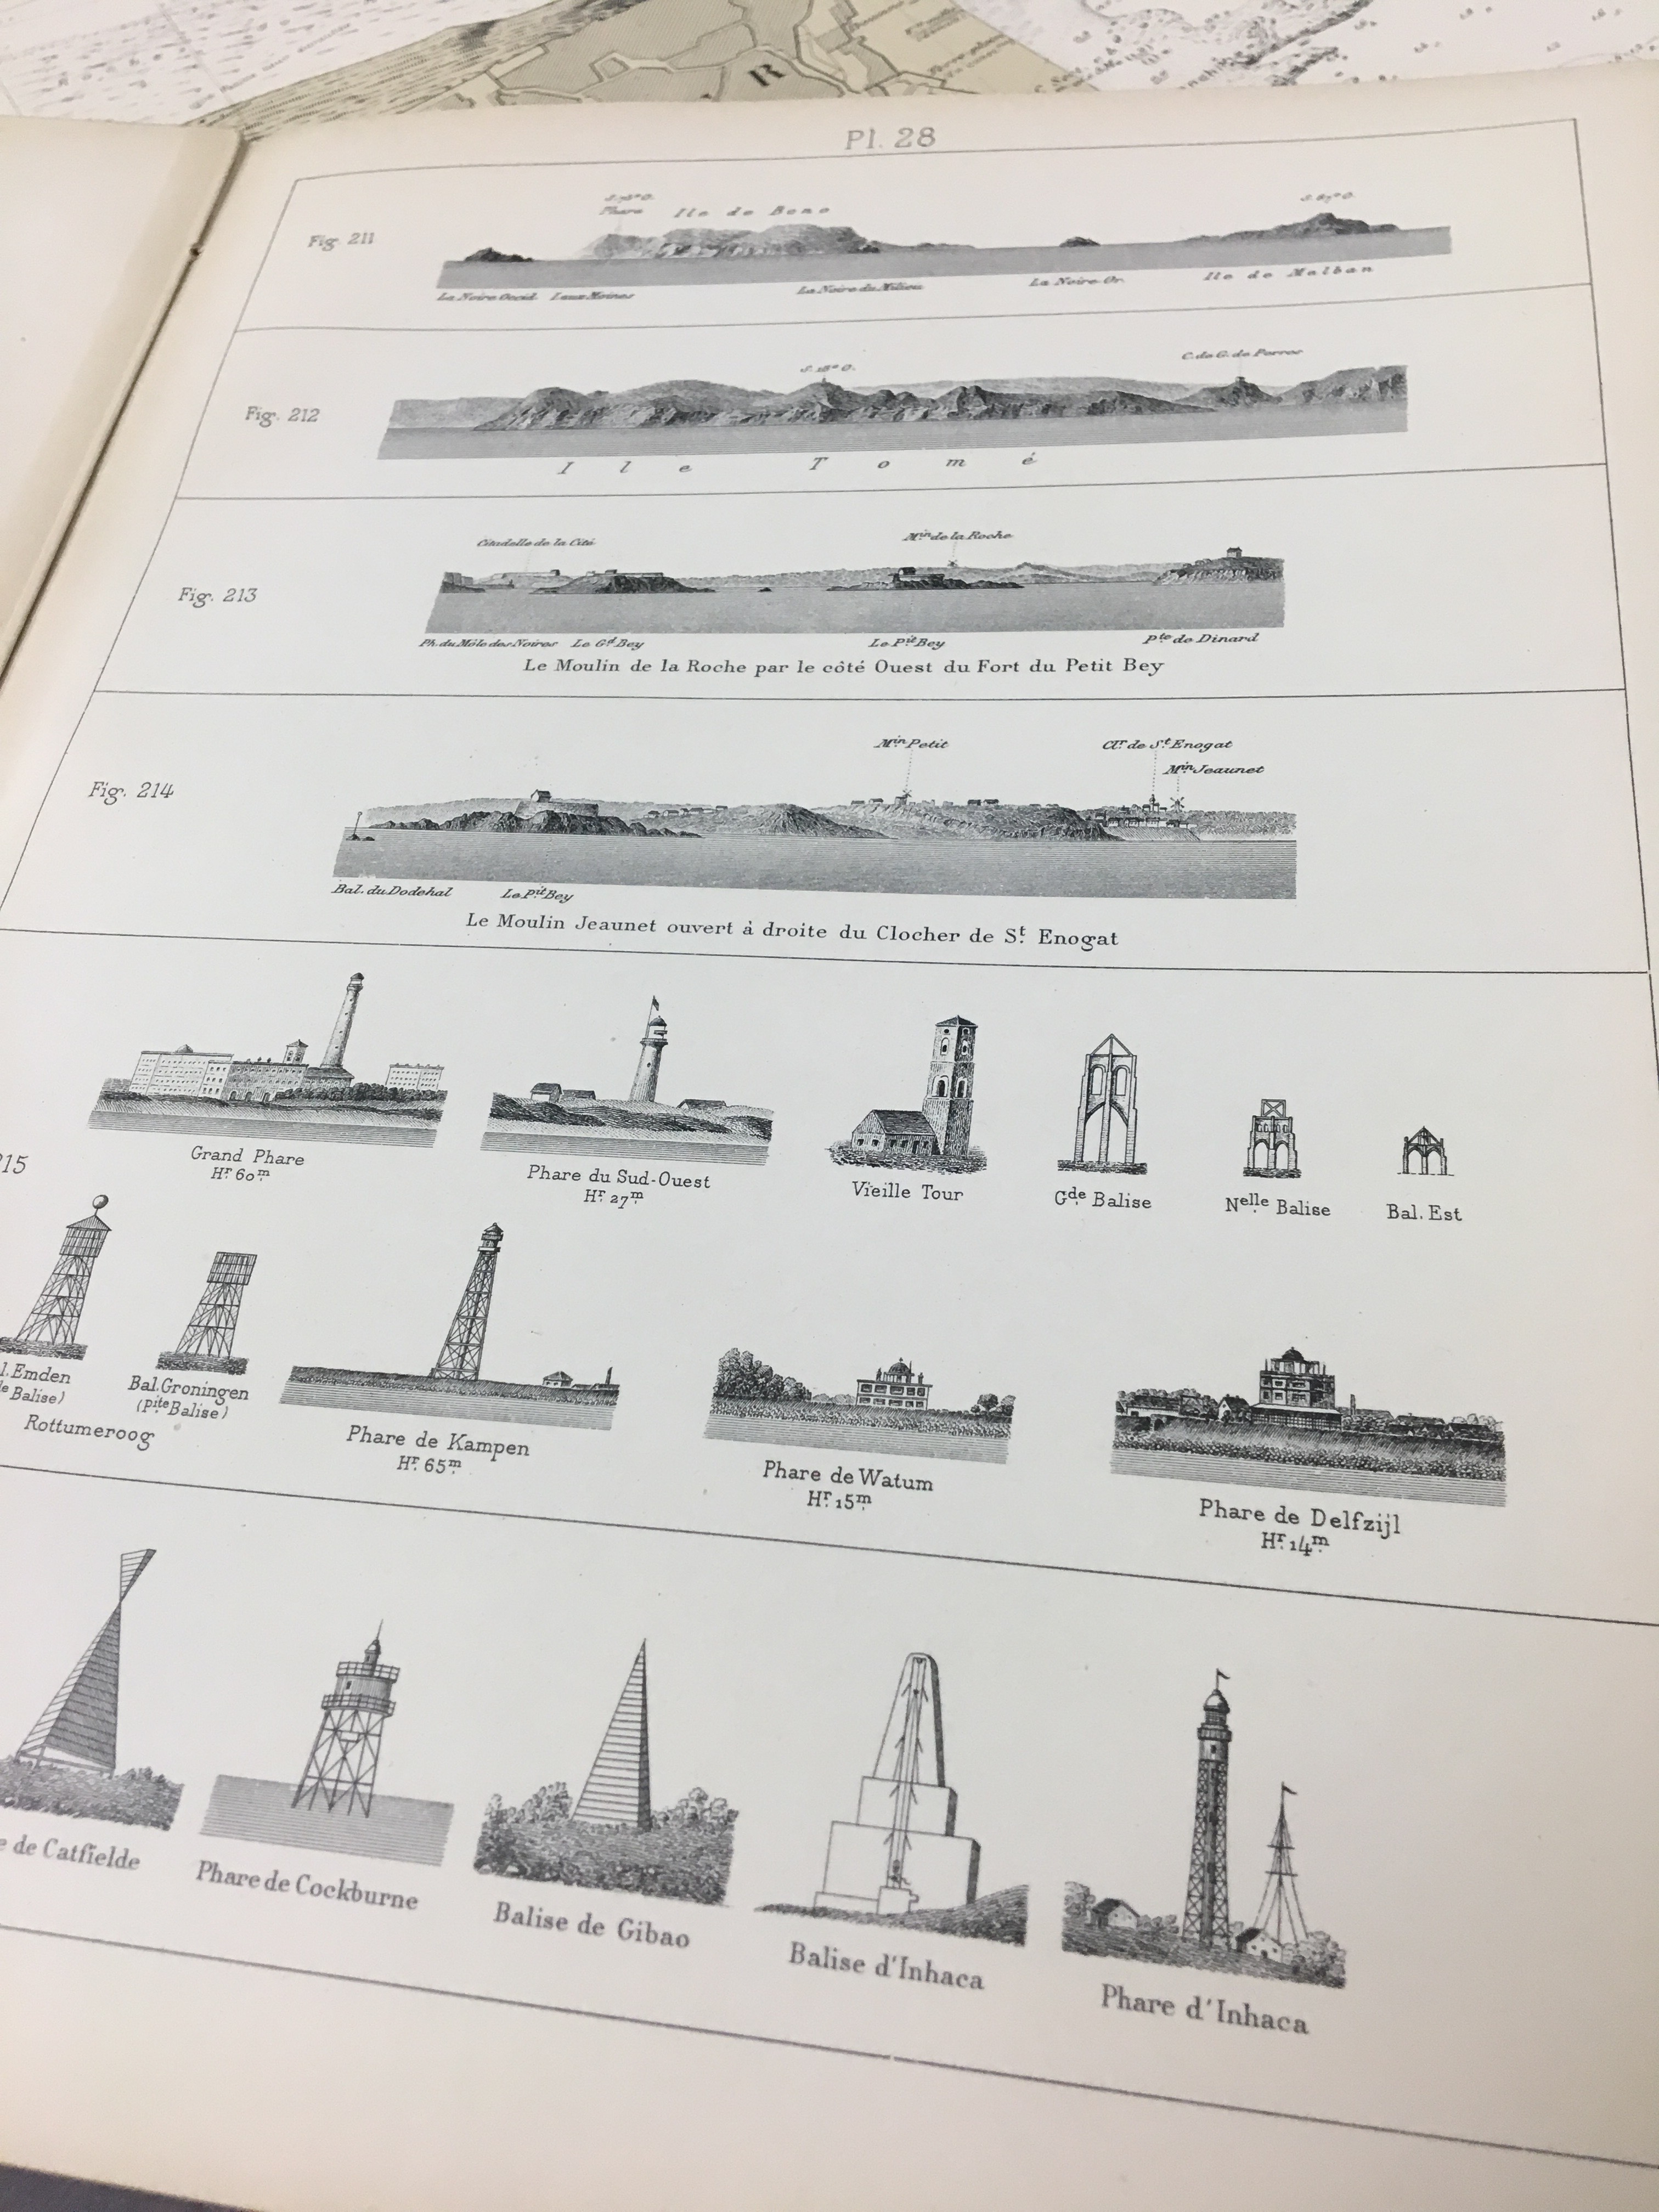
The charts themselves are remarkable not only in their accuracy but in the standards employed in their presentation. The charts are printed using a method called intaglio printing, where the detail of the map itself is etched on a hard surface, such as copper, inked, and then pressed to paper. The AGSL collections also features a guide to the design and creation of these charts entitled Dispositions Générales Relatives aux Cartes et Plans (1914).
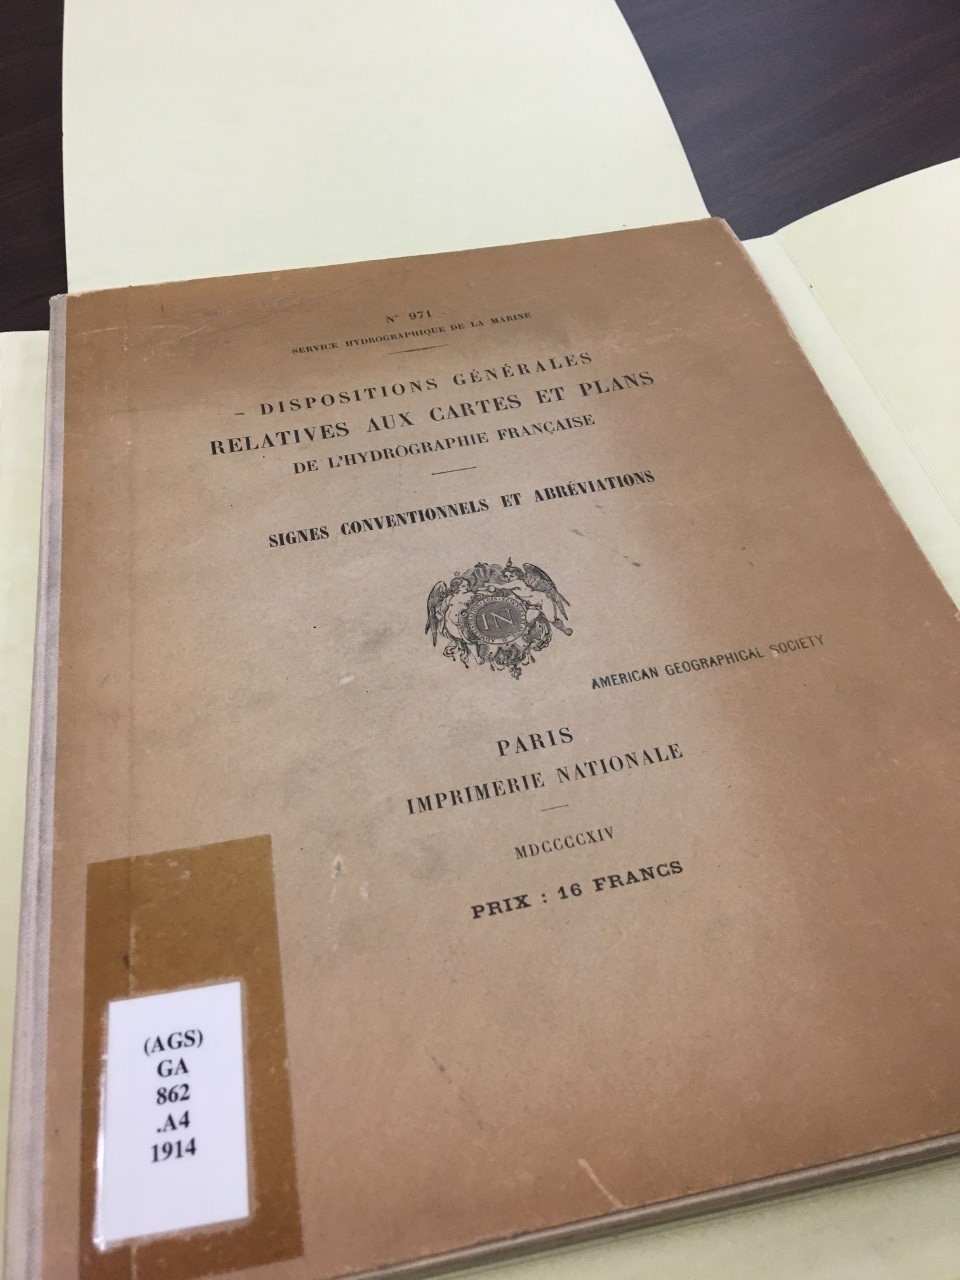
Dispositions Générales Relatives aux Cartes et Plans (1914).
This guide was helpful in understanding the structure and format of nautical charts from the presentation of scale, terminology and printing methods. Here are a few formatting examples from among the many that are included in this great resource.