Map Collection
Wisconsin’s Tornado and Severe Weather Awareness Week is April 12-16
by Angie Cope
Modern day storm tracking relies on Doppler radar data and computer algorithms to forecast and identify dangerous weather.
In the past, The Department of Commerce produced daily weather maps … in print. Many libraries across the country have stacks of these maps.
Daily weather maps continue to aid researchers but are prepared in digital format by the National Centers for Environmental Prediction, Weather Prediction Center.
The AGS Library has many weather maps, photographs and data sets. Here are a few maps from the American Geographical Society Library Digital Map Collection.
Call number: 800-c .E2C4 I-1974 1975
https://collections.lib.uwm.edu/digital/collection/agdm/id/16471
Call number: 800 I-1976
https://collections.lib.uwm.edu/digital/collection/agdm/id/24523
For more information on data or maps from the AGS Library, contact us via email at: agsl@uwm.edu
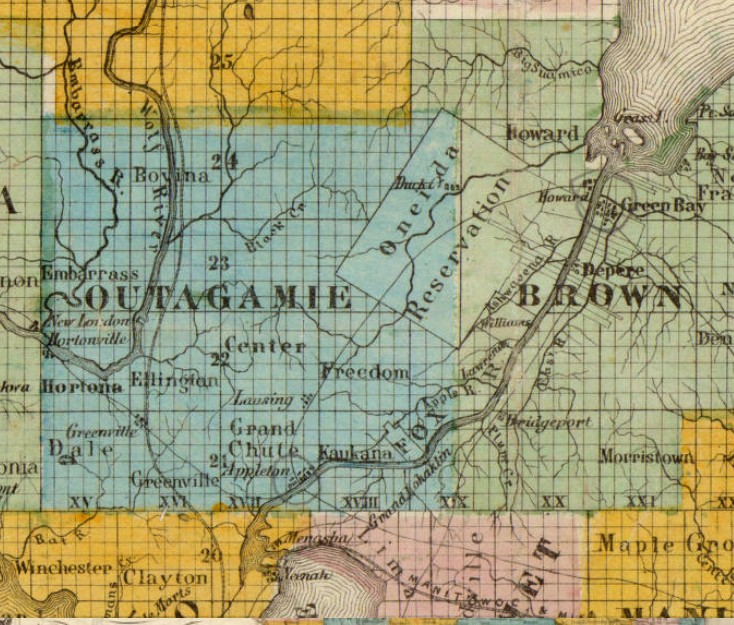
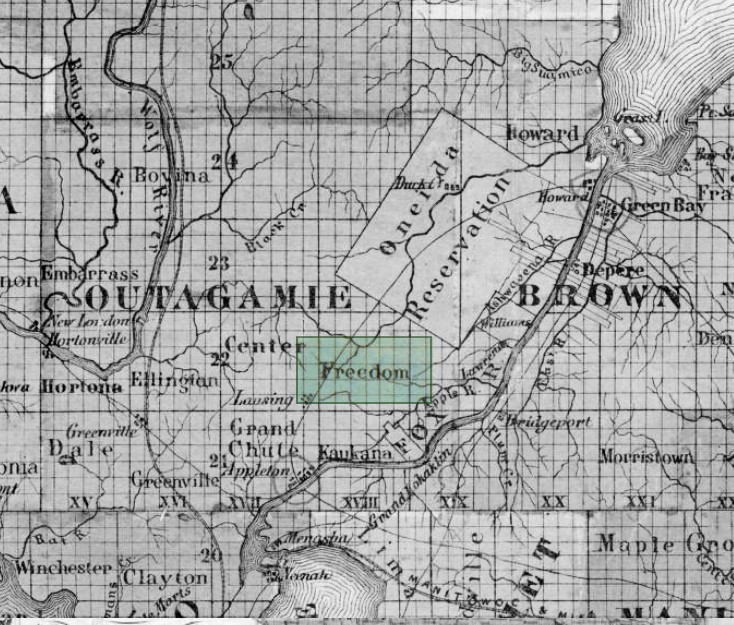
Town of Freedom, Wisconsin named in honor of Black Wisconsinite, James Andrew Jackson
by Angie Cope
The first non-native settler in the Town of Freedom, Wisconsin was James Andrew Jackson, an Black man who escaped enslavement around the year 1850.
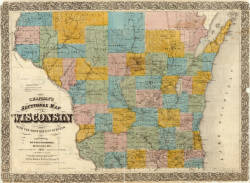
Chapman’s sectional map of Wisconsin : with the most recent surveys / published by Dyer & Pasmore ; A.S. Barnes & Co. ; L.B. Lippinccott & Co. ; sold by Matthew Wallace. 1857

Jackson was very well liked by the local people and they wanted to name the town “Jackson.” But Jackson asked that it be named Freedom instead because that’s where he found his freedom.
https://collections.lib.uwm.edu/digital/collection/agdm/id/13485/rec/15
https://collections.lib.uwm.edu/digital/collection/agdm/id/13032/rec/10
The town is small with a total area of 35.8 square miles (92.6 km2) and a population of 6,057. Freedom is at the crossroads of the Fox Valley, located halfway between Appleton and Green Bay on County E and halfway between Kaukauna and Seymour on State Highway 55 in Outagamie County.
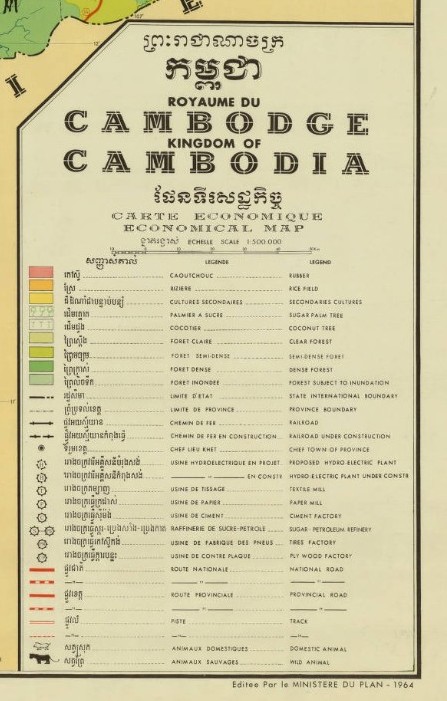
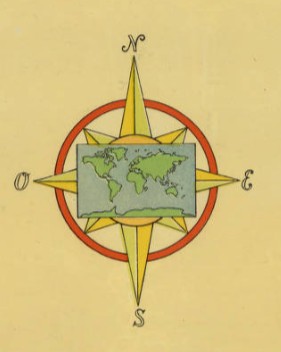
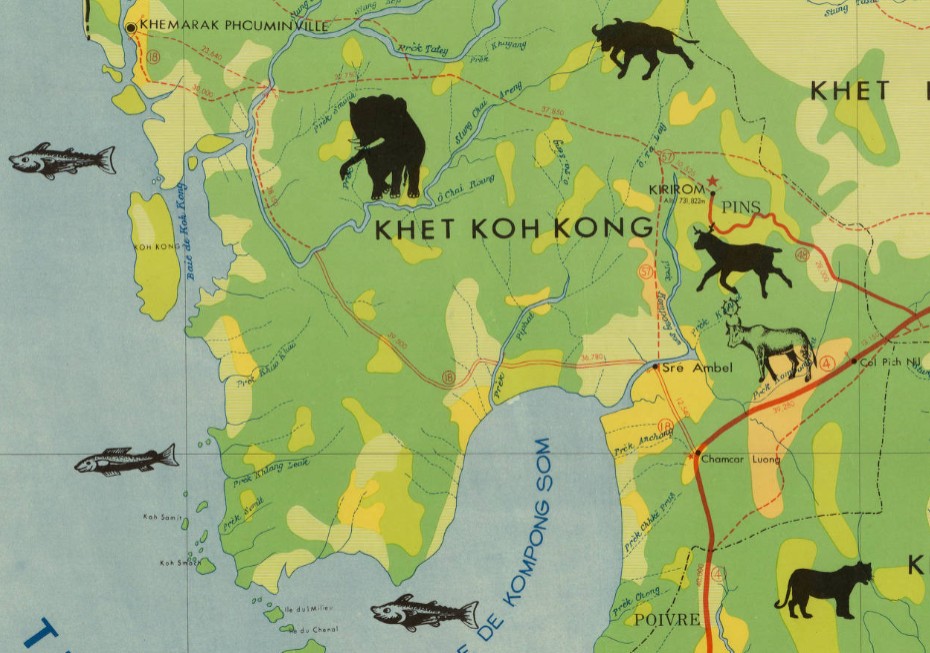
Economic map of Cambodia, 1964
Royaume du Cambodge, carte economique = Kingdom of Cambodia economical map / Cambodia. Forces armées nationales khmères. Service géographique, 1964.
1 map : color ; 96 x 117 cm
Call number: Maps 445 E-1964
https://collections.lib.uwm.edu/digital/collection/agdm/id/3306/rec/1
First flight blazes the trail for future discovery – The Wright Brothers and Lincoln Ellsworth
by Angie Cope
| On the morning of December 17, 1903, Wilbur and Orville Wright took turns piloting and monitoring their flying machine in Kill Devil Hills, North Carolina. Orville piloted the first flight that lasted just 12 seconds and 120 feet. On the fourth and final flight of the day, Wilbur traveled 852 feet, remaining airborne for 59 seconds. That morning, the brothers became the first people to demonstrate sustained flight of a heavier-than-air machine under the complete control of the pilot. |
Orville and Wilbur Wright are credited with inventing, building, and flying the world’s first successful motor-operated airplane. Their inventions led the way for world exploration using airplanes. One notable flight was the Ellsworth Transantarctic Flight Expedition. Lincoln Ellsworth with pilot Herbert Hollick-Kenyon completed the first transantarctic flight in history. With four stops along the route, the flight covered 2200 miles with an elapsed time of approximately 20 hours.
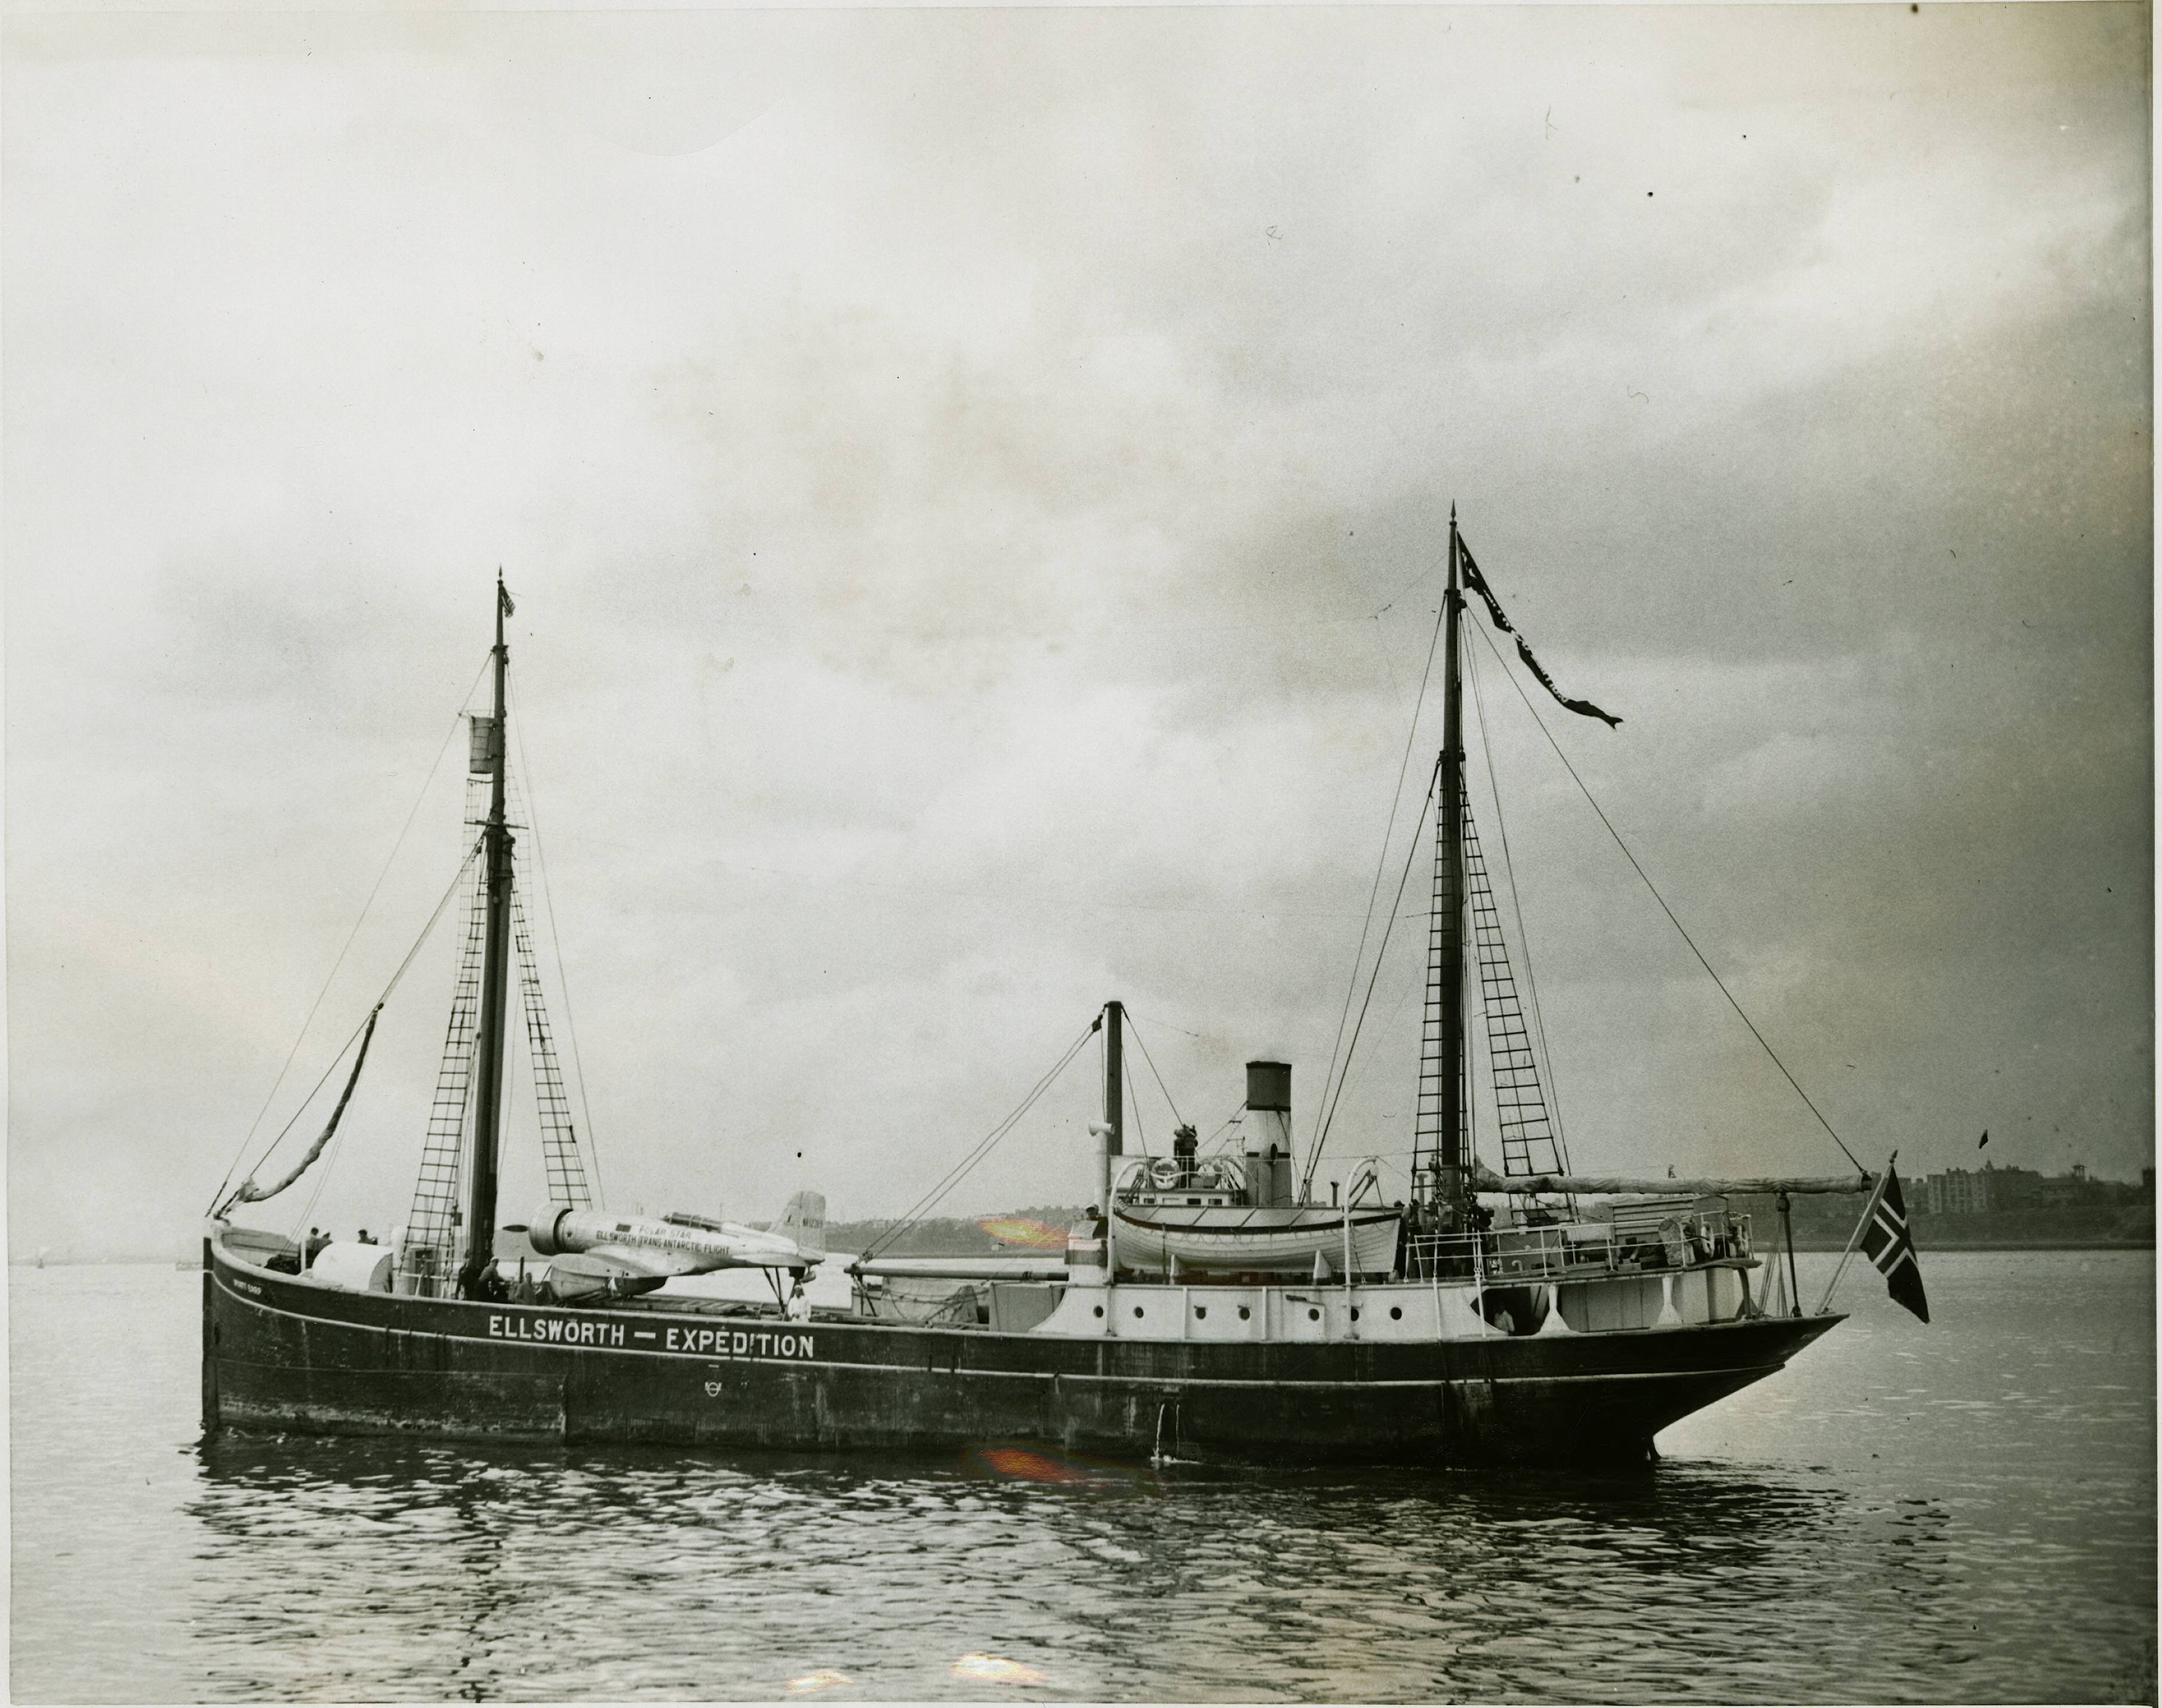

The transantarctic flight was the longest flight in Antarctic history, an accomplishment not repeated again until January 1956.
The story map of flying being a chronicle of man’s conquest of the air / designed, pictured and published by Ernest Dudley Chase of Winchester Massachusetts, 1942
1 map : color ; 65 x 47 cm, on sheet 77 x 56 cm
Cataloging, Sleuthing and Land Consolidation in Croatia
by Angie Cope
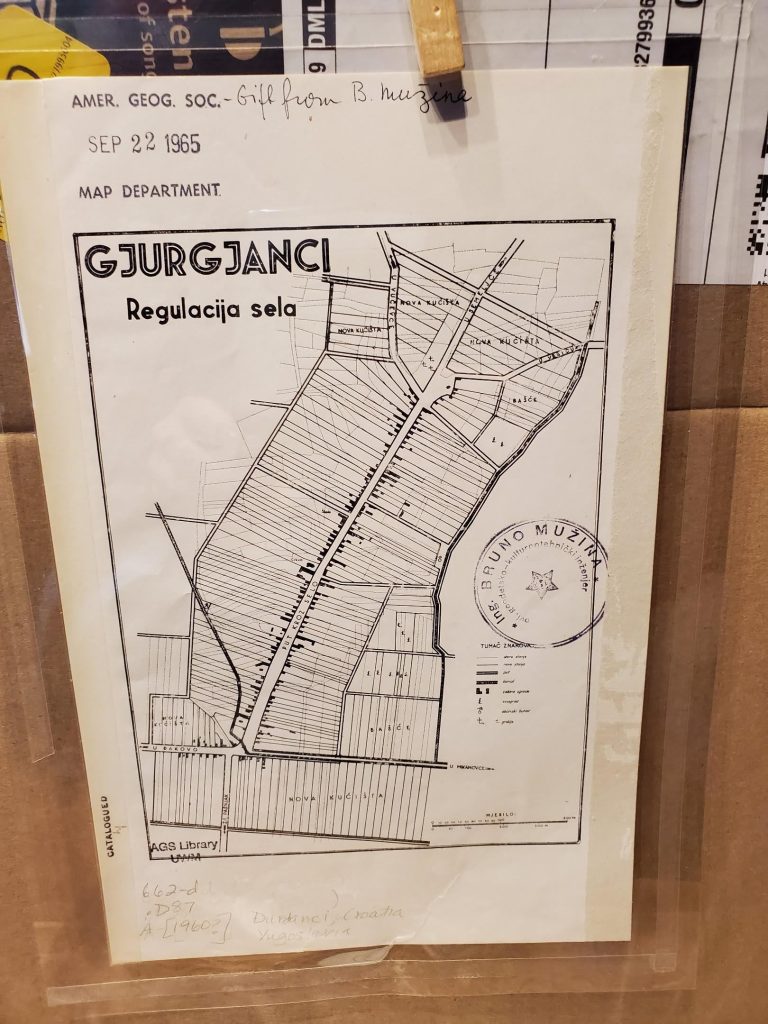
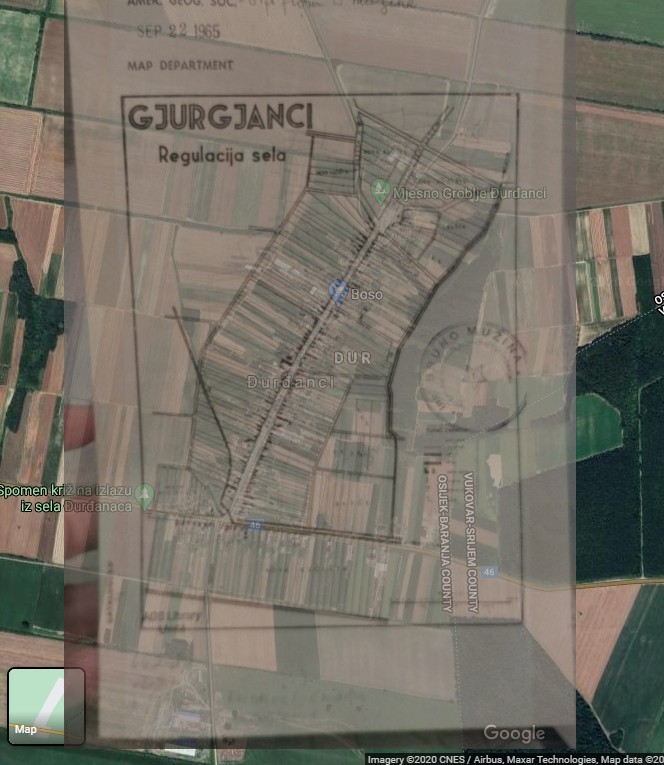
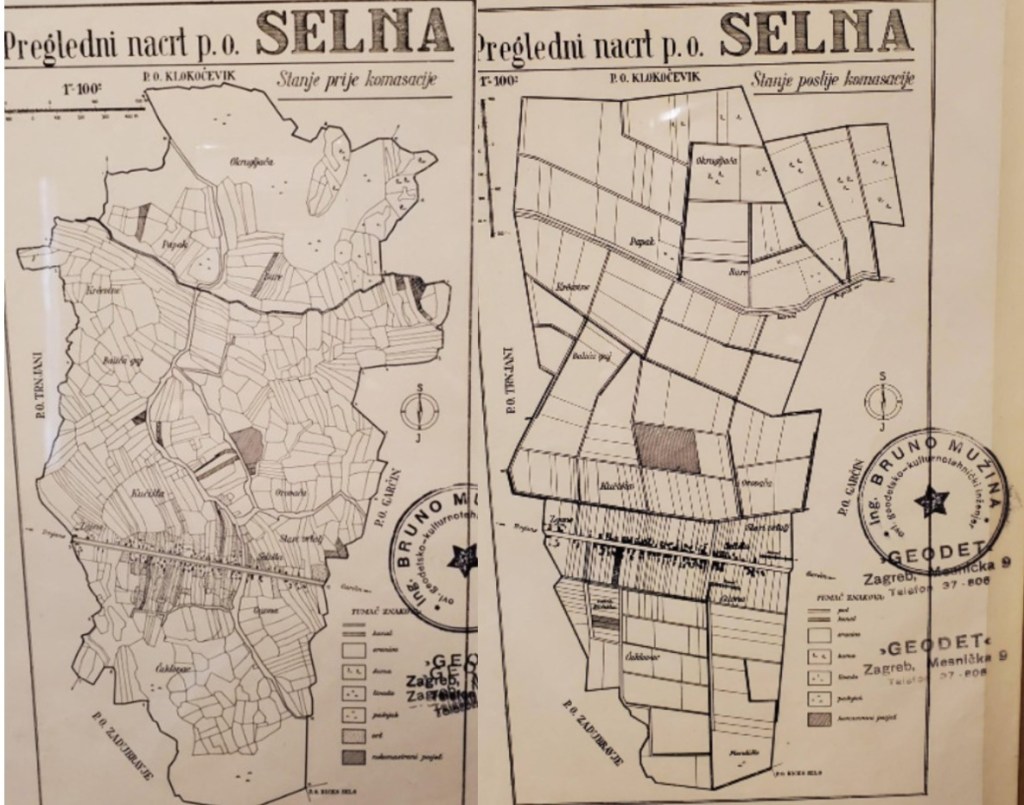
Recently I’ve been cataloging a back log of maps from Eastern Europe. If you’re familiar with the AGS Library’s situation, all our maps are cataloged – in an old fashioned card catalog. Efforts have been underway for … a long time … to get everything cataloged in the online environment. The other day I ran across this little map titled “Gjurgjanci Regulacija sela” (24 x 16 cm). After some detective work, I was able to identify the modern place name and some other interesting information about it.
A Google search for “Gjurgjanci” – took me to a place in Kosovo, but the details didn’t match. Gjurgjanci doesn’t show up in the Getty geographic thesaurus, the U.S. Board on Geographic Names or the Library of Congress subject heading authorities, so my detective work continued.
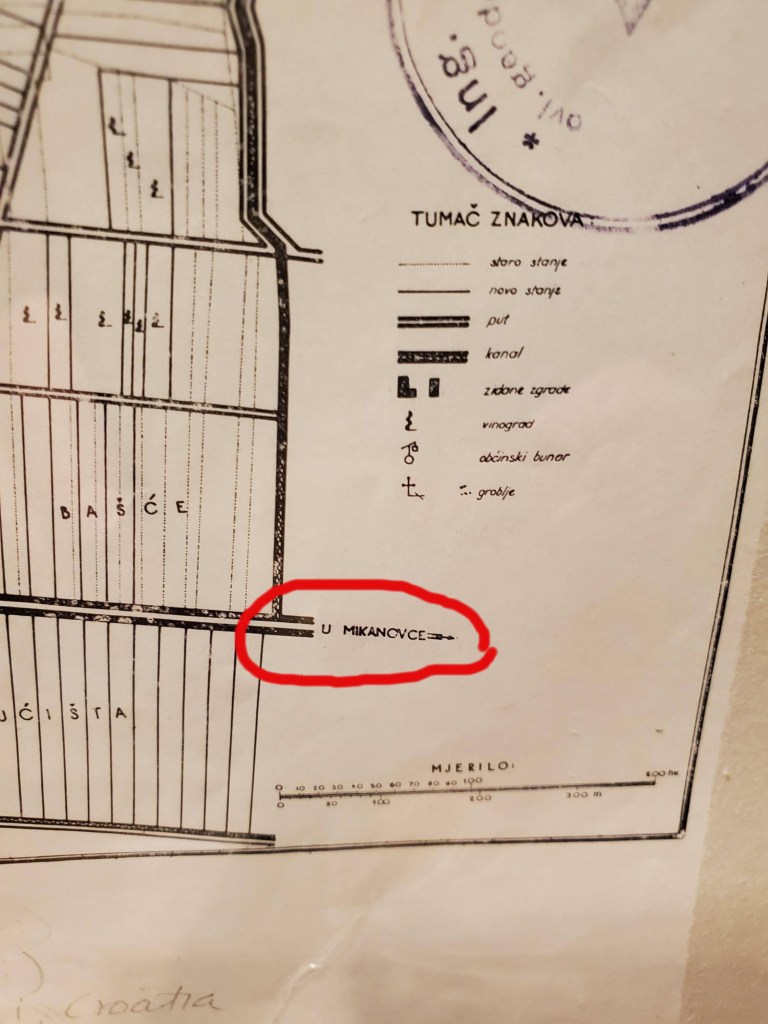
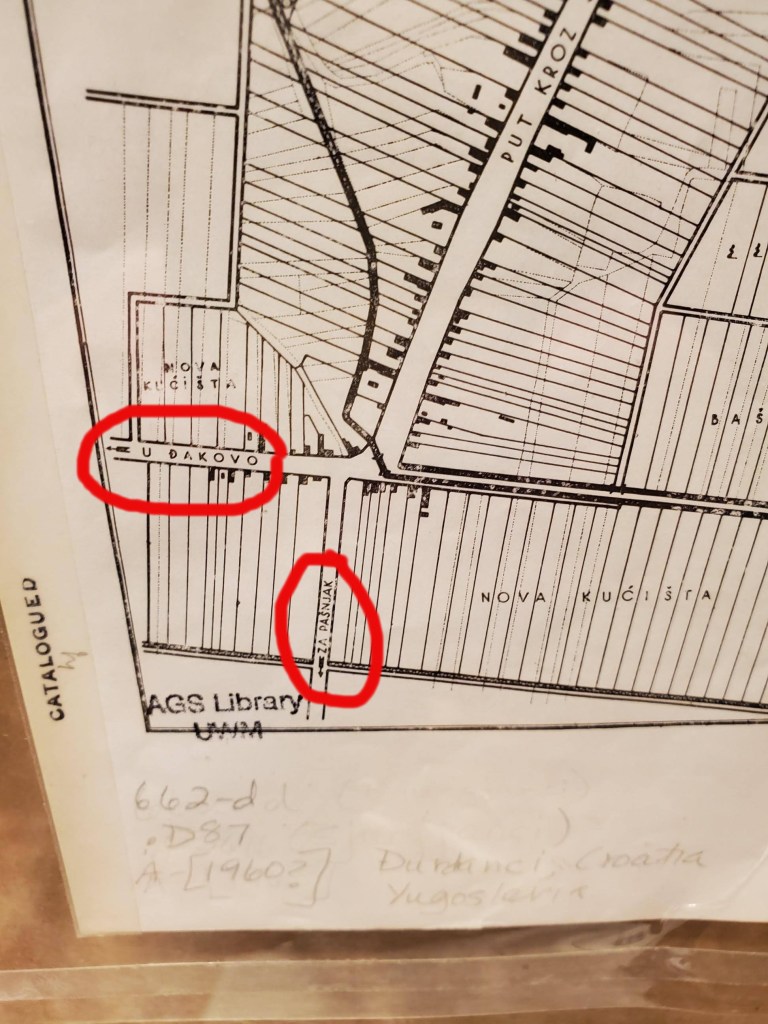
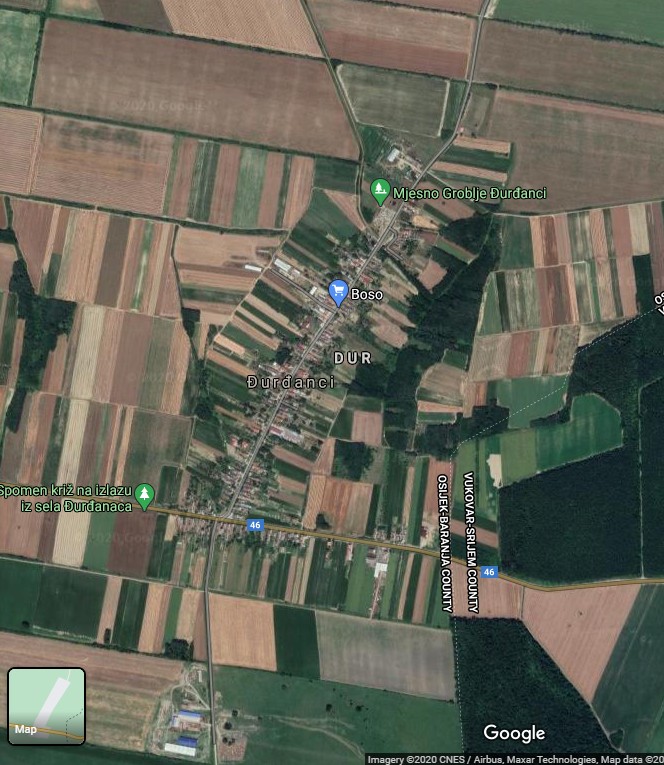
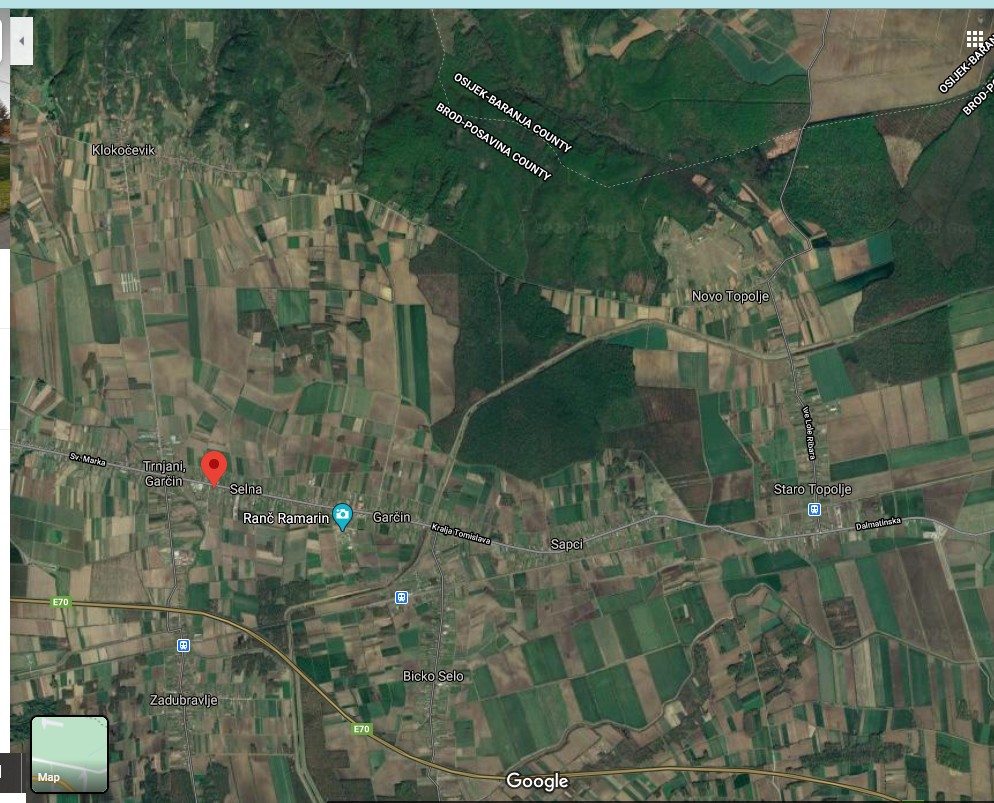
On the map, I noticed that some roads are labeled with directions to neighboring cities. I searched those place names until I zeroed in and identified the correct location of my map – Đurđanci in the county of Osijek-Baranja, Croatia.
It was great to learn WHERE the map was of, but I still didn’t know anything else about it such as subject, date or publisher. I cataloged that map as best I could and continued on my cataloging journey through Yugoslavia.
The next day I came across two similar maps with similar problems – I was not able to find the place name in a Google search, a Getty geographic thesaurus search or a Library of Congress subject heading authorities search.
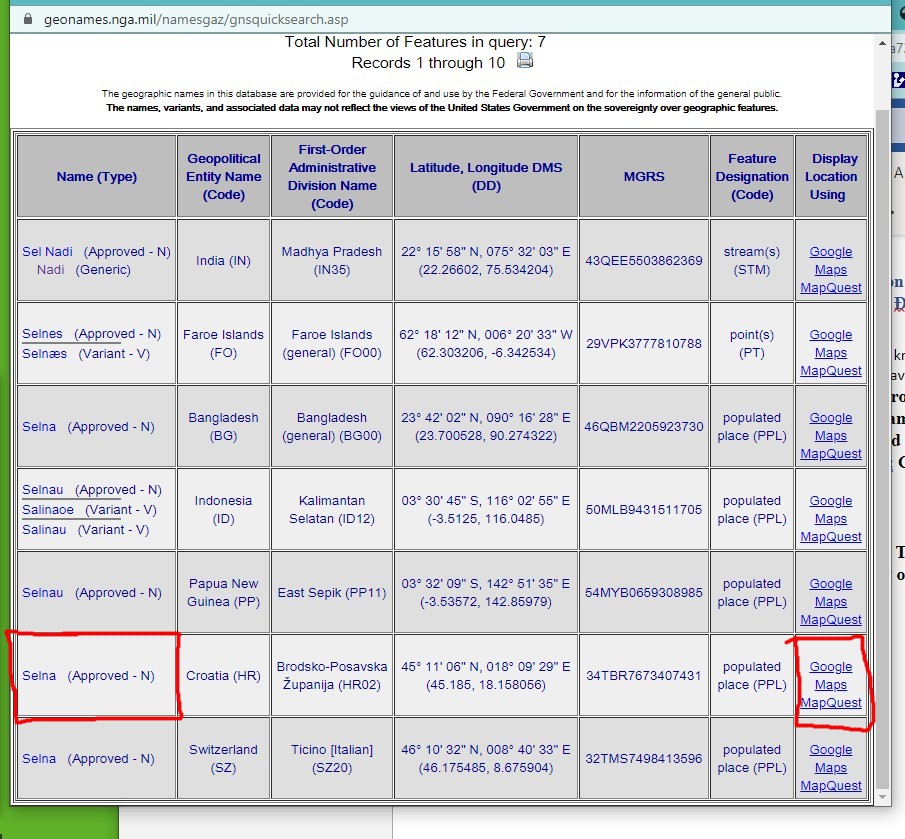
Fortunately, in this case, the US Board on Geographic Names site included a record for Selna. The search results at US Board on Geographic Names allow you to click on a link to the map. You can see the modern map lines up with details from these historical paper maps.
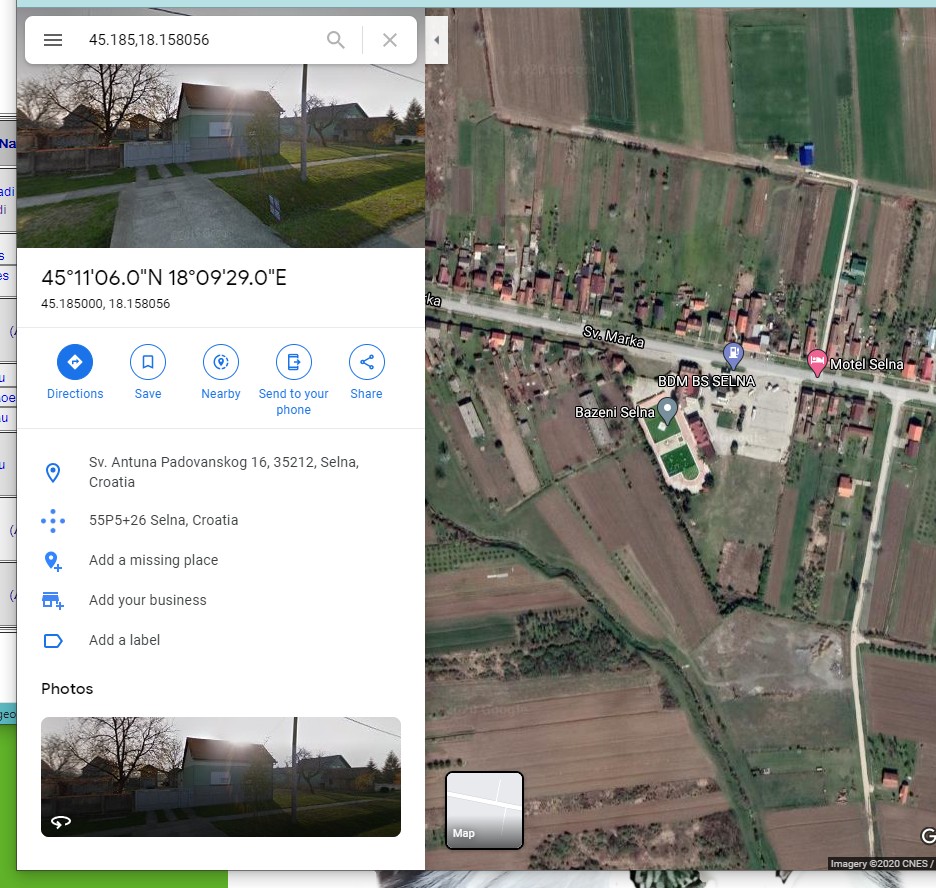
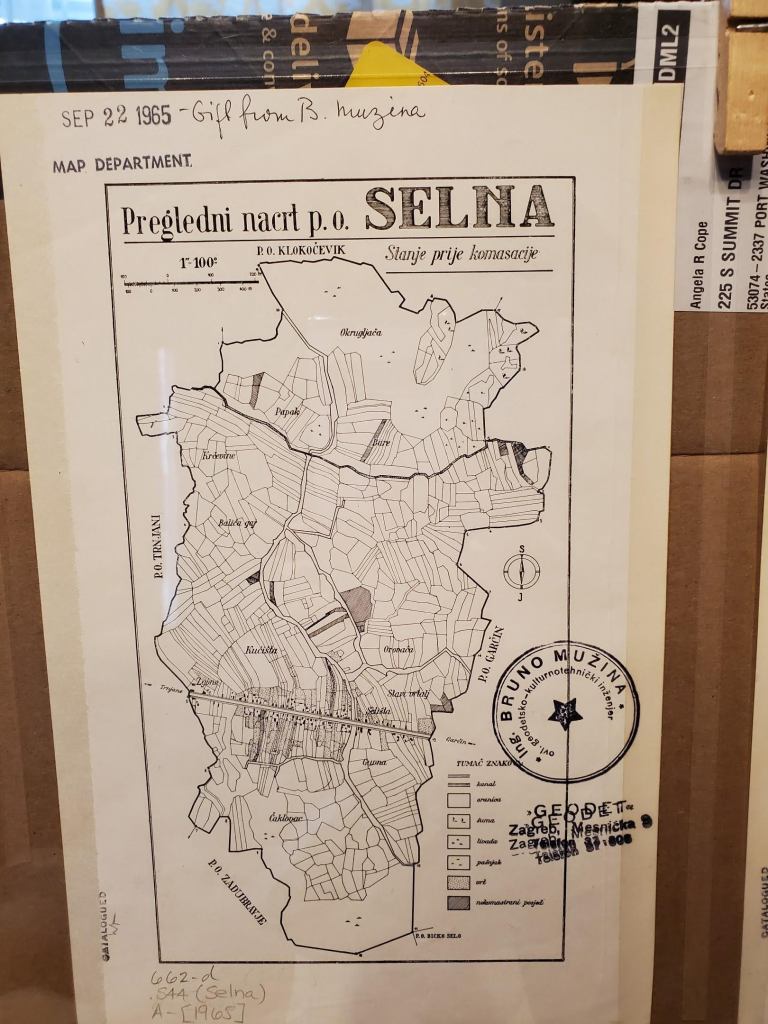
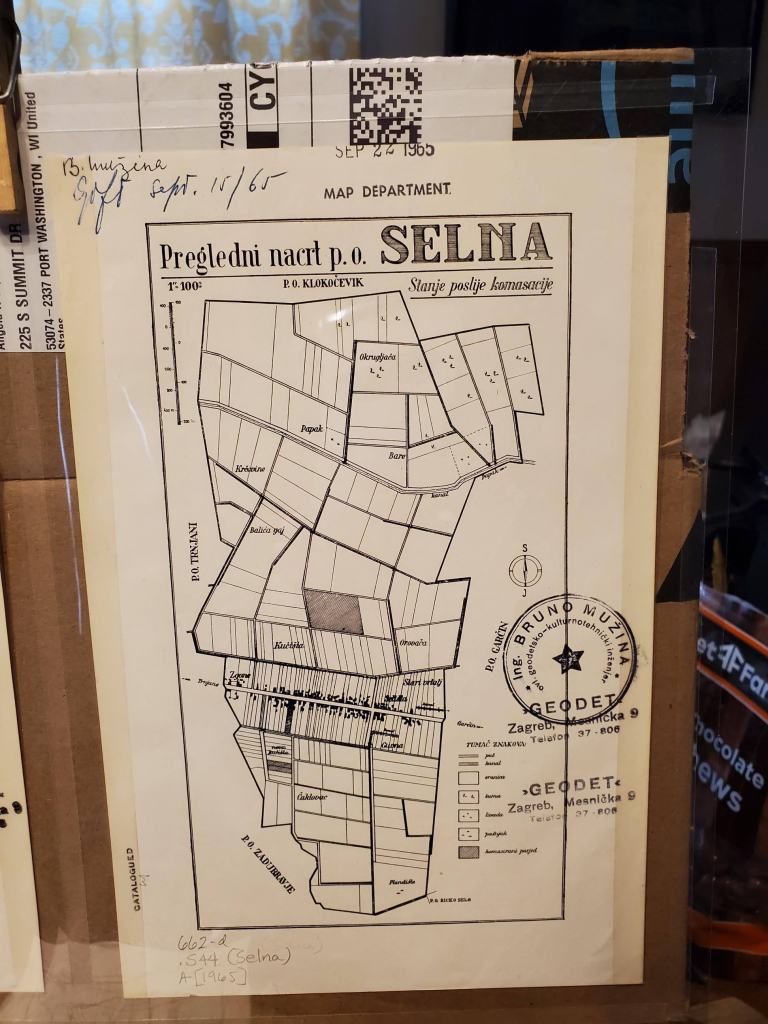
While I still don’t know much about these maps in regard to their date or publisher, I was able to learn that these maps show Croatian/Yugoslavian land consolidation. The subtitles on the Selna maps read: Stanje prije komasacije — Stanje poslije komasacije or Condition before consolidation – Condition after consolidation.
Apparently there have been multiple attempts to consolidate land in Croatia. Today, Croatia has approximately 14 million cadastral parcels and the total land area is 56,594 km2. Cadastral parcels are heavily fragmented (Figure 2). From the figure it is visible that average number of land parcels per hectare is relatively high.
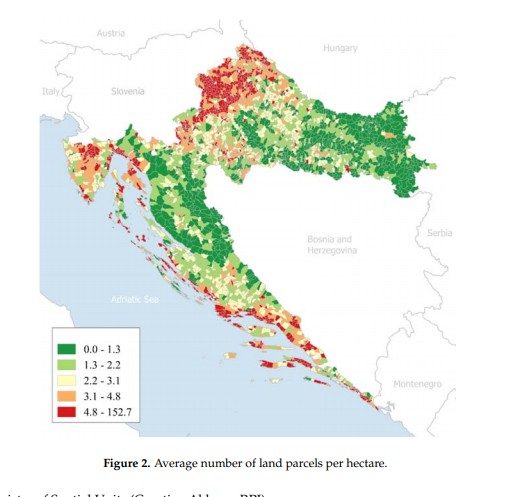
Faculty of Geodesy, University of Croatia. Published: 9 March 2018
The maps held at the AGS Library were received as gifts from “Ing. Bruno Muzina ovl. Geodetsko-kulturnotehnički inženjer” in 1965. My guess is that he worked at “”Geodet” Zagreb, Mesnička” as indicated by the stamps on the maps. The publication date is at least 1965 or earlier based on the gift date. However, I don’t know an exact date or publisher or if the maps were removed from a report and if so, what report.
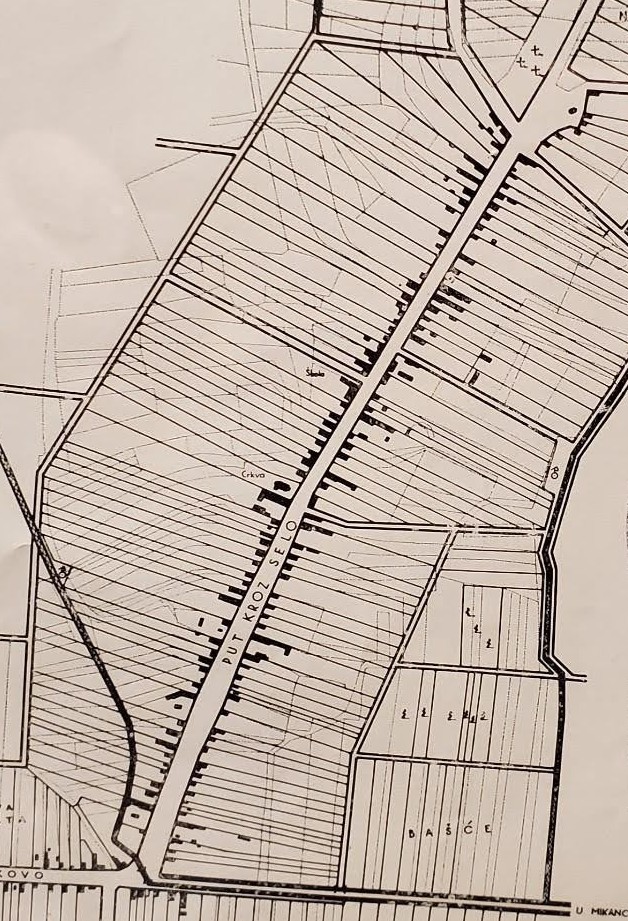
With this added knowledge, the details of the maps become quite interesting. The first map of Gjurgjanci/ Đurđanci has the consolidated property lines layered over the historical, fragmented parcels. The Selna maps have the two versions side by side. One can clearly see the fragmented historical parcels. The idea is that fragmented agricultural land raises the cost of agricultural production. The land consolidation effort would merge partitioned lands into larger and more regularly shaped parcels. Roads and canal networks would also be arranged to improve the conditions of agricultural production. Understanding a little more about both the where and the what my maps were showing is critical when assigning subject headings. In this case, I assign both the place names as well as a topical heading: Consolidation of land holdings — Croatia — Maps.
As a cataloger I make decisions about how far to proceed when creating data for my records. Do I continue to research this question, learn the Croatian language so I can read up on land consolidation, travel to Croatia to comb the local archives, conduct a séance? Or, do I make the decision to put as much information as I can, make educated guesses, include information in brackets and just move on with my life (see one of my cataloging records below).
Perhaps this blog will be seen by someone out there who can offer information about the publisher or date of the land consolidation being shown on my maps.
hashtags to consider … #workingfromhome #https://pixlr.com/x/ #pixlr_is_awesome #gettingbywithphonephotos #googlemapsrock #ilovecataloging
007 a ǂb j ǂd a ǂe a ǂf n ǂg z ǂh n
040 GZN ǂb eng ǂe rda ǂc GZN
0341 a ǂb 10000
043 e-ci—
090 ǂb
049 GZNA
24500Gjurgjanci Regulacija sela.
255 Scale approximately 1:10,000.
264 1[Place of publication not identified] : ǂb [publisher not indentified], ǂc [1960?]
300 1 map ; ǂc 18 x 13 cm, on sheet 24 x 16 cm
336 cartographic image ǂ2 rdacontent
337 unmediated ǂ2 rdamedia
338 sheet ǂ2 rdacarrier
500 Stamped: Ing. Bruno Muzina ovl. Geodetsko-kulturnotehnički inženjer.
500 “Gift from B. Muzina, Sep 22 1965.”
500 Đurđanci, Osijek-Baranja County, Croatia.
6500Consolidation of land holdings — Croatia — Đurđanci — Maps
651 0Đurđanci (Croatia) ǂv Maps.
650 0Cities and towns ǂz Yugoslavia ǂv Maps.
650 0Cities and towns ǂz Croatia ǂv Maps.
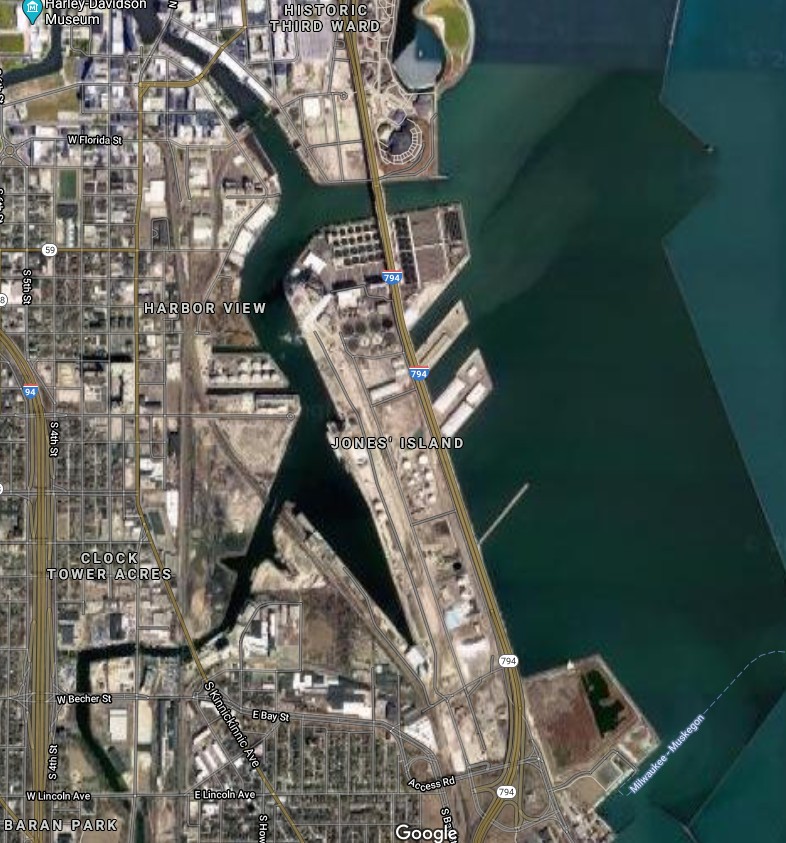
Jones Island, Milwaukee, Wisconsin
by Angie Cope
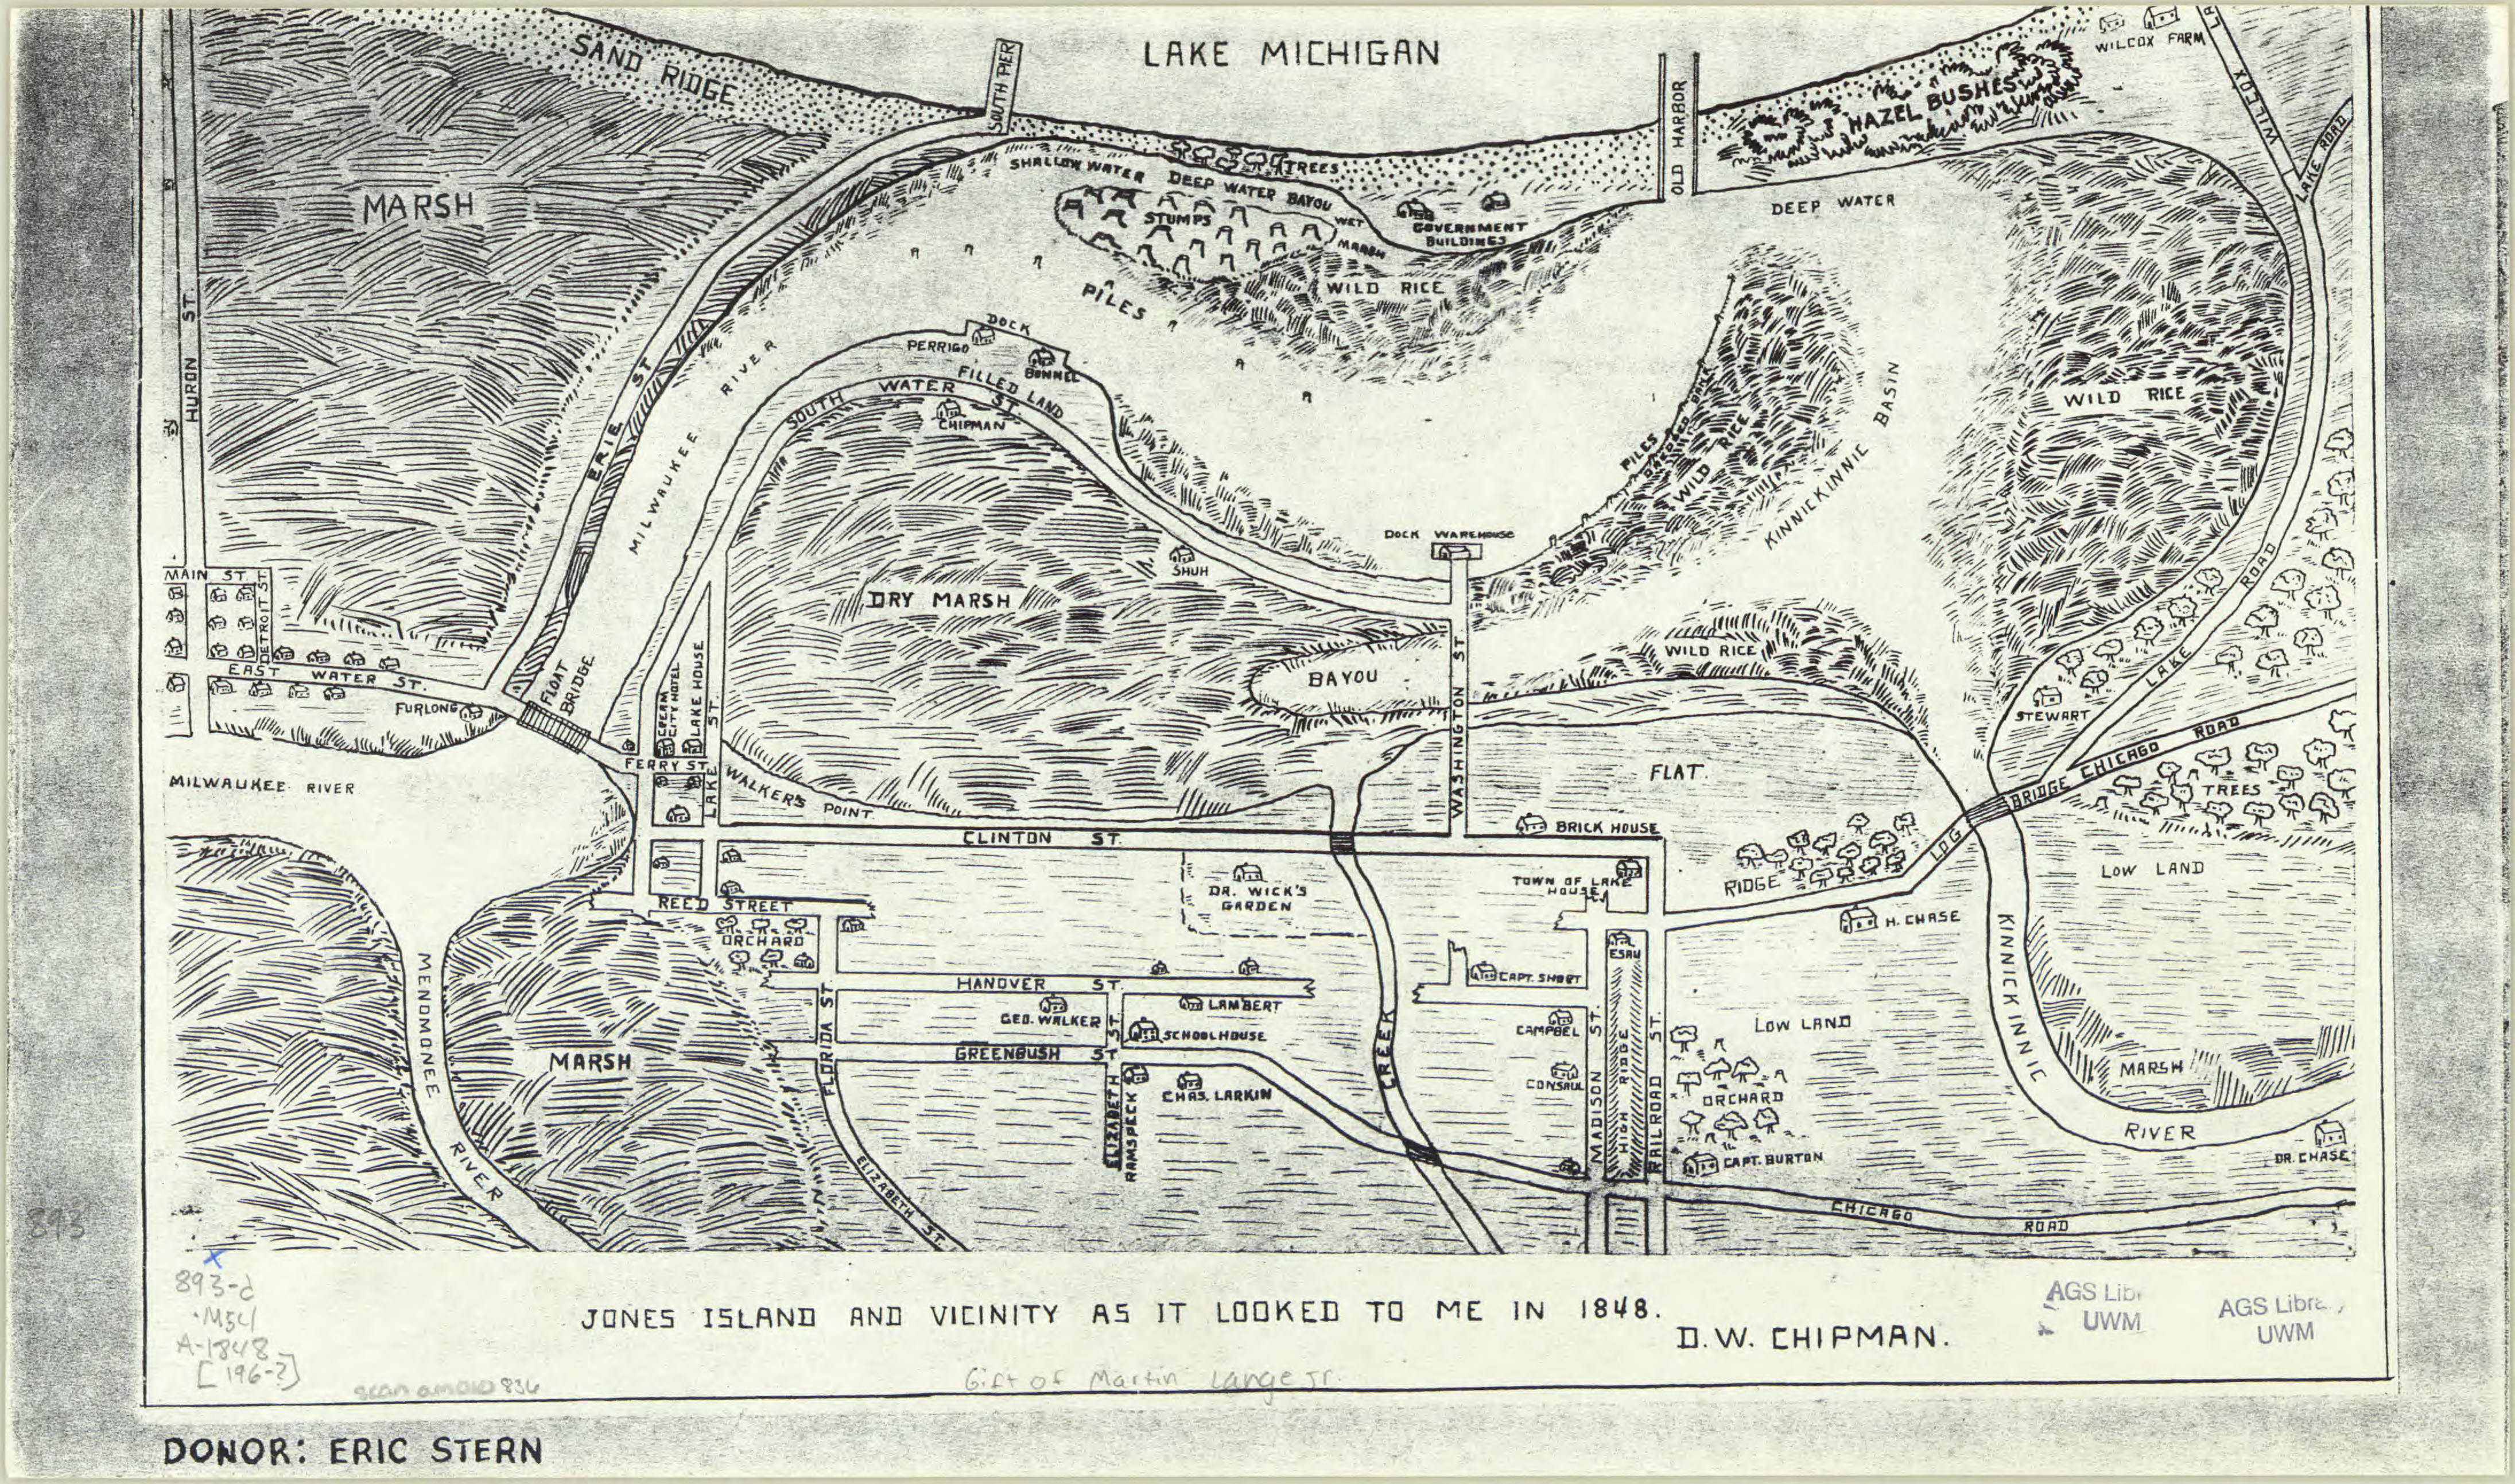
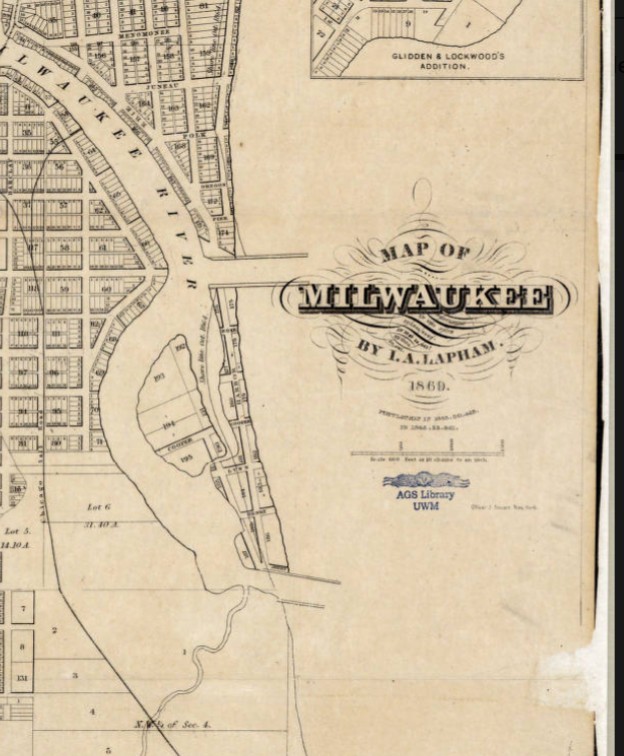
Jones island is an industrialized peninsula in Milwaukee, Wisconsin between the Milwaukee and Kinnickinnic rivers.
https://collections.lib.uwm.edu/digital/collection/agdm/id/5459/rec/1
The island was originally marsh land when German immigrants settled there in the 1870s. Without proper land deeds, the immigrants were considered squatters and were evicted to make way for a shipping port. Between 1920 and 1940s the final European immigrants were removed.
https://collections.lib.uwm.edu/digital/collection/agdm/id/21/rec/7
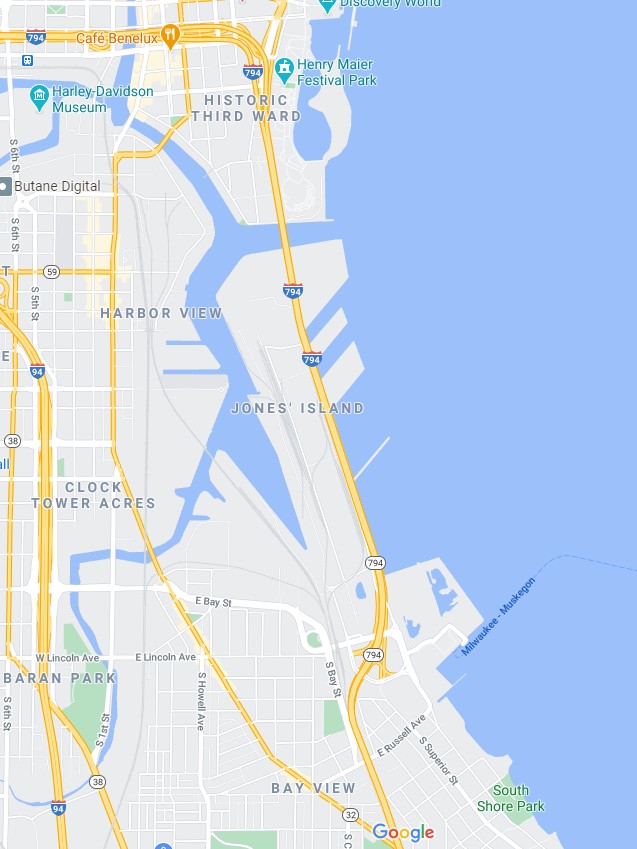
Today Jones Island is home to the Port of Milwaukee, the Milwaukee Metropolitan Sewerage District’s primary wastewater treatment plant, and other municipal services. It also supports the long-arch Hoan Bridge that spans across the Milwaukee River inlet. The land is heavily industrialized, containing only a couple of mature trees.

Map of Jones Island 1960s facsimile of an 1848 map
https://collections.lib.uwm.edu/digital/collection/agdm/id/5459/rec/1
View of Jones Island from an 1869 map of Milwaukee
https://collections.lib.uwm.edu/digital/collection/agdm/id/21/rec/7
Modern map of Jones Island, Milwaukee, Wisconsin 2020
Planiglobii terrestris world map from 1716
by Angie Cope
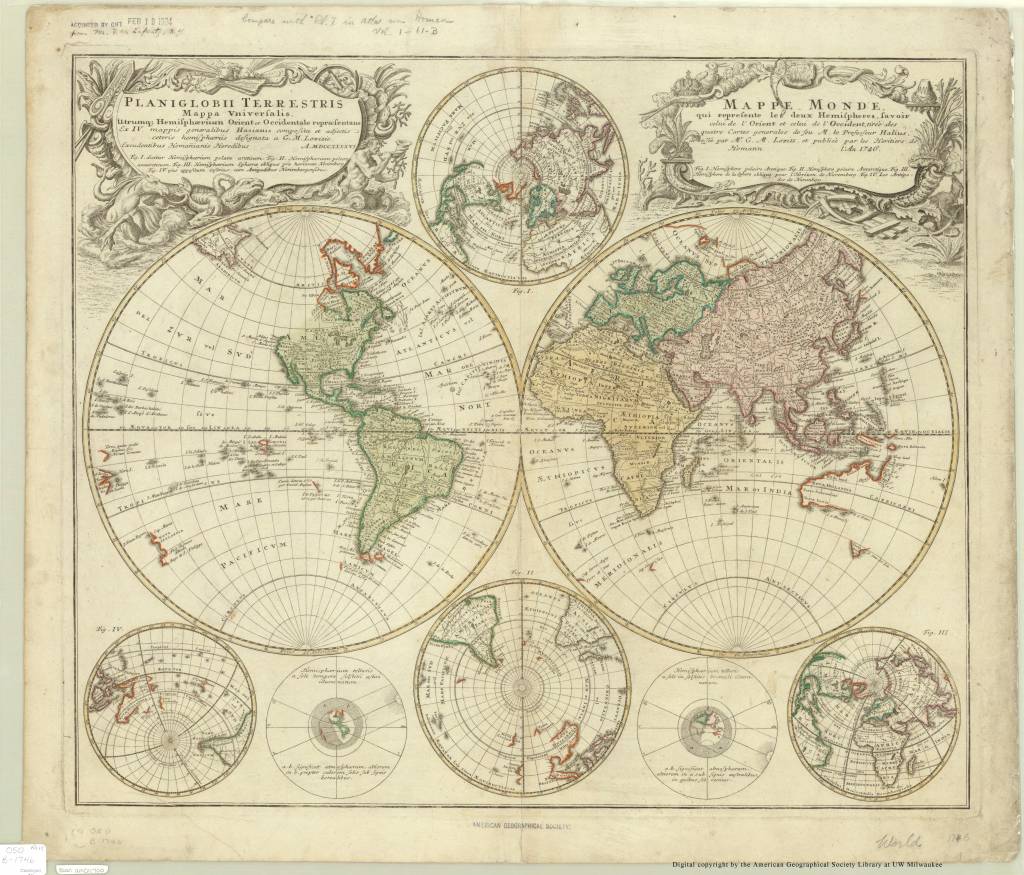
Planiglobii terrestris cum utroq hemisphaerio caelesti generalis repraesentatio : quam ex novissimis probatissimisque recentium geographorum scriptis concinnatam, multisq[ue] phaenomenis illustratam / publice proponit Io. Bapt. Homann …
1716
Call number: Rare 050 A-[1716]
https://collections.lib.uwm.edu/digital/collection/agdm/id/1156
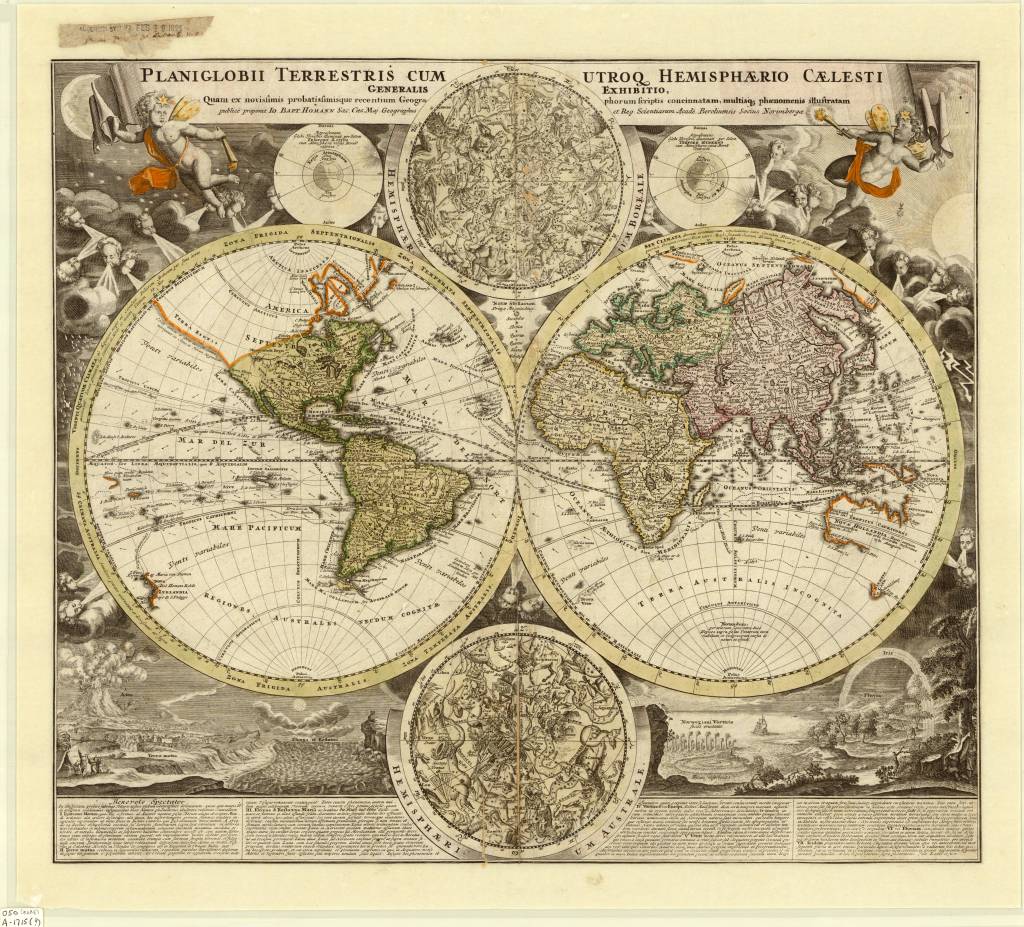
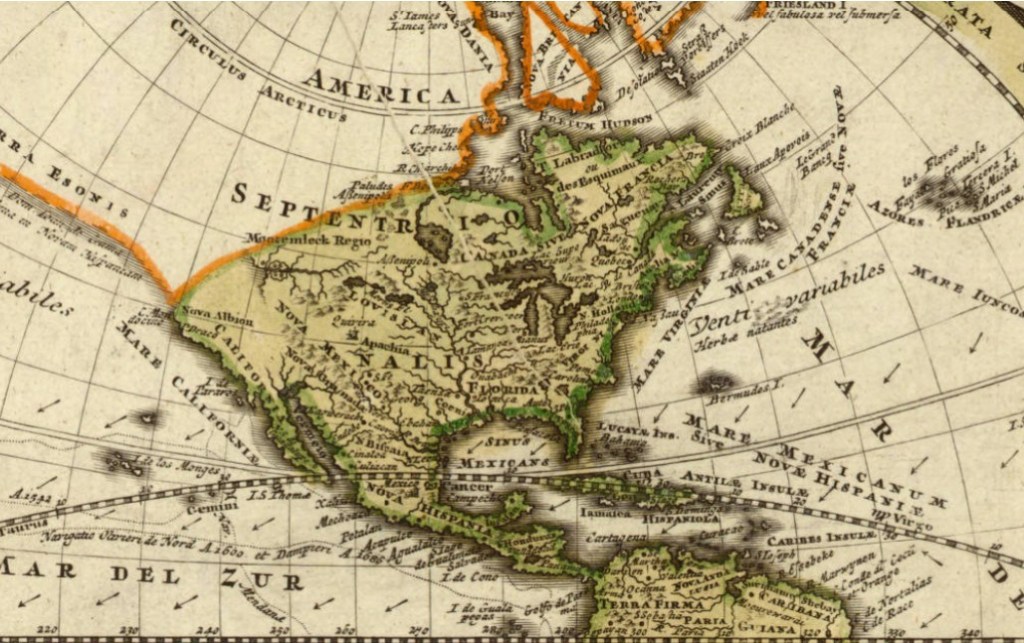
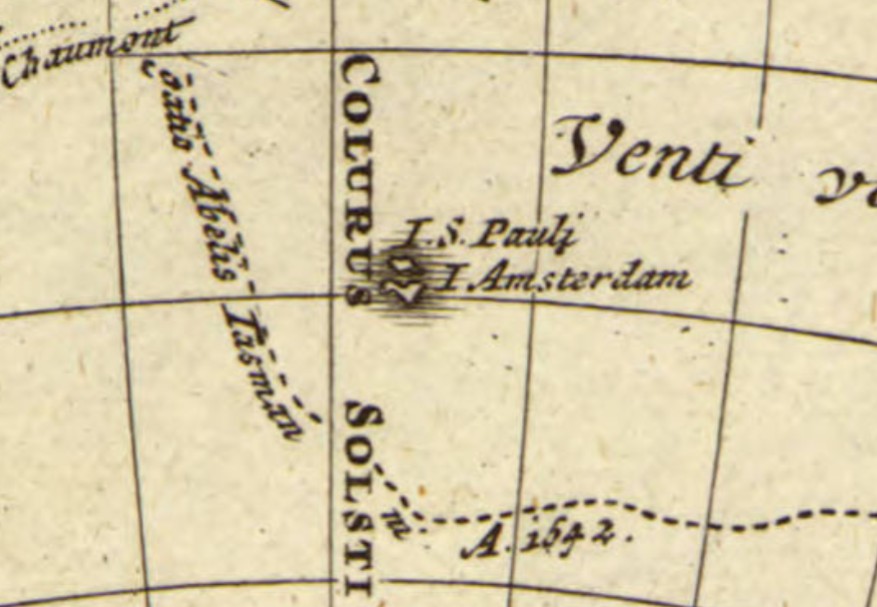
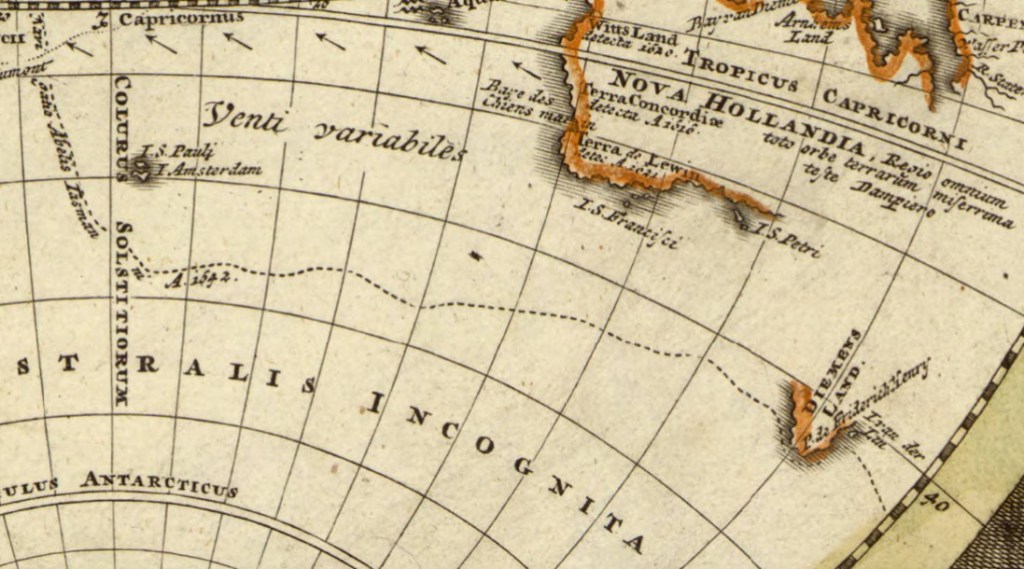
Here is a 1716 map by Johann Baptist Homann from a period in history when geographic knowledge was often unknown. The Australia, New Guinea and New Zealand coastlines are all incomplete, though they include some place names, notes of the early discoverers and tracks of Magellan’s (1522) and Tasman’s (1642) voyages.
Cartographic inaccuracies can be seen on this map such as the east-west trend of the northwest coast of North America, the distorted treatment of Japan, and the absence of an Antarctic continent. However, California does appear as a peninsula.
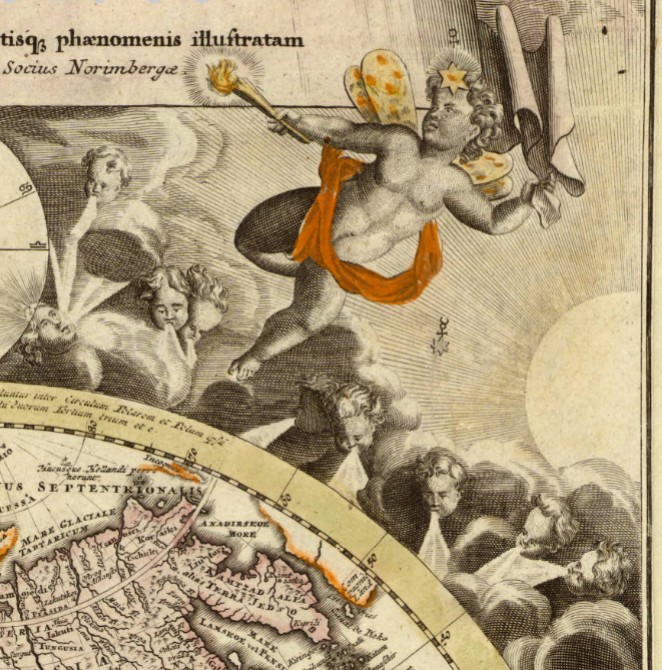
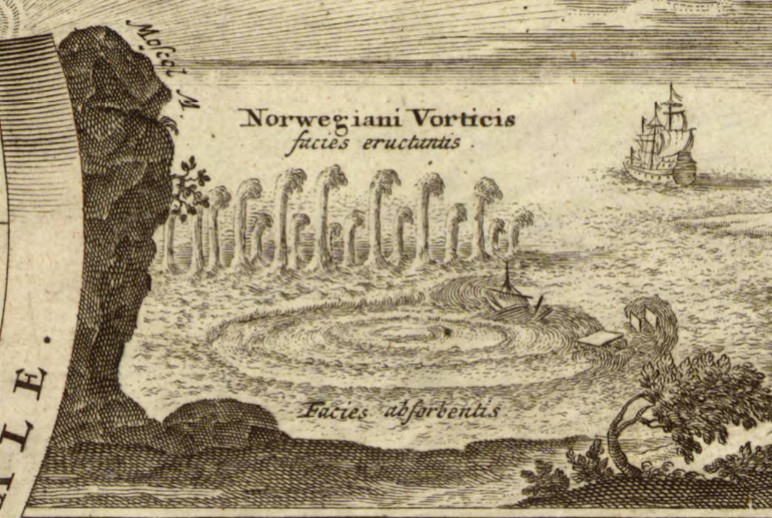
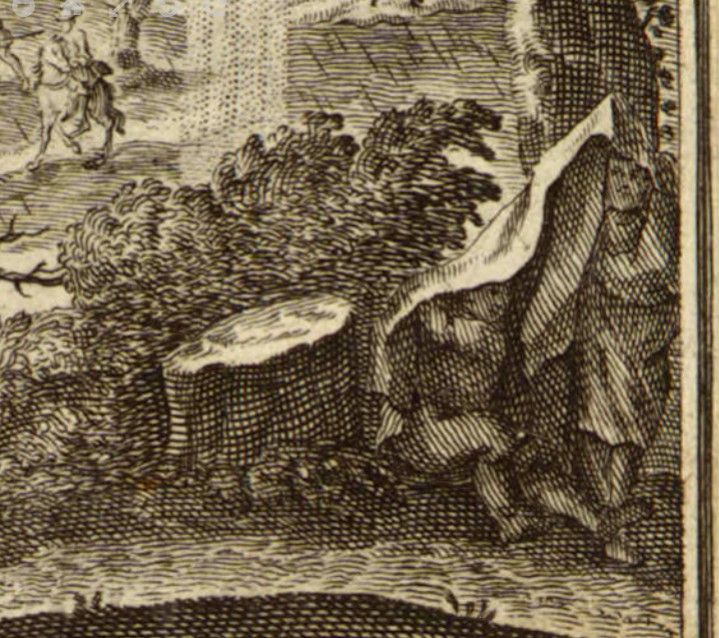
In spite of the inaccuracies, the map is appealing through the detailed use of decorative vignettes: two celestial hemispheres, an eruption of Mt. Etna, an earthquake, the tides, a whirlpool off the Norwegian coast, and diagrams explaining the seasons add interest. Numerous cherubs and windheads, representations of the stars, sun and moon and other decorative features also give the map added visual appeal.
Planiglobii Terrestris was produced by Johann Homann (1663-1724) and first appeared in his Neuer Atlas (1707). Homann was a leading figure in the scientific community of Nuremburg and the preeminent German cartographic publisher of his time.
This map came to the AGS of NY in 1924 as a gift from Mr. F.W. Lafrentz who also donated a 1746 Planiglobii Terrestris.
https://collections.lib.uwm.edu/digital/collection/agdm/id/1215/rec/1
Teaching European Colonialism
by Georgia Brown
This summer the AGSL K-12 Fellowship went virtual! Our Public Services Librarian worked with four awesome teachers in the Milwaukee area as they developed curriculum for their upcoming school years. To see the projects and lesson plans, check out the AGSL’s Resources for Educators.
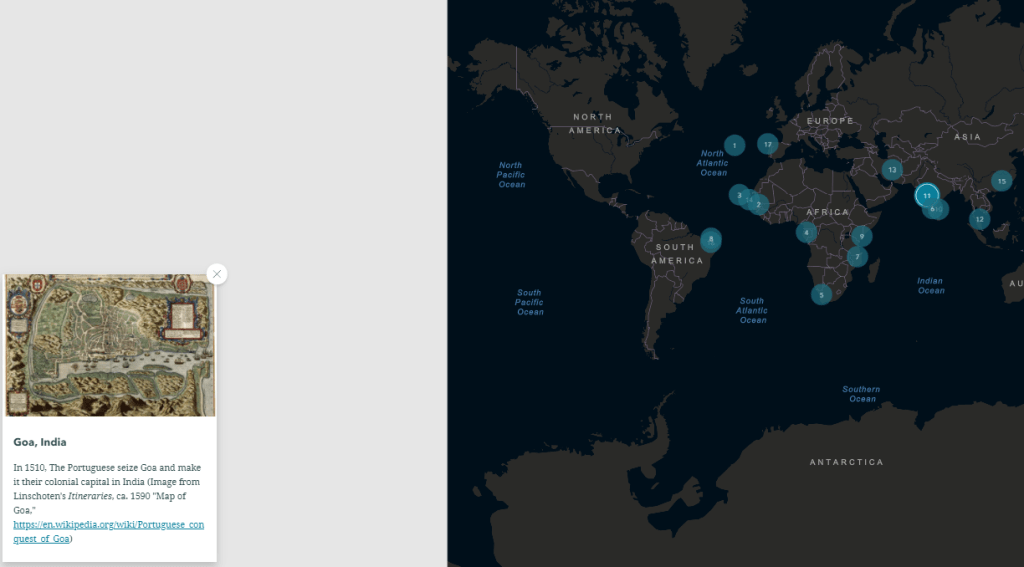
My name is Lukas Wierer, and I am a culturally responsive teacher leader in the Milwaukee Public Schools. I currently teach Ethnic Studies, Restorative Practices and Justice and You at Barack Obama School of Career and Technical Education. Obama is a K-12, but I teach in the high school, which is about 400 students, of which 98% are Black. The unit that I created will be used in my two sections of Ethnic Studies and was focused on European colonialism, specifically the impact that European colonization has had on formerly colonized nations. Throughout this unit, AGSL materials were used primarily as a way to show understanding. For example, I created an ArcGIS StoryMap (European Colonialism) that tracked colonial timelines for six European countries: Portugal, Spain, Great Britain, the Dutch (Netherlands), France, and Germany. Students were asked to examine the timelines, watch accompanying video clips, then, using the AGSL maps, they were asked to connect that content with the given map. I did identify a couple of images of statues/monuments that honor explorers whose “discoveries” were responsible for the resulting colonization of indigenous peoples. I also found a student article from the Black student newspaper, Invictus, entitled “Distortions of Colonization” which will be a good way to show a different perspective on colonialism, specifically the connection to exploitation that has emerged out of global capitalism.
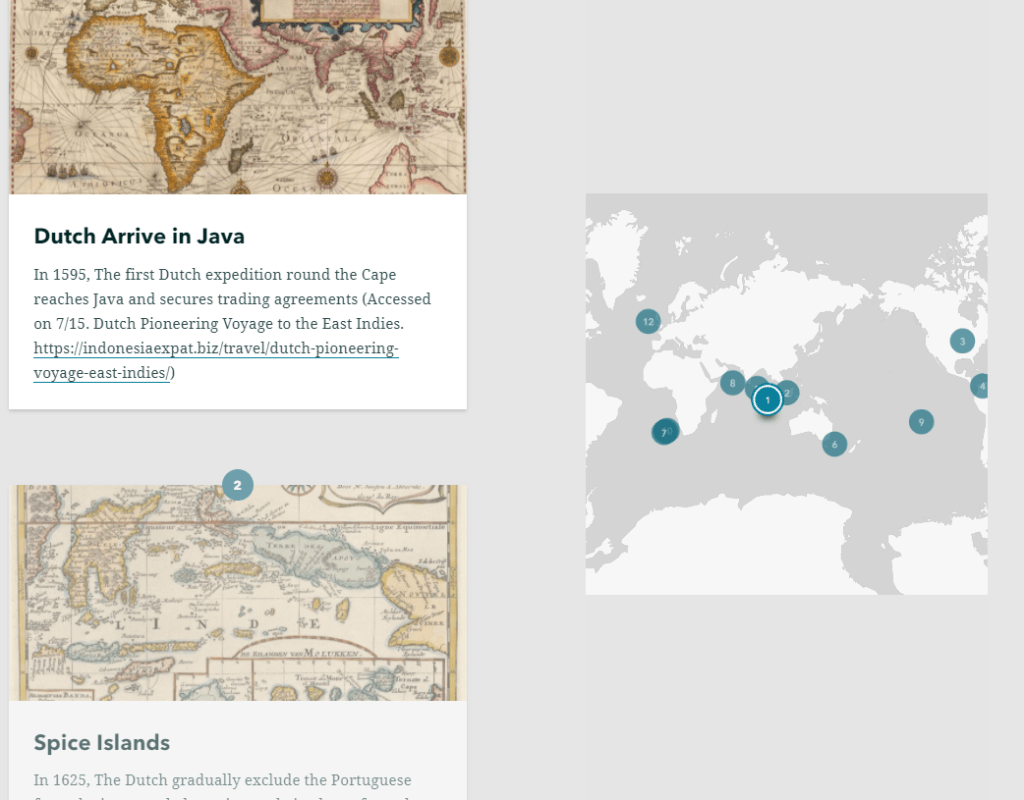
In terms of how I view this unit helping my students, it is part of a sequence. We begin the year by learning about Africa before European arrival, specifically how advanced Africa was economically and politically. This unit will follow immediately and give students a better understanding of how Africa came to be exploited not only for its human resources (through the slave trade), but also for its land and the natural resources that would enrich the colonizers. With these two units as a foundation, we will be able to further examine the role that colonization and global capitalism played in the formation of racist ideas that stick with us today. Although the transition to a virtual classroom will present challenges, I have taught Telepresence for the last two years, so I am not totally unfamiliar with some strategies, but I imagine for this unit, we will spend a lot of our class time really diving deep into the AGSL maps. Because map skills are not typically real strong with my students, this is an area that I will want to explore as a group. The StoryMap and videos should be a little more straightforward for my students. I look forward to using this unit with my students and continuing to blog about how it went.
Map of the Caribbean by Jean-Baptiste Bourgulgnon d’Anville, 1731
By Angie Cope
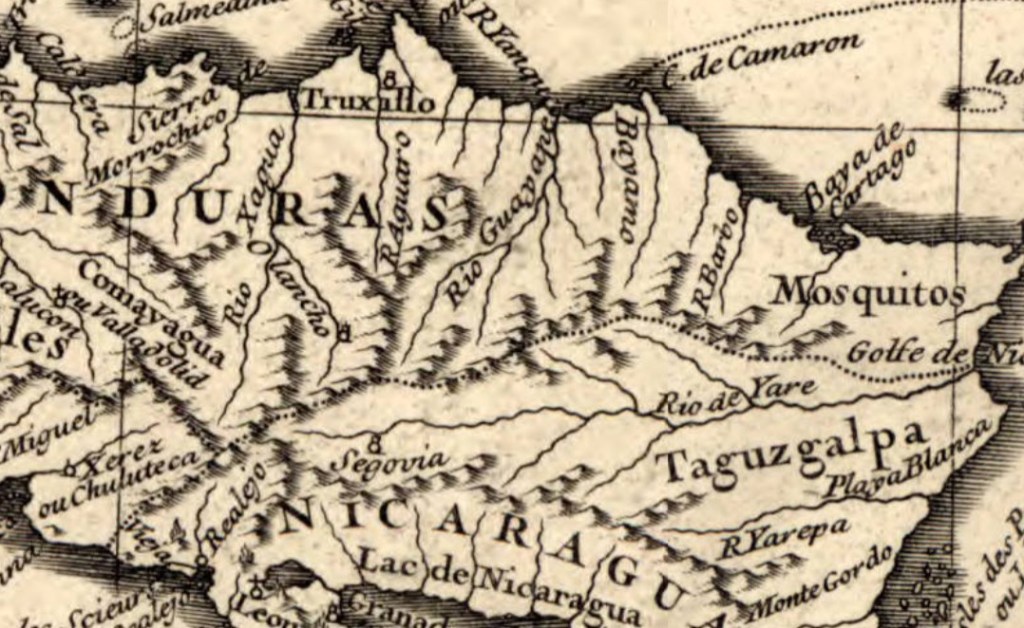
This 1731 map of the Caribbean was originally created to be part of one of the first histories of the Caribbean entitled: Histoire de L’Isle Espagnole ou de S. Domingue by Father Pierre François Xavier de Charlevoix. The map was reproduced and corrected a number of times and this copy reflects the second state of the first edition of the map. French geographer Jean-Baptiste Bourgulgnon d’Anville (1697-1782), the creator of this map, is cited as greatly developing the technical proficiency of mapmaking during his lifetime.
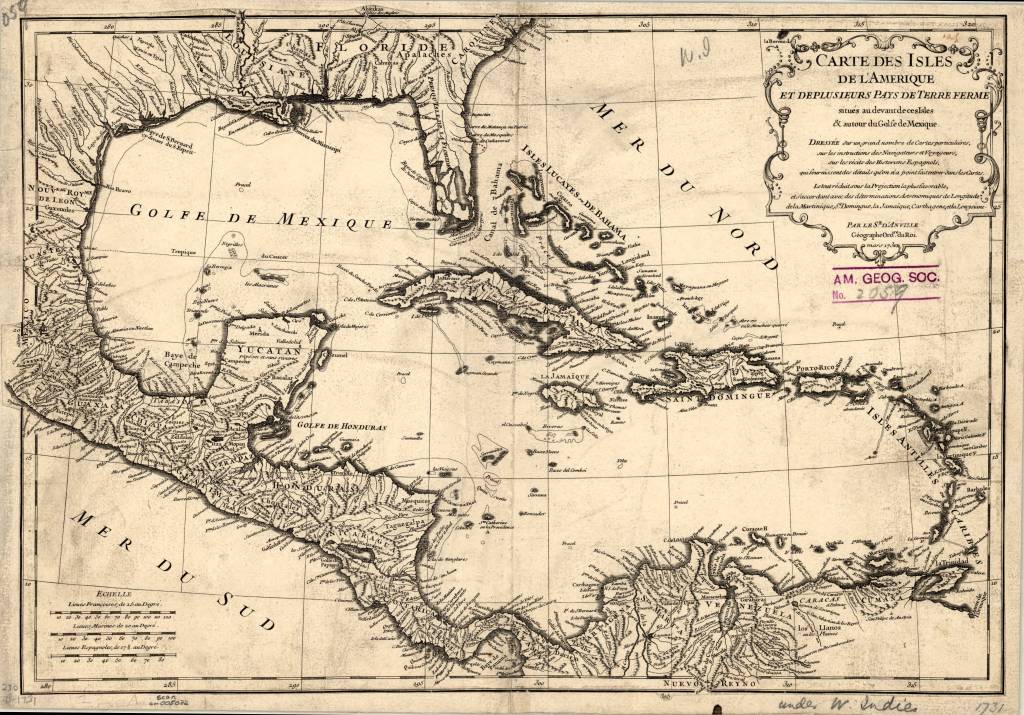
The maps shows the Florida Keys at the south emphasizing their archipelagic nature. River and waterway details are abundant with the entrances to major rivers shown such as the Mississippi, the Rio Bravo and the Orinoco. Terrain is show with illustrations of mountains.
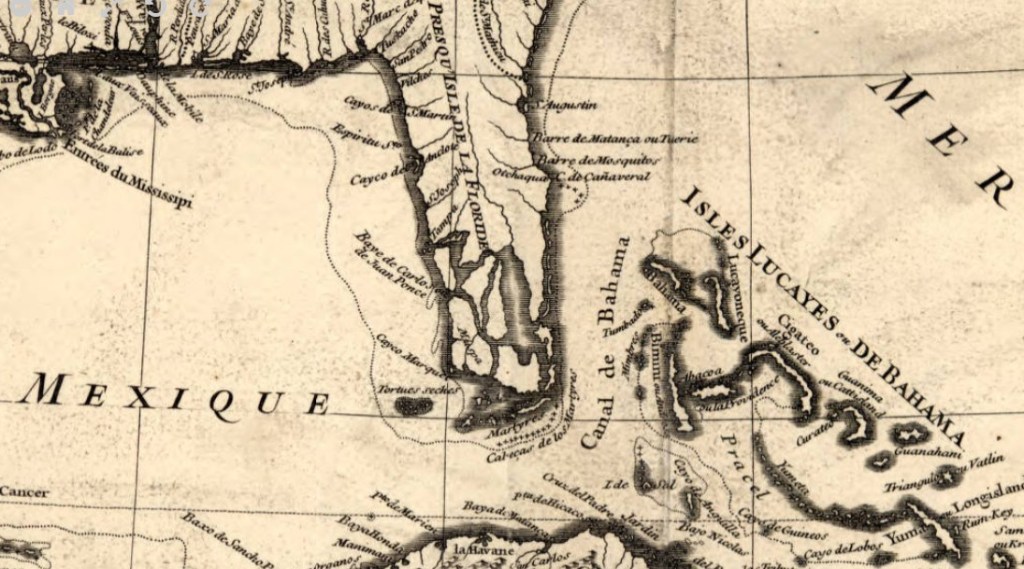
Text in decorative cartouche in upper right translates to:
Map of the isles of America and several countries of the mainland located in front of these Isles & around the Gulf of Mexico.
Made based on a large number of particular maps, on the instructions of navigators and travelers, on the recitals of the Spanish historians, which furnish details which have not been entered into the maps. The whole diminishes under the most favorable projection, and agrees with astronomical determinations of longitude of Martinique, Santo Domingo, Jamaica, Cartagena, and Louysiana
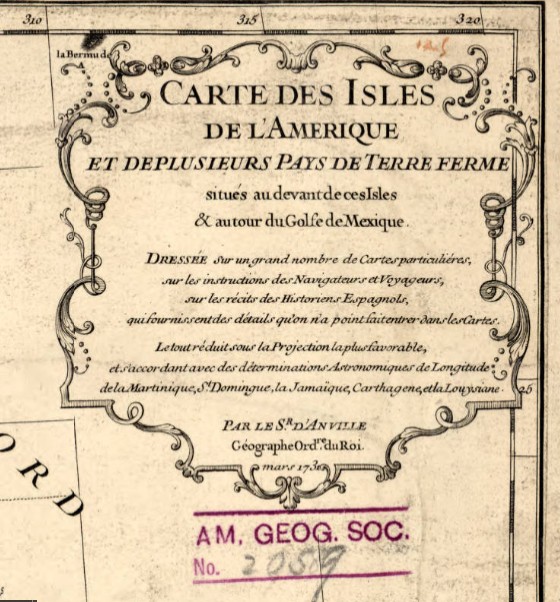
Title: Carte des isles de l’Amerique et de plusieurs pays de terre ferme situes au devant de ces isles & autour du Golfe de Mexique / dressee sur un grand nombre de cartes particulieres, sur les instructions des navigateurs et voyageurs, sur les recits des historiens espagnols, qui fournissent des details quon na point fait entrer dans les cartes ; le tout reduit sous la projection la plus favorable et s’accordant avec des determinations astronomiques de longitude de la Martinique, St. Domingue, la Jamaique, Carthagene et la Louysiane ; par le sr. d’Anville, geographe ordre. du roi, mars 1731 ; Delahaye sculpsit.
Call number: (AGS) (RARE) 230 B-1731
Scale: 1:10,000,000
Published by: Jean-Baptiste Bourgulgnon d’Anville in Paris
Dimensions: 1 map ; 31 x 44 cm
View map in the Digital Collection: https://collections.lib.uwm.edu/digital/collection/agdm/id/361/rec/1
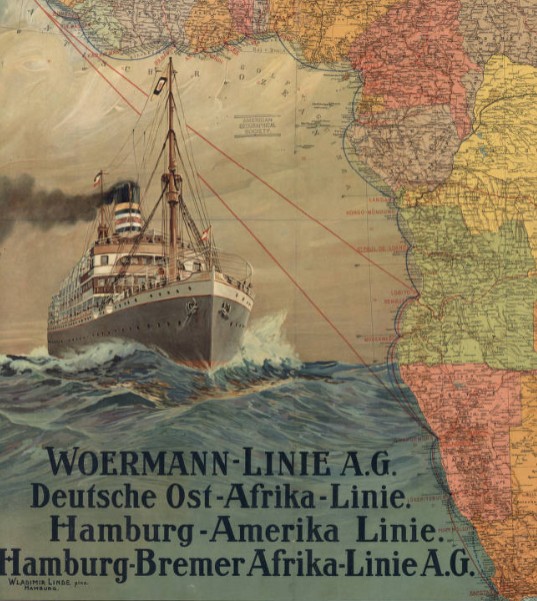
Ocean liner routes between Germany and Africa, 1914
by Angie Cope
Afrika / Geograph. Anstalt von Wagner & Debes, ; L. Friederichsen & Co. ; Woermann-Linie A.G.
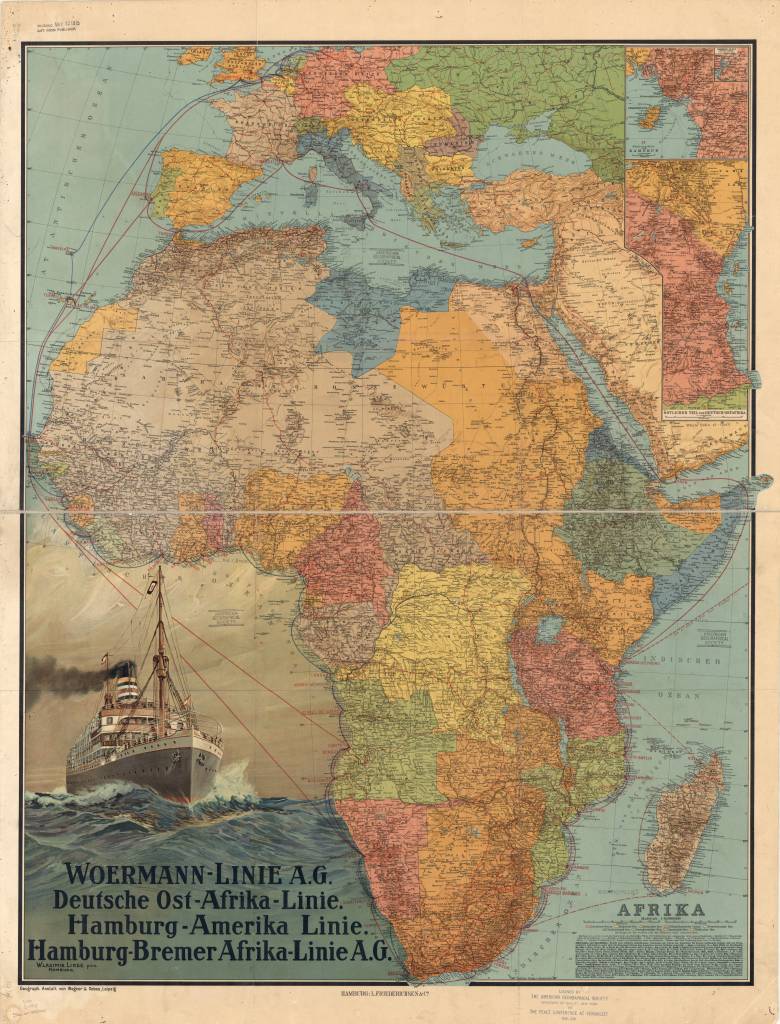
This map of Africa was published in Germany in 1914, shortly before the outbreak of World War I. It shows the ocean liner routes between Germany and Africa, as well as coastal and inland routes.
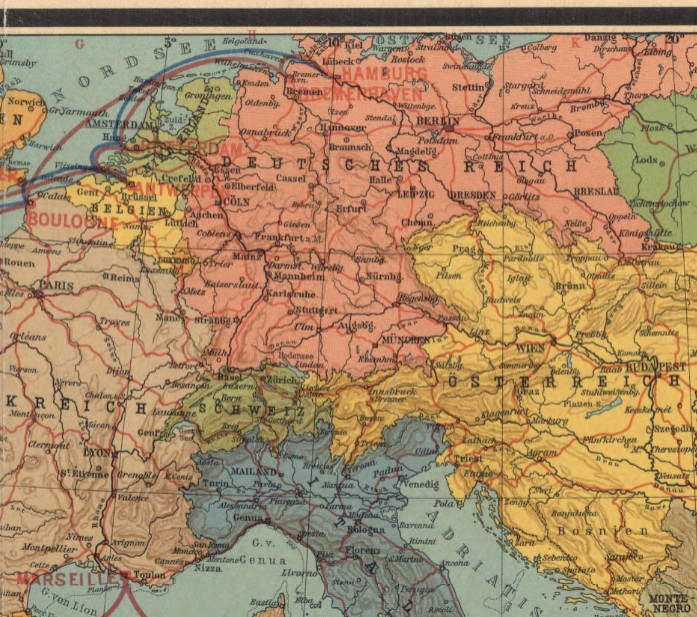
Relief is shown by hachures and spot elevations. In the lower left are an illustration of a steamship on the high seas and a listing of the major German steamship lines providing service to Africa, Woermann-Linie A.G., Deutsche Ost-Afrika Linie, Hamburg-Amerika Linie, and Hamburg-Bremer Afrika-Linie A.G.
In the upper right is an inset map of the coastal region of the German colony of Cameroon and an inset to the inset showing the inland course of the Cameroon River. Below these maps is another inset showing the eastern part of German East Africa. The key at the lower right indicates the wealth of information contained in the map.
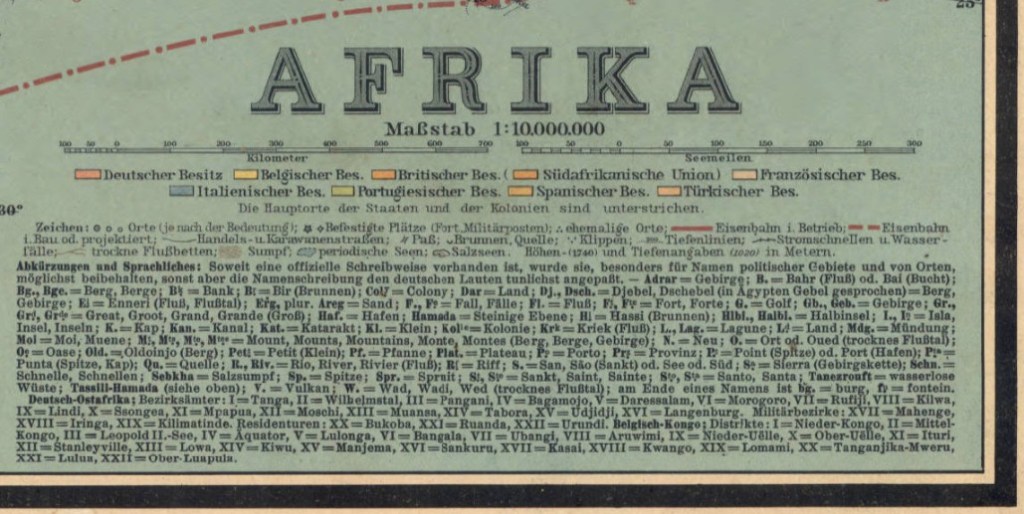
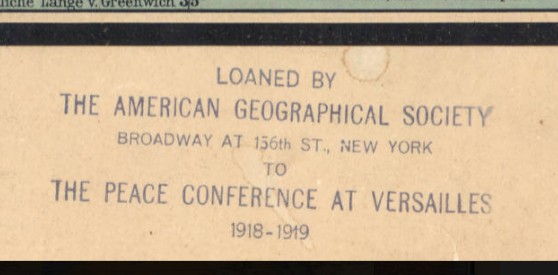
Two distance scales are provided, kilometers and nautical miles. Different colors are used to mark the colonial possessions of Germany, Great Britain, Belgium, France, Italy, Portugal, Spain, and Turkey. Symbols indicate cities and towns by population size, forts and military posts, ruins, railroads (operational and planned), caravan routes, mountain passes, wells and springs, and swamps and other geographic features. There is an alphabetical list of abbreviations for geographic terms in local languages and their German equivalents. Roman numerals are used to identify the districts and other administrative divisions in the Belgian Congo and German East Africa. The map was prepared by Wagner & Debes, a German firm that specialized in providing maps for inclusion in the famous guidebooks for travelers published by Karl Baedeker in the 19th and early 20th centuries. A stamp at the bottom indicates that the map was loaned by the American Geographical Society of New York to the Peace Conference at Versailles, 1919.
View map in the American Geographical Society Library Digital Map Collection
https://collections.lib.uwm.edu/digital/collection/agdm/id/364/rec/1
- ← Previous
- 1
- 2
- 3
- …
- 8
- Next →
