Map Collection
How Does Your Garden Grow? Imagining the Cemetery
By Lauren Maddox
As Halloween comes and goes, our minds drift to the dark and the macabre–we can’t help but think about spooky skeletons, werewolves, witches, ghosts, and vampires or about what those figures really represent to us: death. Death isn’t something people like to think about very much. America, in particular, has always held death at arms length with only squeamish acknowledgement.
The Church began to regulate burials around the 7th century across Europe–rituals for the dead and dying became increasingly Christian, and burying bodies in consecrated ground became an important tenant for dealing with the dead. In these early days of Christian burial, bodies were buried in mass graves so that the bones could be exhumed and stored in ossuaries in the walls of the church. But, due to lack of space, eventually bodies began to be buried in the church yard. Graves would be marked with simple stones, or is some cases, wooden crosses, unless the family was able to afford a more complicated memorial for their loved ones.
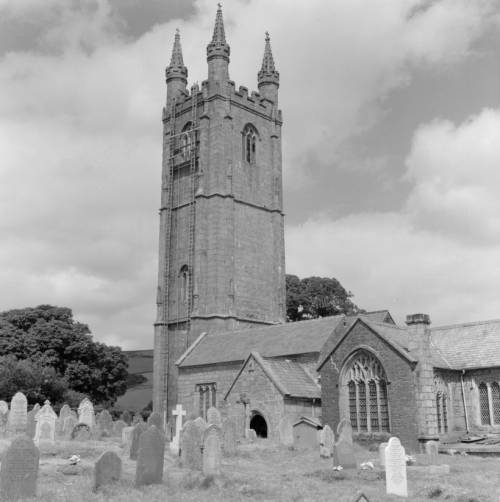
St. Pancras Church in Widecombe-in-the-Moor, England from the Clarence W. Sorenson Collection. Click the link to see this photo in our Digital Collections!
The churchyard grave was thought to be a place under the protection of the Church– it was a safe place where loved ones could be guaranteed to pass into an easy afterlife. But as populations boomed and the Industrial Revolution’s dangerous growth and unadulterated industry began to accumulate a body count, the ideation of the churchyard began to change. Instead of being a place where one might visit their loved ones and feel comforted by their presence, they became places in which disease festered and spread. Floods would unearth the recently buried and rain that passed through the churchyard might become contaminated. The proximity of the churchyard burial ceased to be a comfort and became a source of anxiety too-close-to-home.
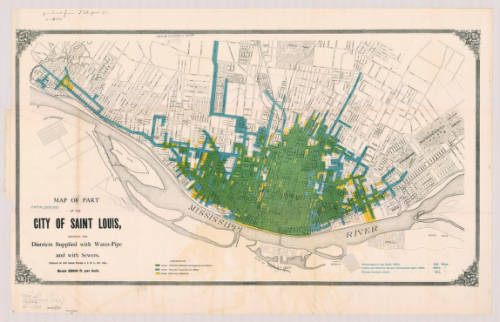
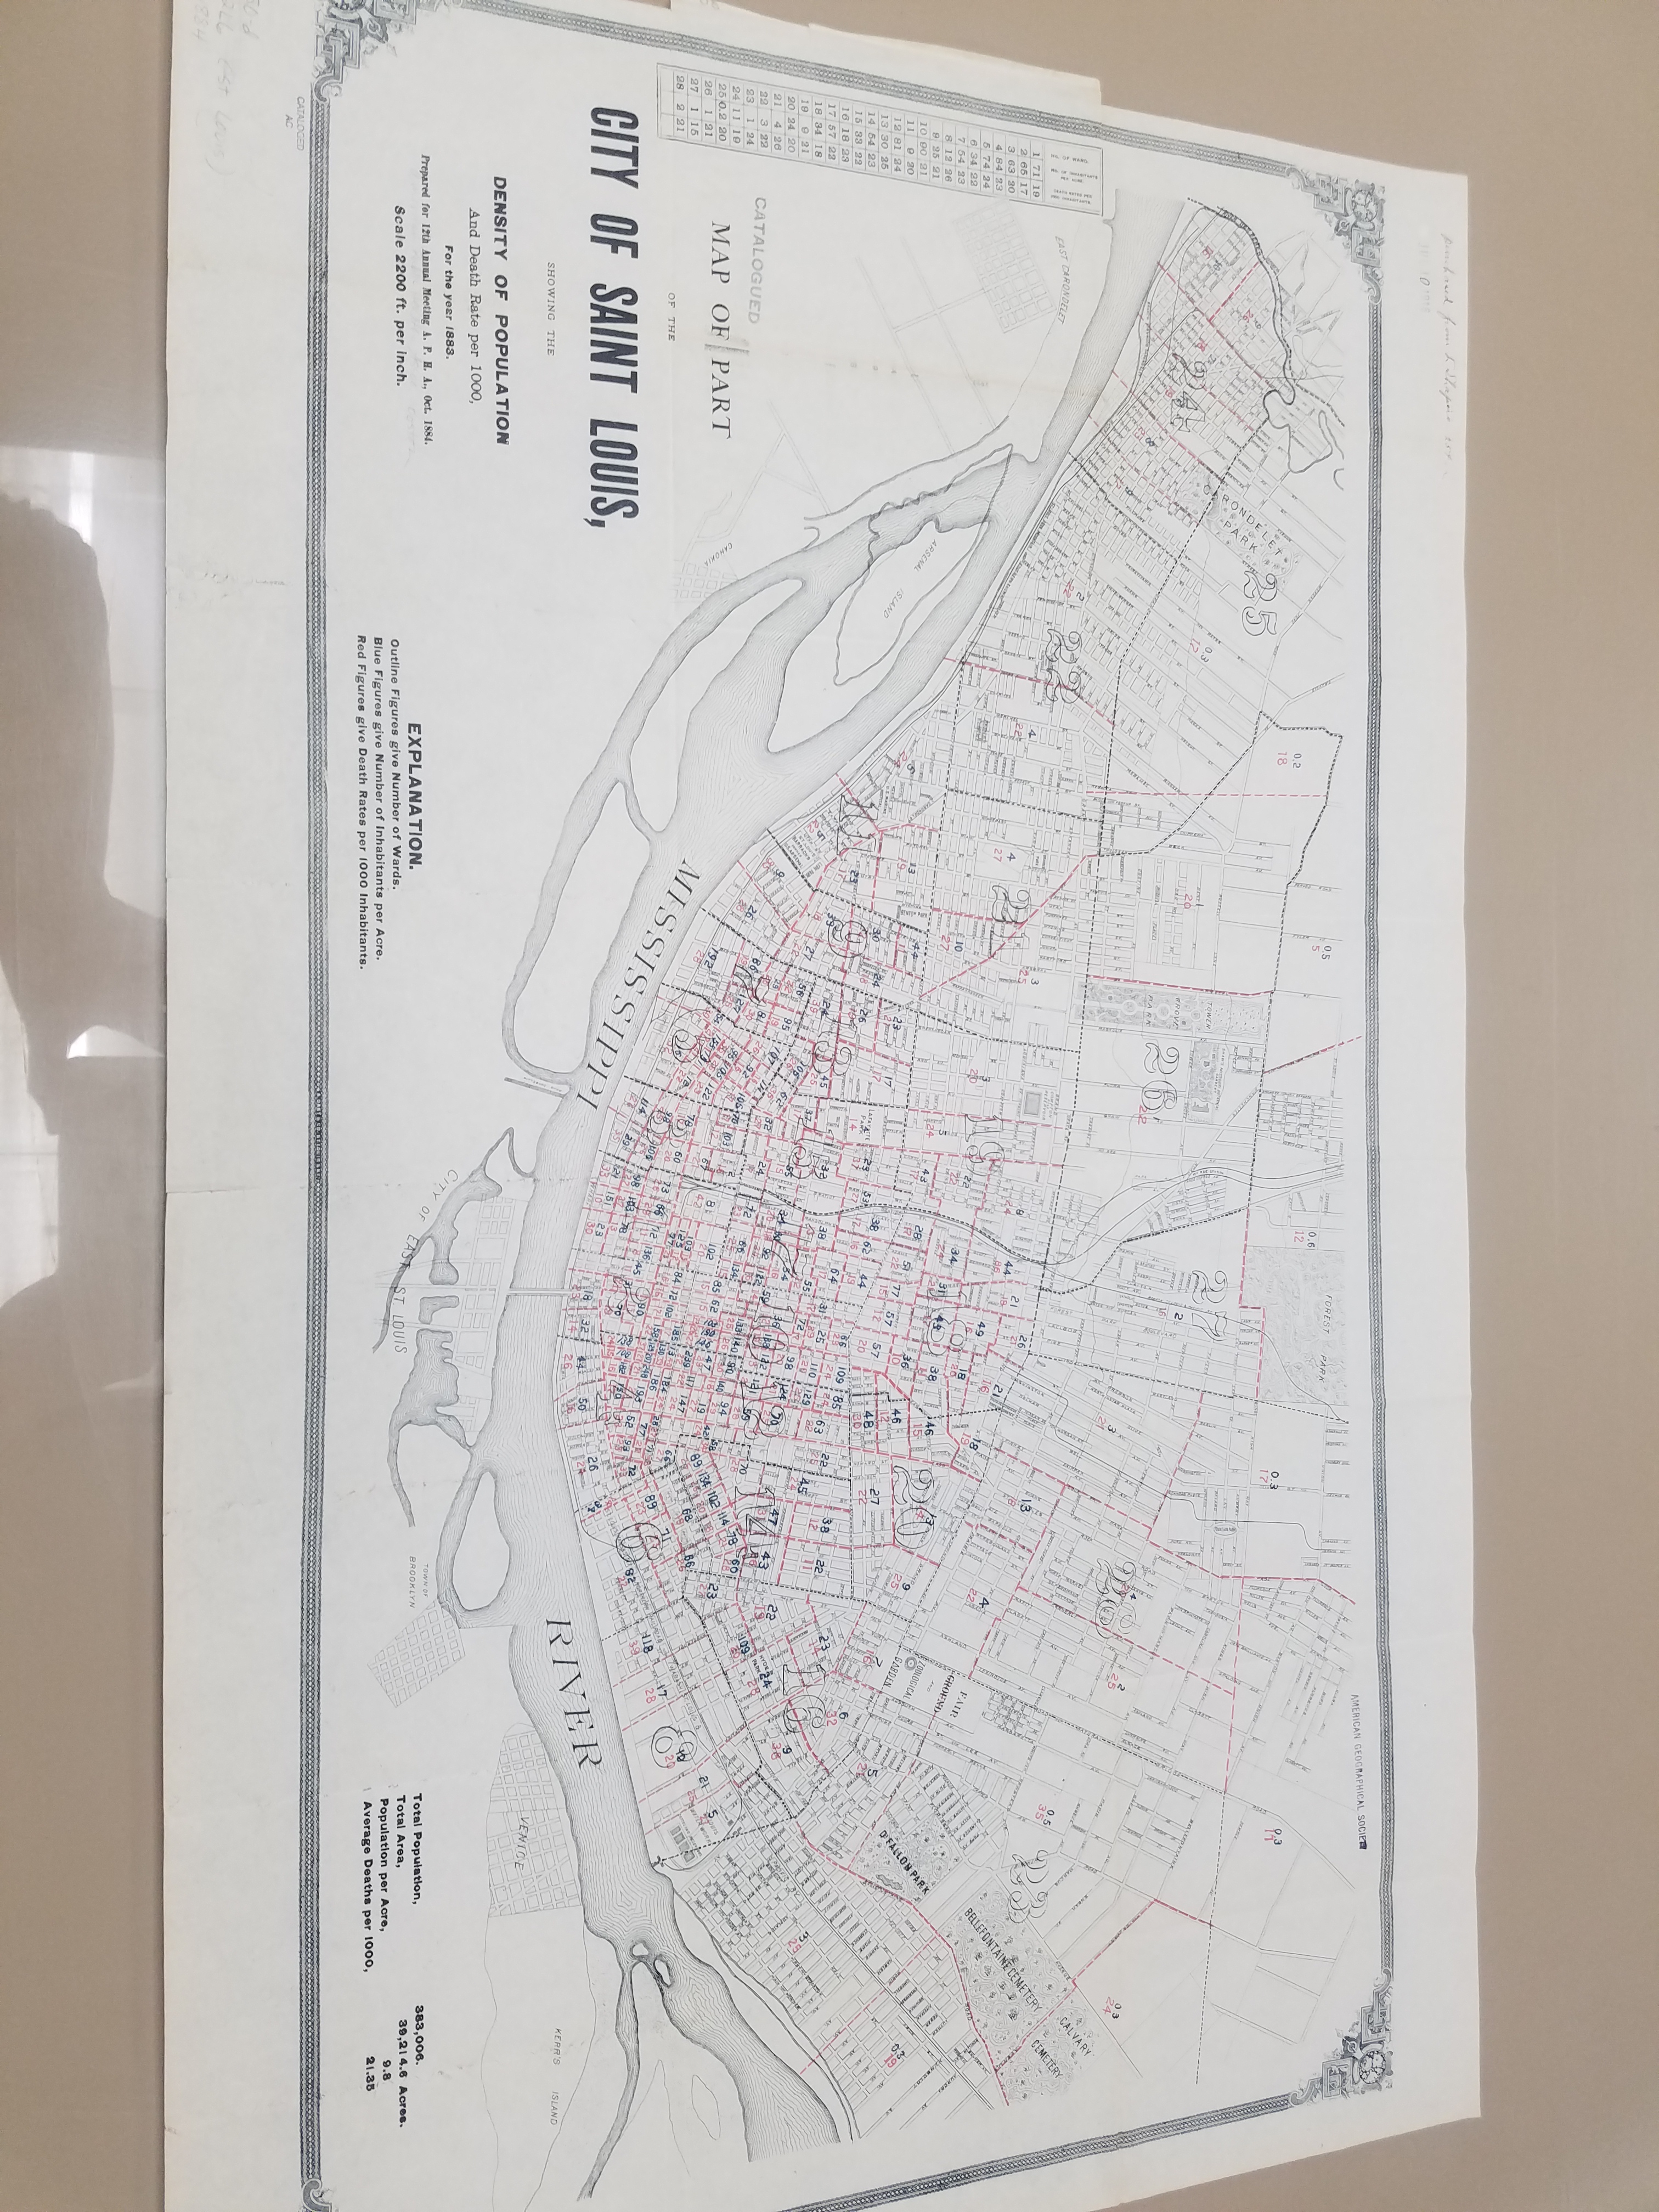
Map of St. Louis, MI in 1884. Click the link to see this map in our Digital Collections! 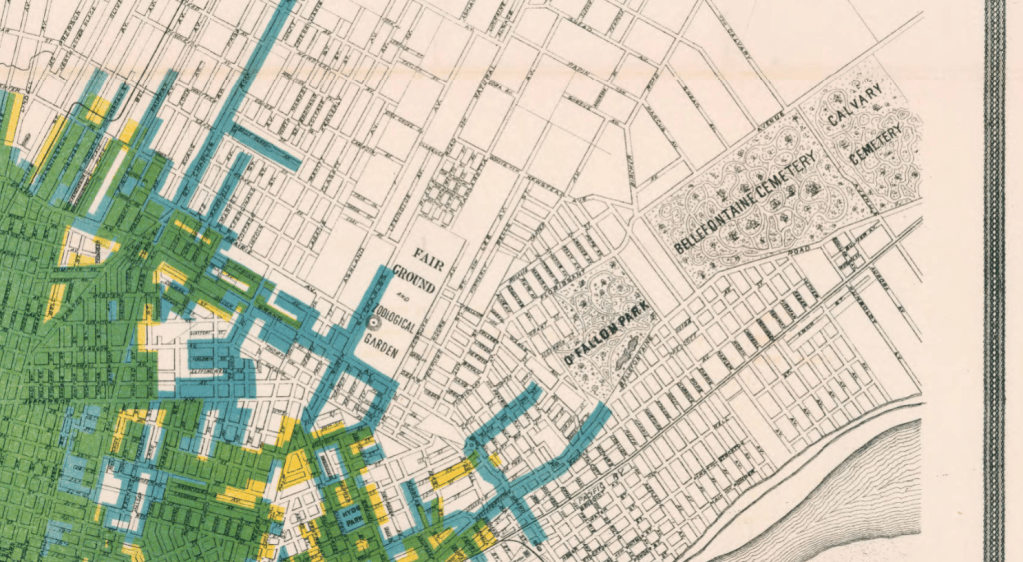
Detail from 1884 Map of St. Louis featuring the Bellefontaine Cemetery and the Calvary Cemetery.
Because of this, in the 19th century, the cemetery moved out of town. Death was an upsetting reality to have in your backyard for Americans, so cemeteries were moved away from the populated areas of the city and from the water supplies for the city. And, in a final symbolic gesture, cemeteries were gated to show that they were no longer part of the world of the living. Looking at these two late 19th century maps of St. Louis and Philadelphia, you can see how far out of town the cemeteries were moved for the safety and peace of mind of the living.
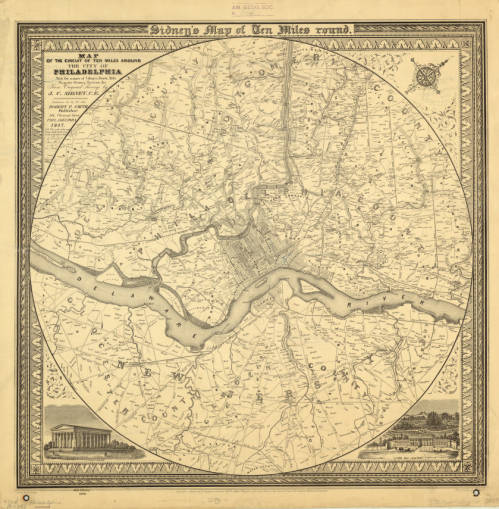
1847 Map of Philadelphia including multiple cemeteries. Click the link to see this map in our Digital Collections!
But, ironically, the cemetery also became like a public park. According to Keith Eggener, author of Cemeteries, cemeteries were free oases where people could escape the hustle and bustle of their city lives. People would bring picnics, bicycles, take strolls, and use the cemetery as a brief respite from daily life. They became immensely beautified– the cemetery was not only important as a place that separated the dead from the living, but also as a place that the living could visit at their leisure and leave again when they were satisfied.

Arlington National Cemetery from the Harrison Forman Collection. Click the link to see this photo in our Digital Collections!
We might be a little more comfortable with our cemeteries these days, but they’re still not going to be our ideal afternoon spot. But during Halloween season, when death is on our minds, it’s important to remember our relationship to the place where spooky skeletons and vampires reside. And maybe accept that those scary figures are pretty harmless– Savannah’s Bonaventure Cemetery is a beloved tourist destination, where people go to see the beautiful parks. But, remember– always “keep your distance, remain quiet and show respect for the dead.”
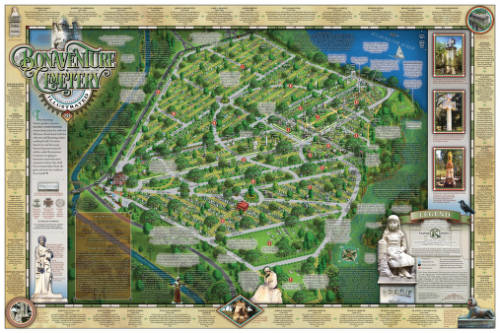
Illustrated Map of Bonaventure Cemetery in Savannah Georgia, 2016. Click the link to see this map in our Digital Collections! 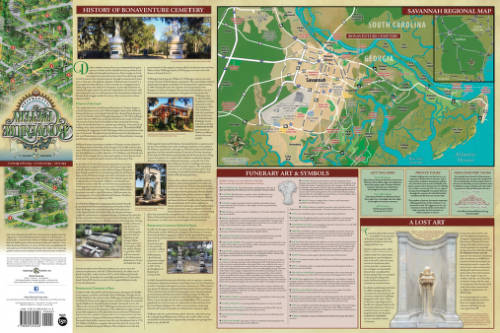
History of Bonaventure and Additional Information.
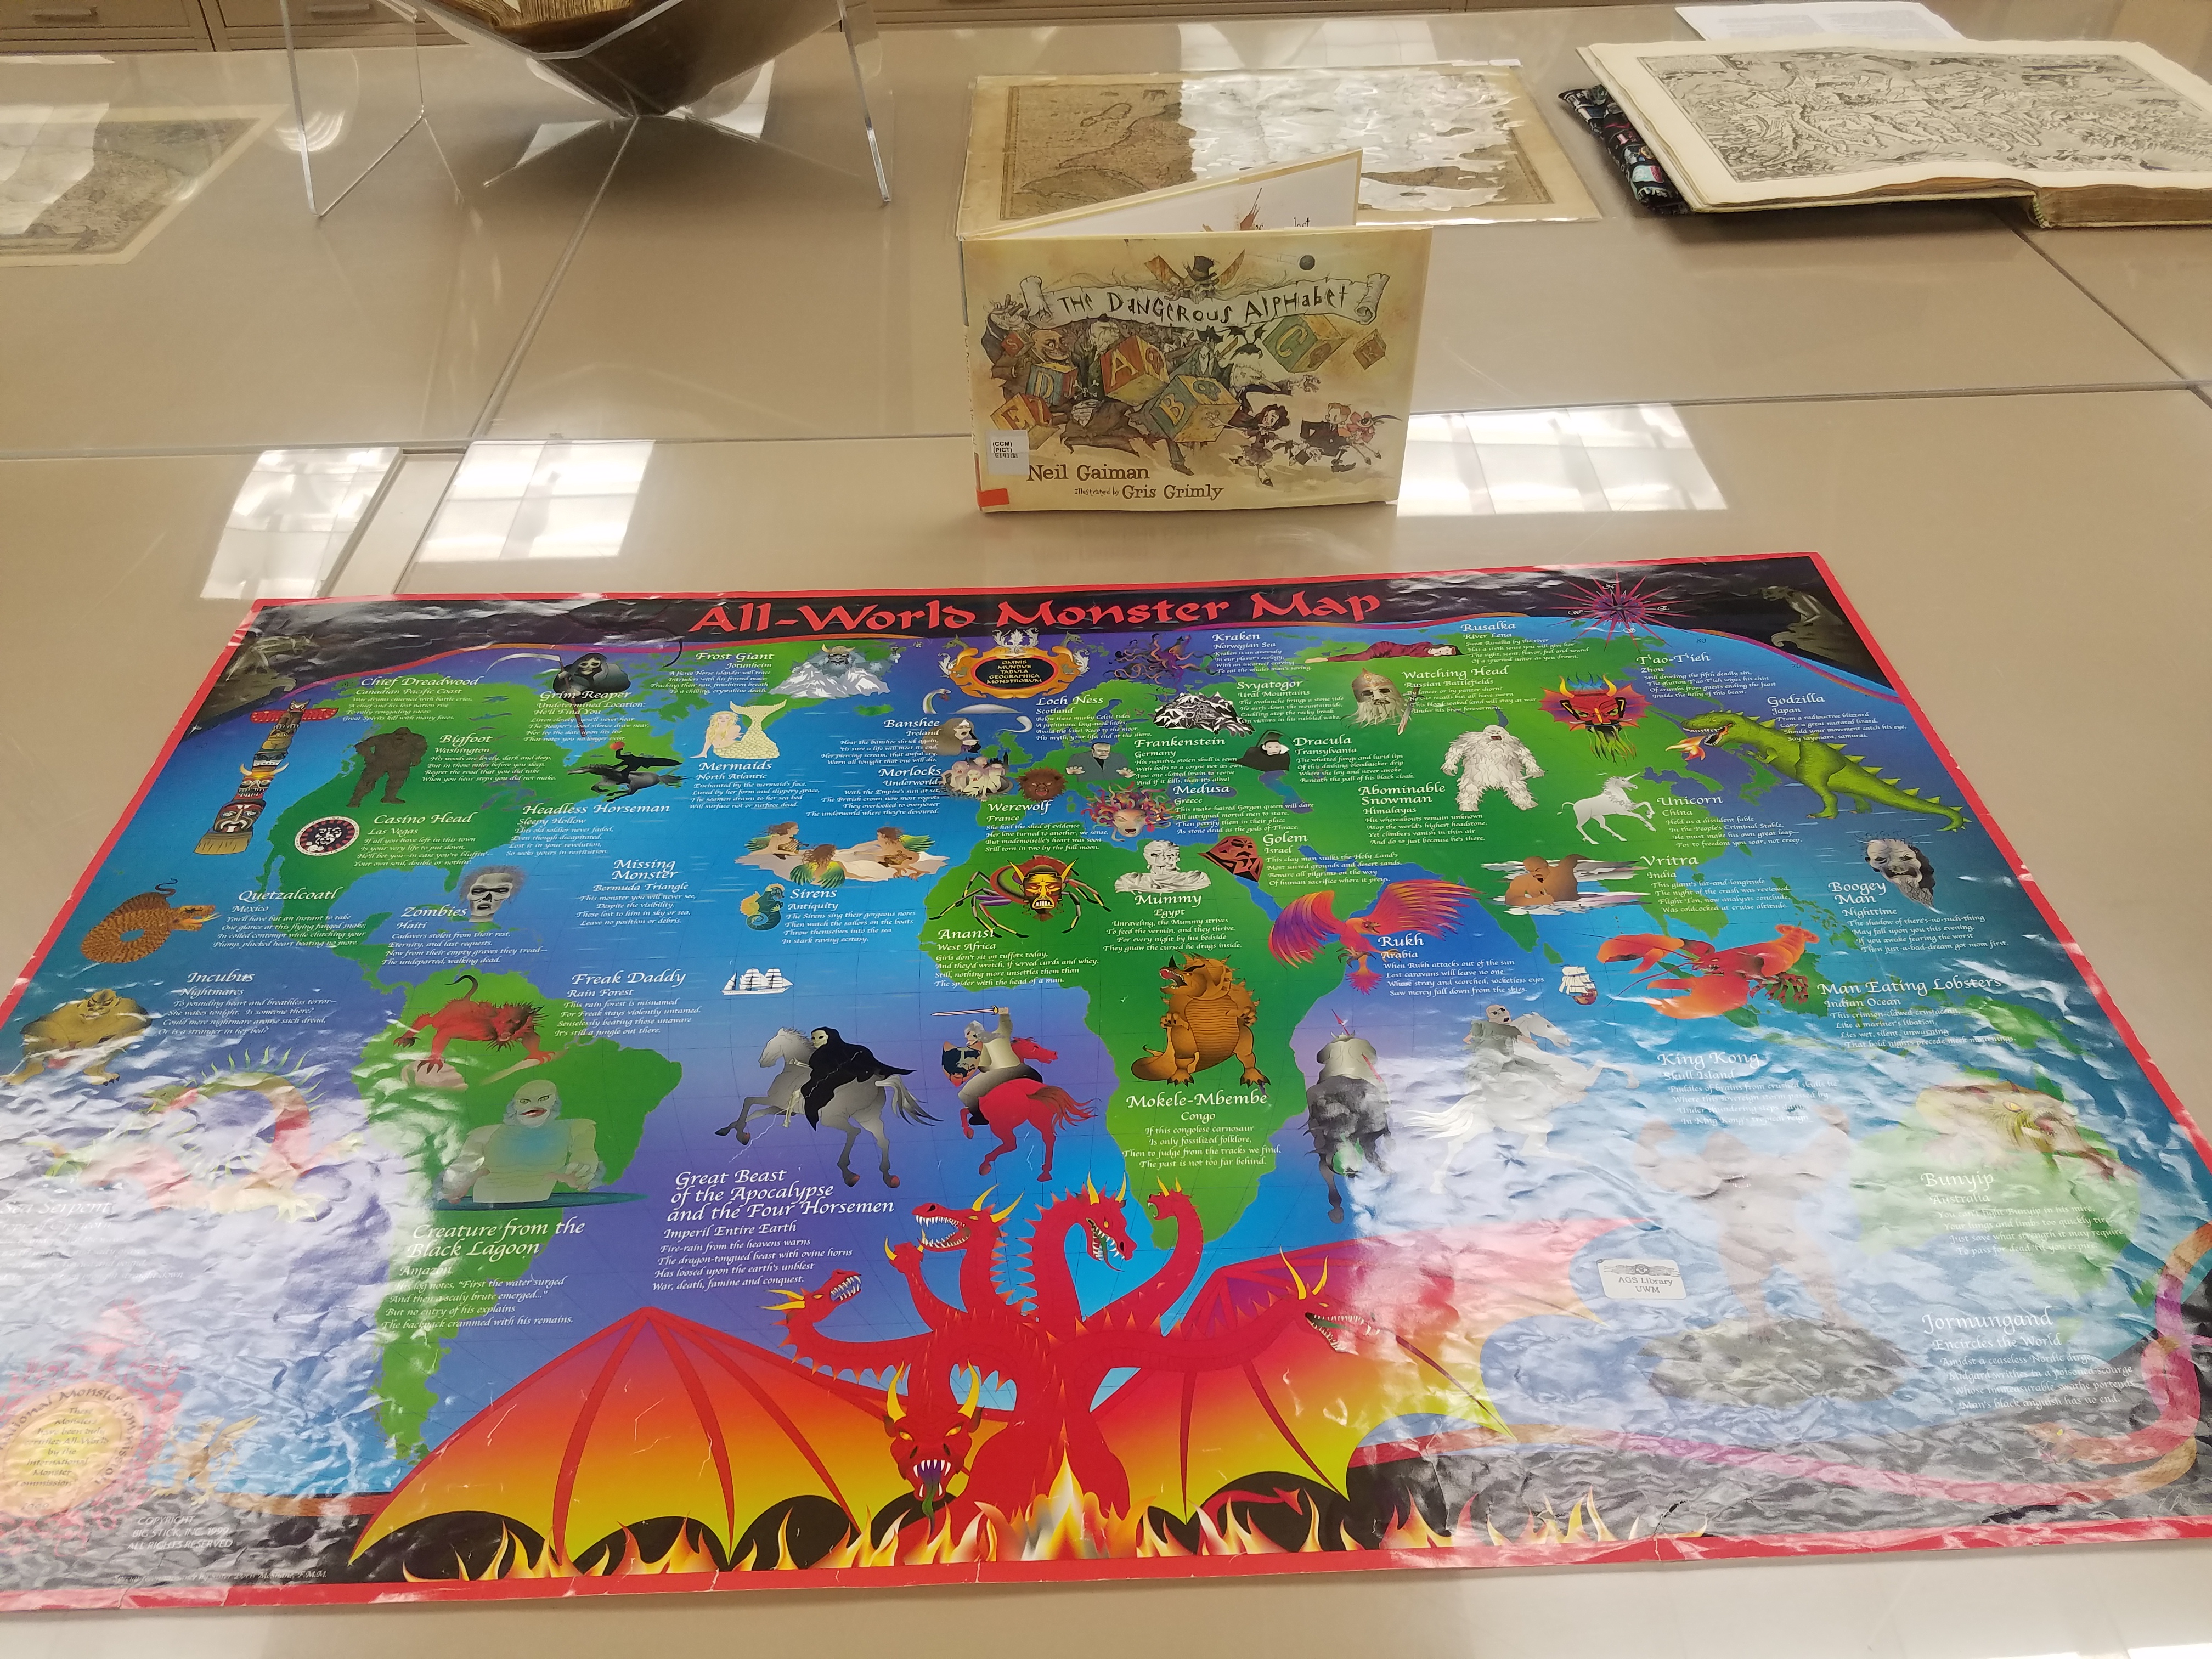
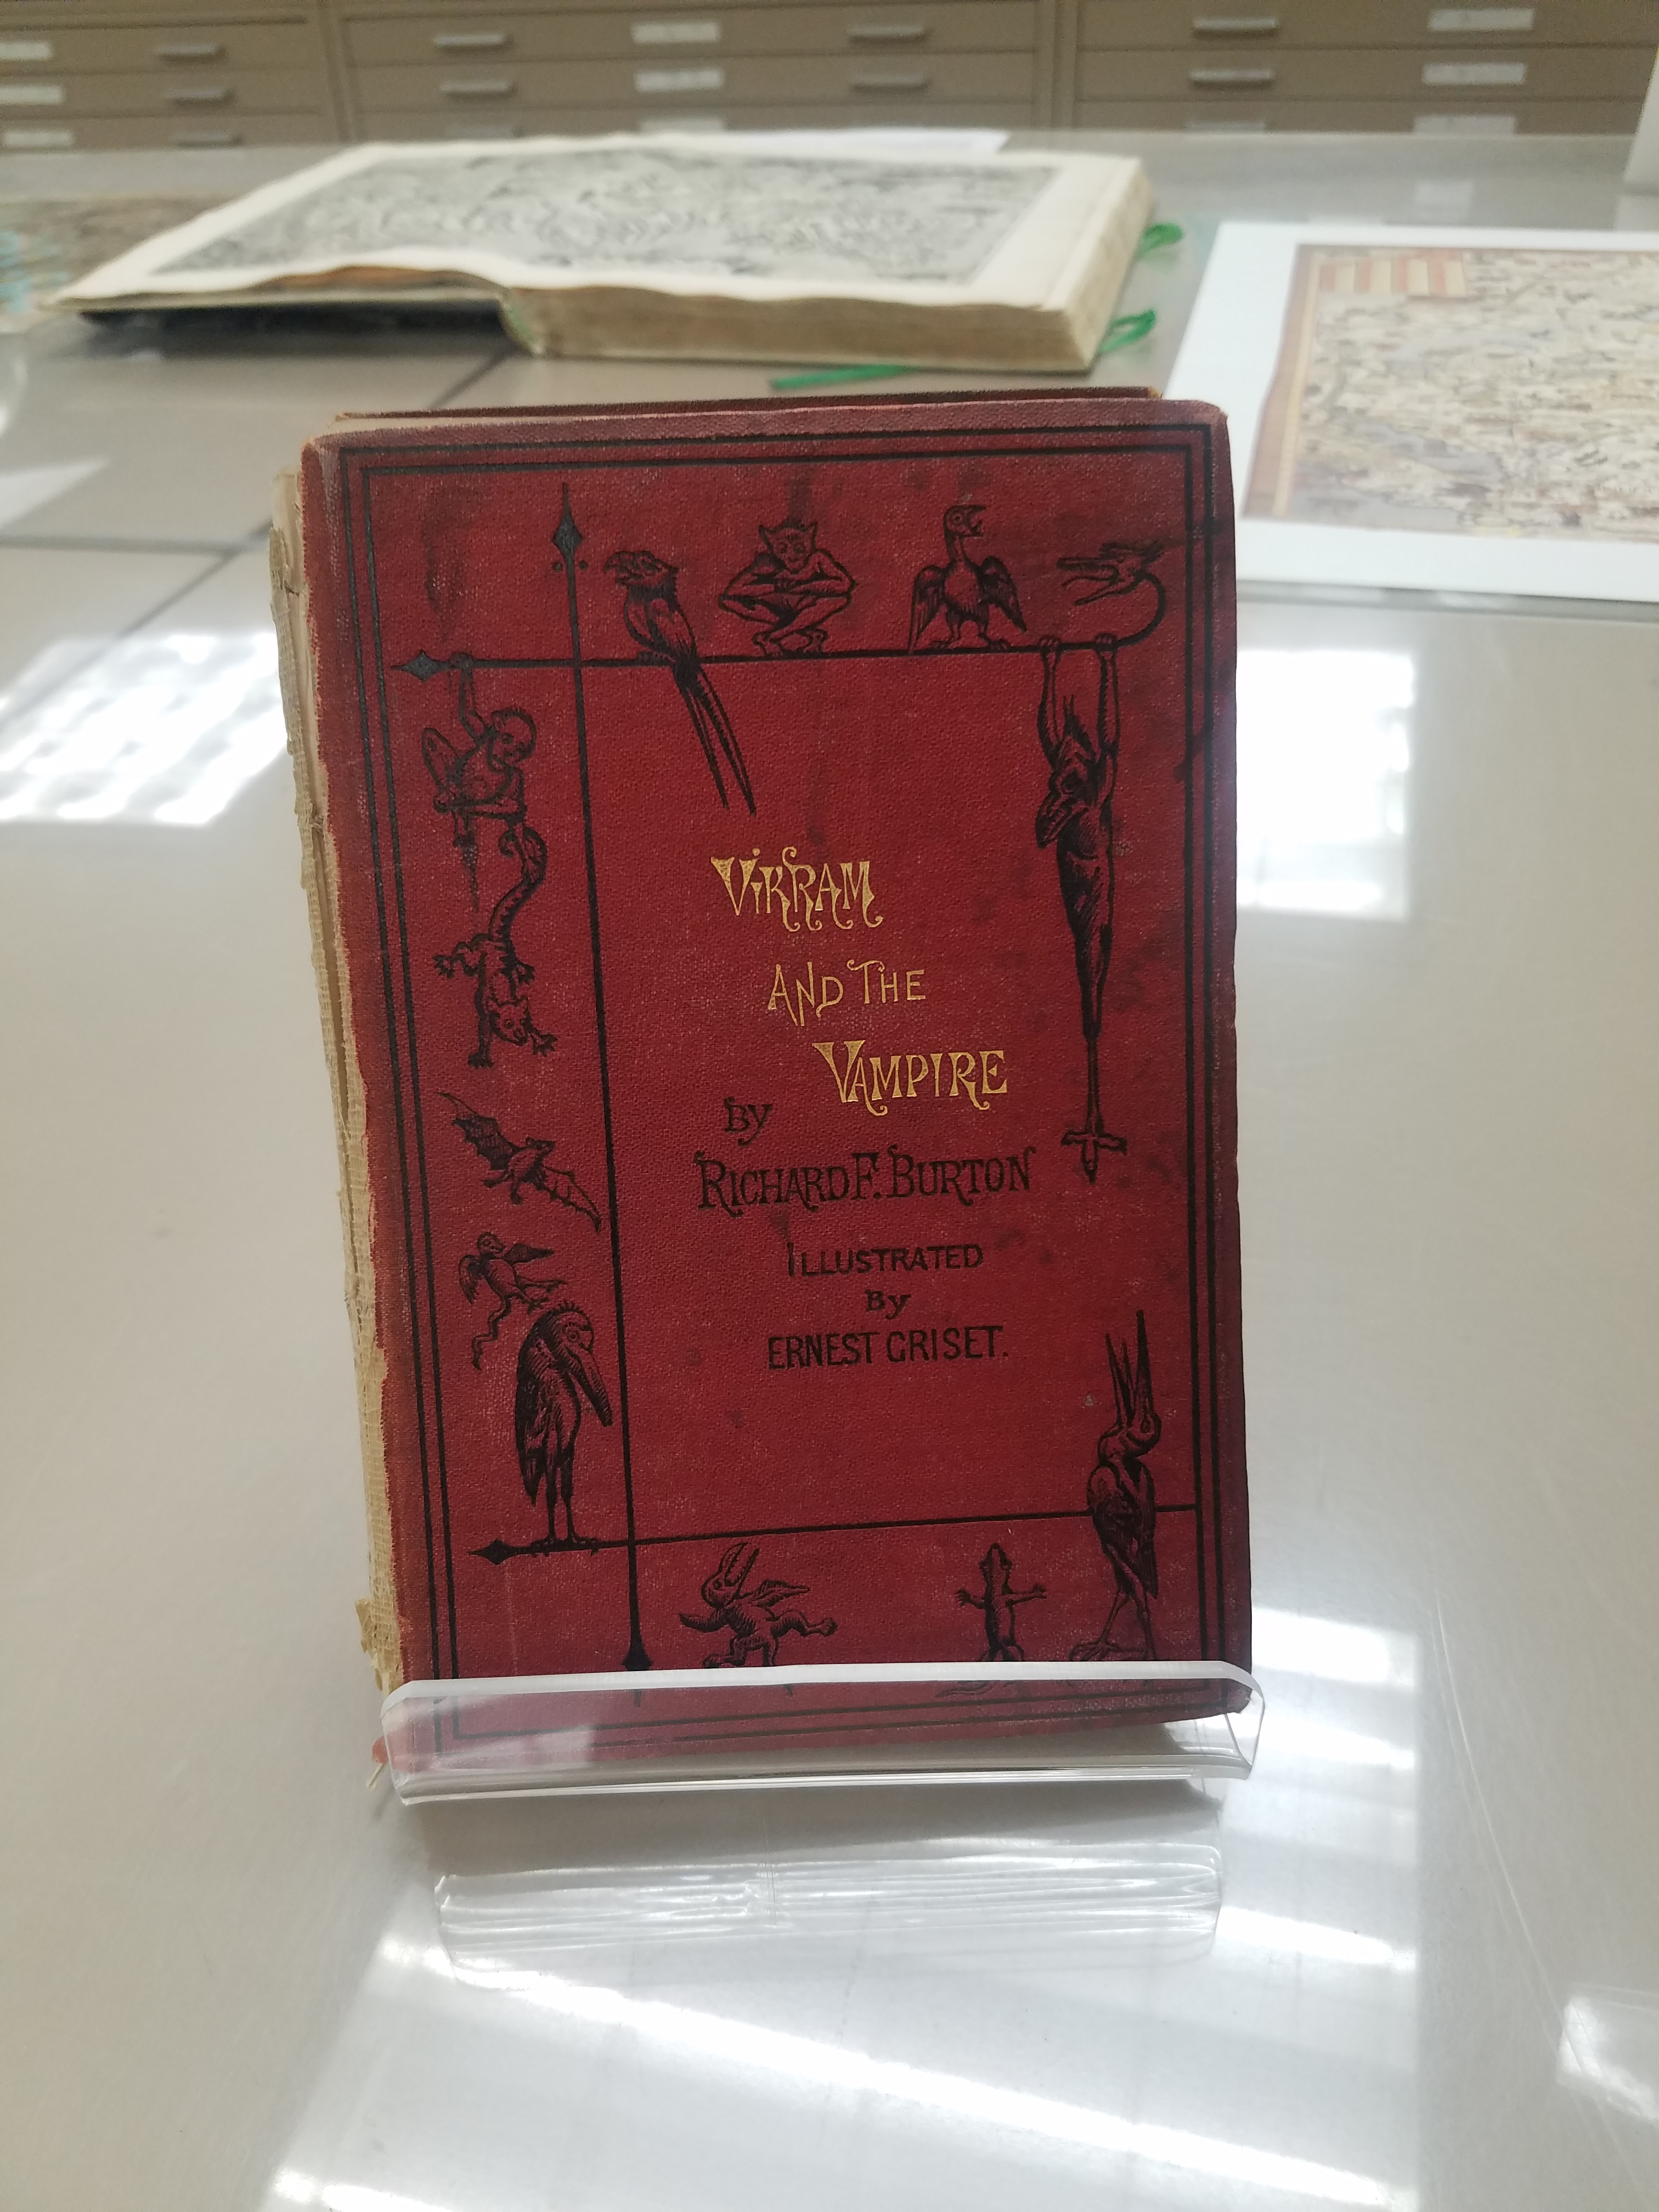
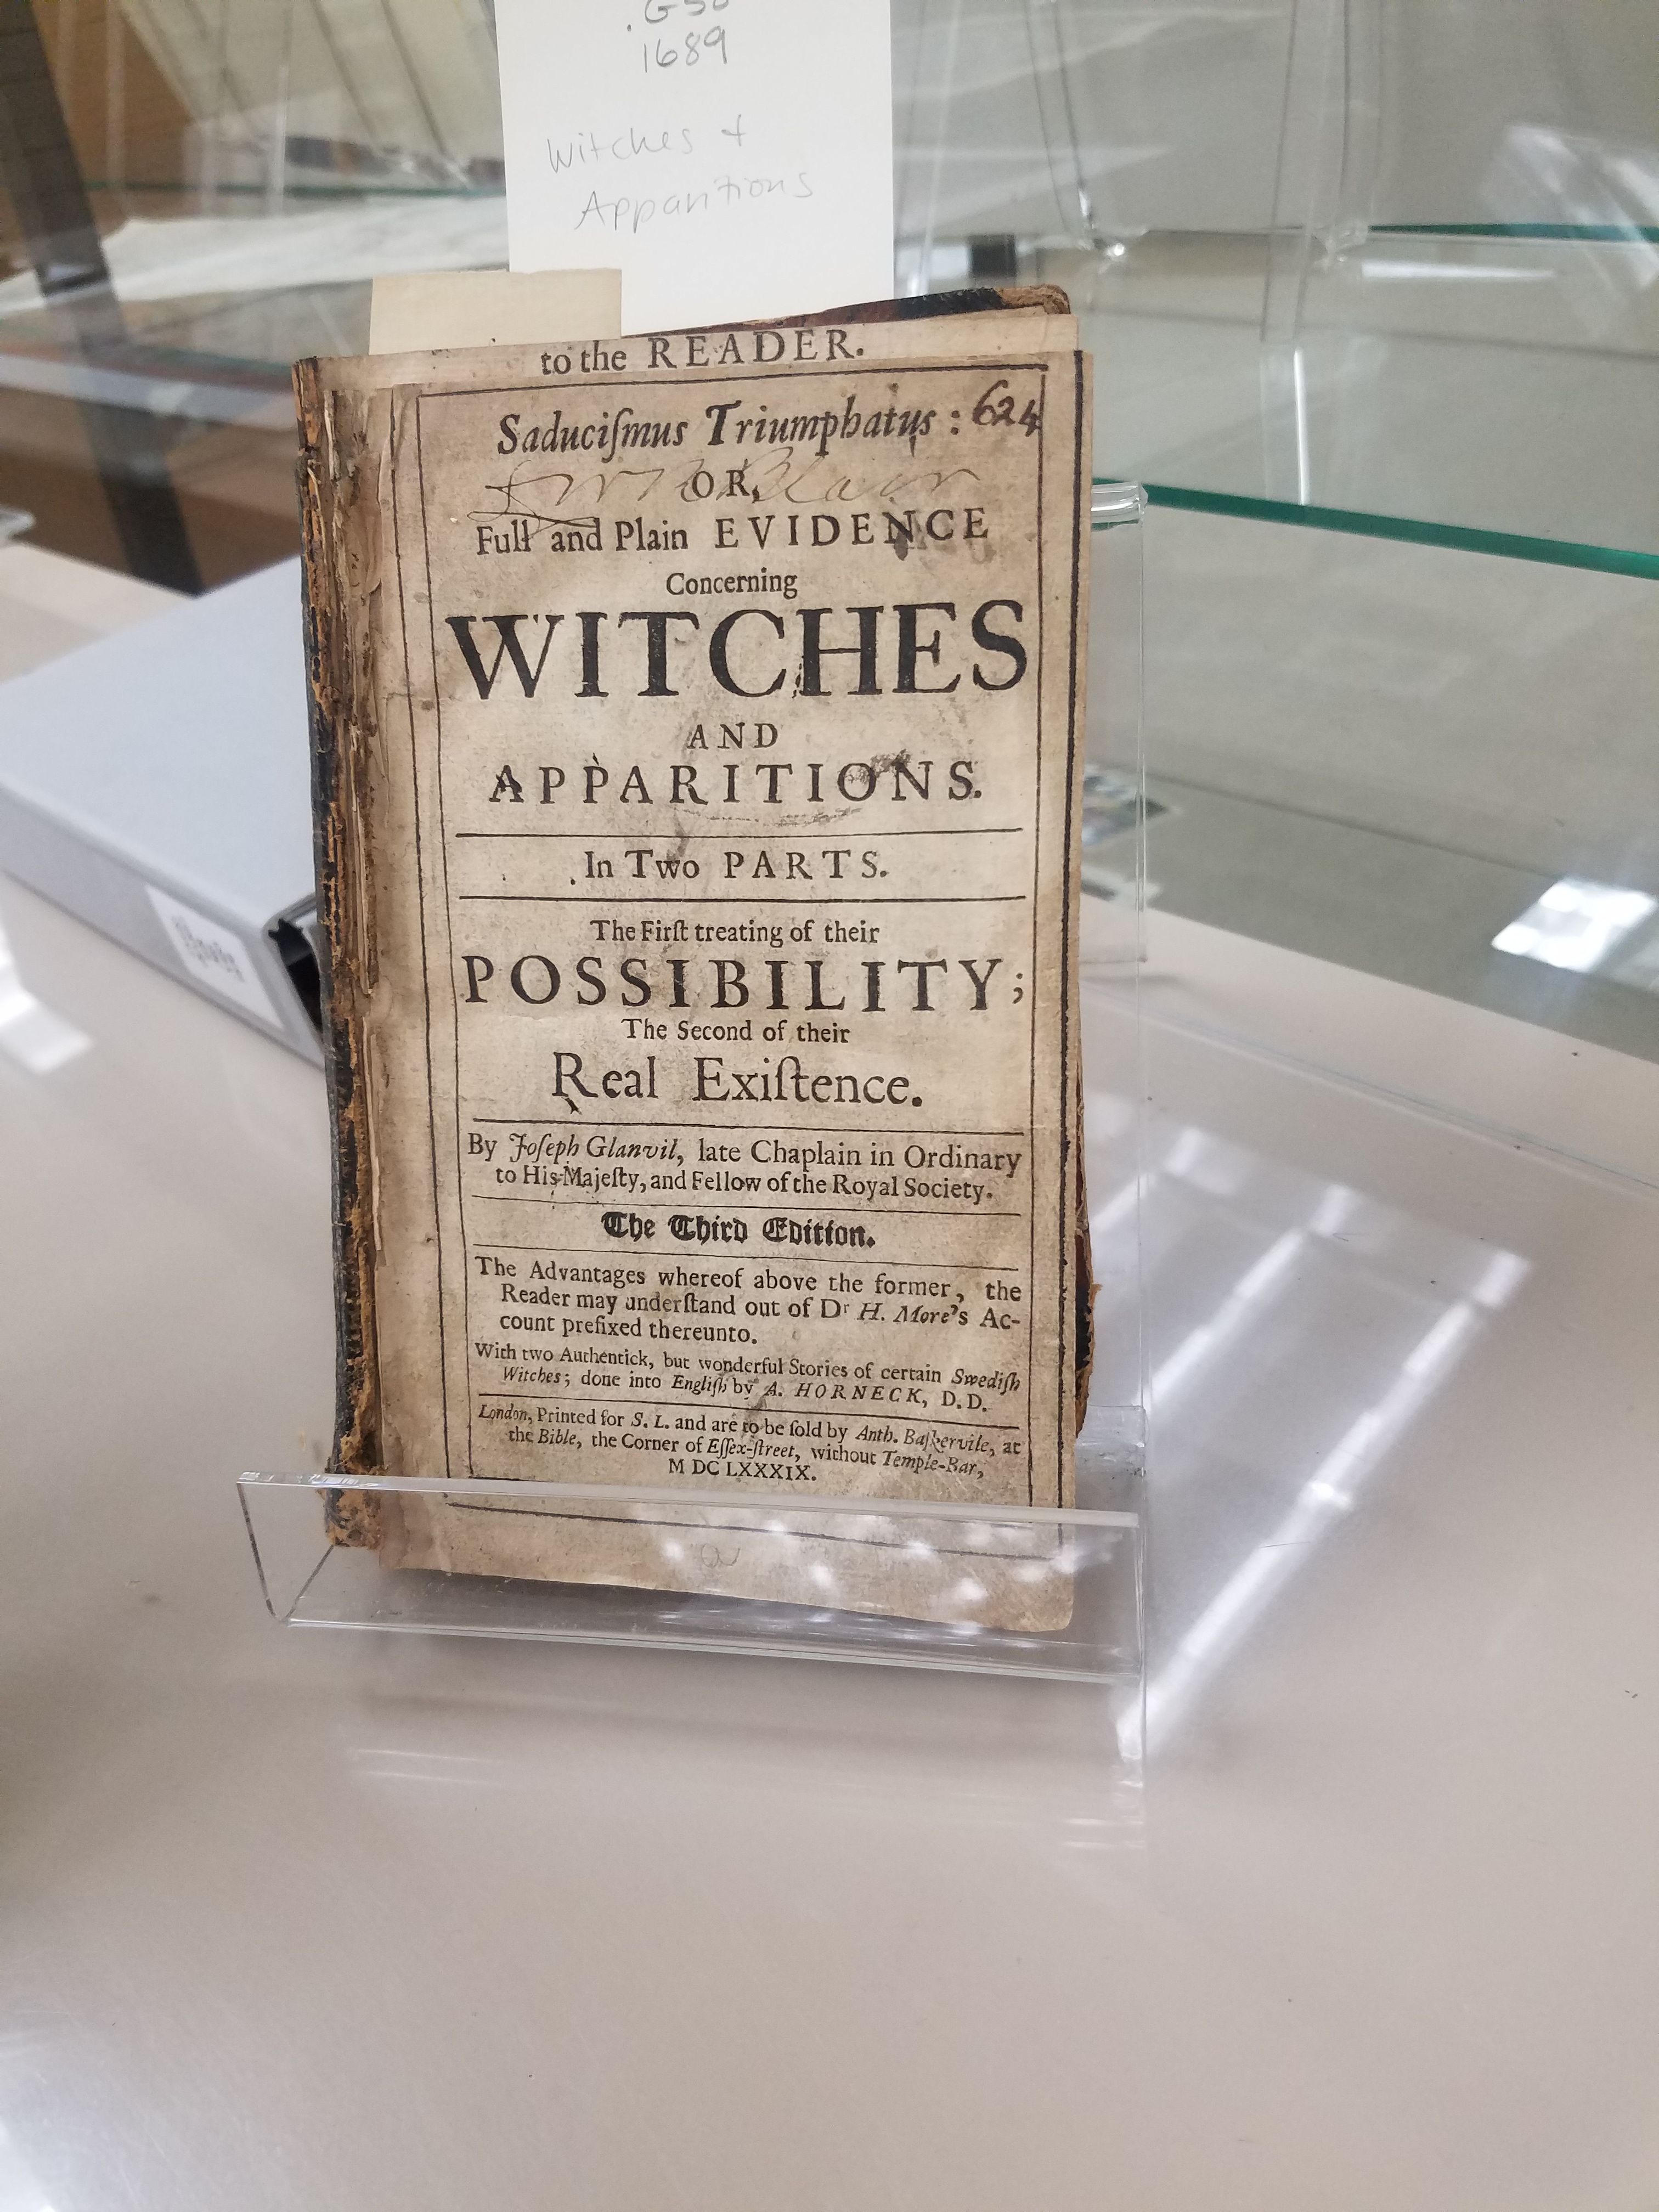
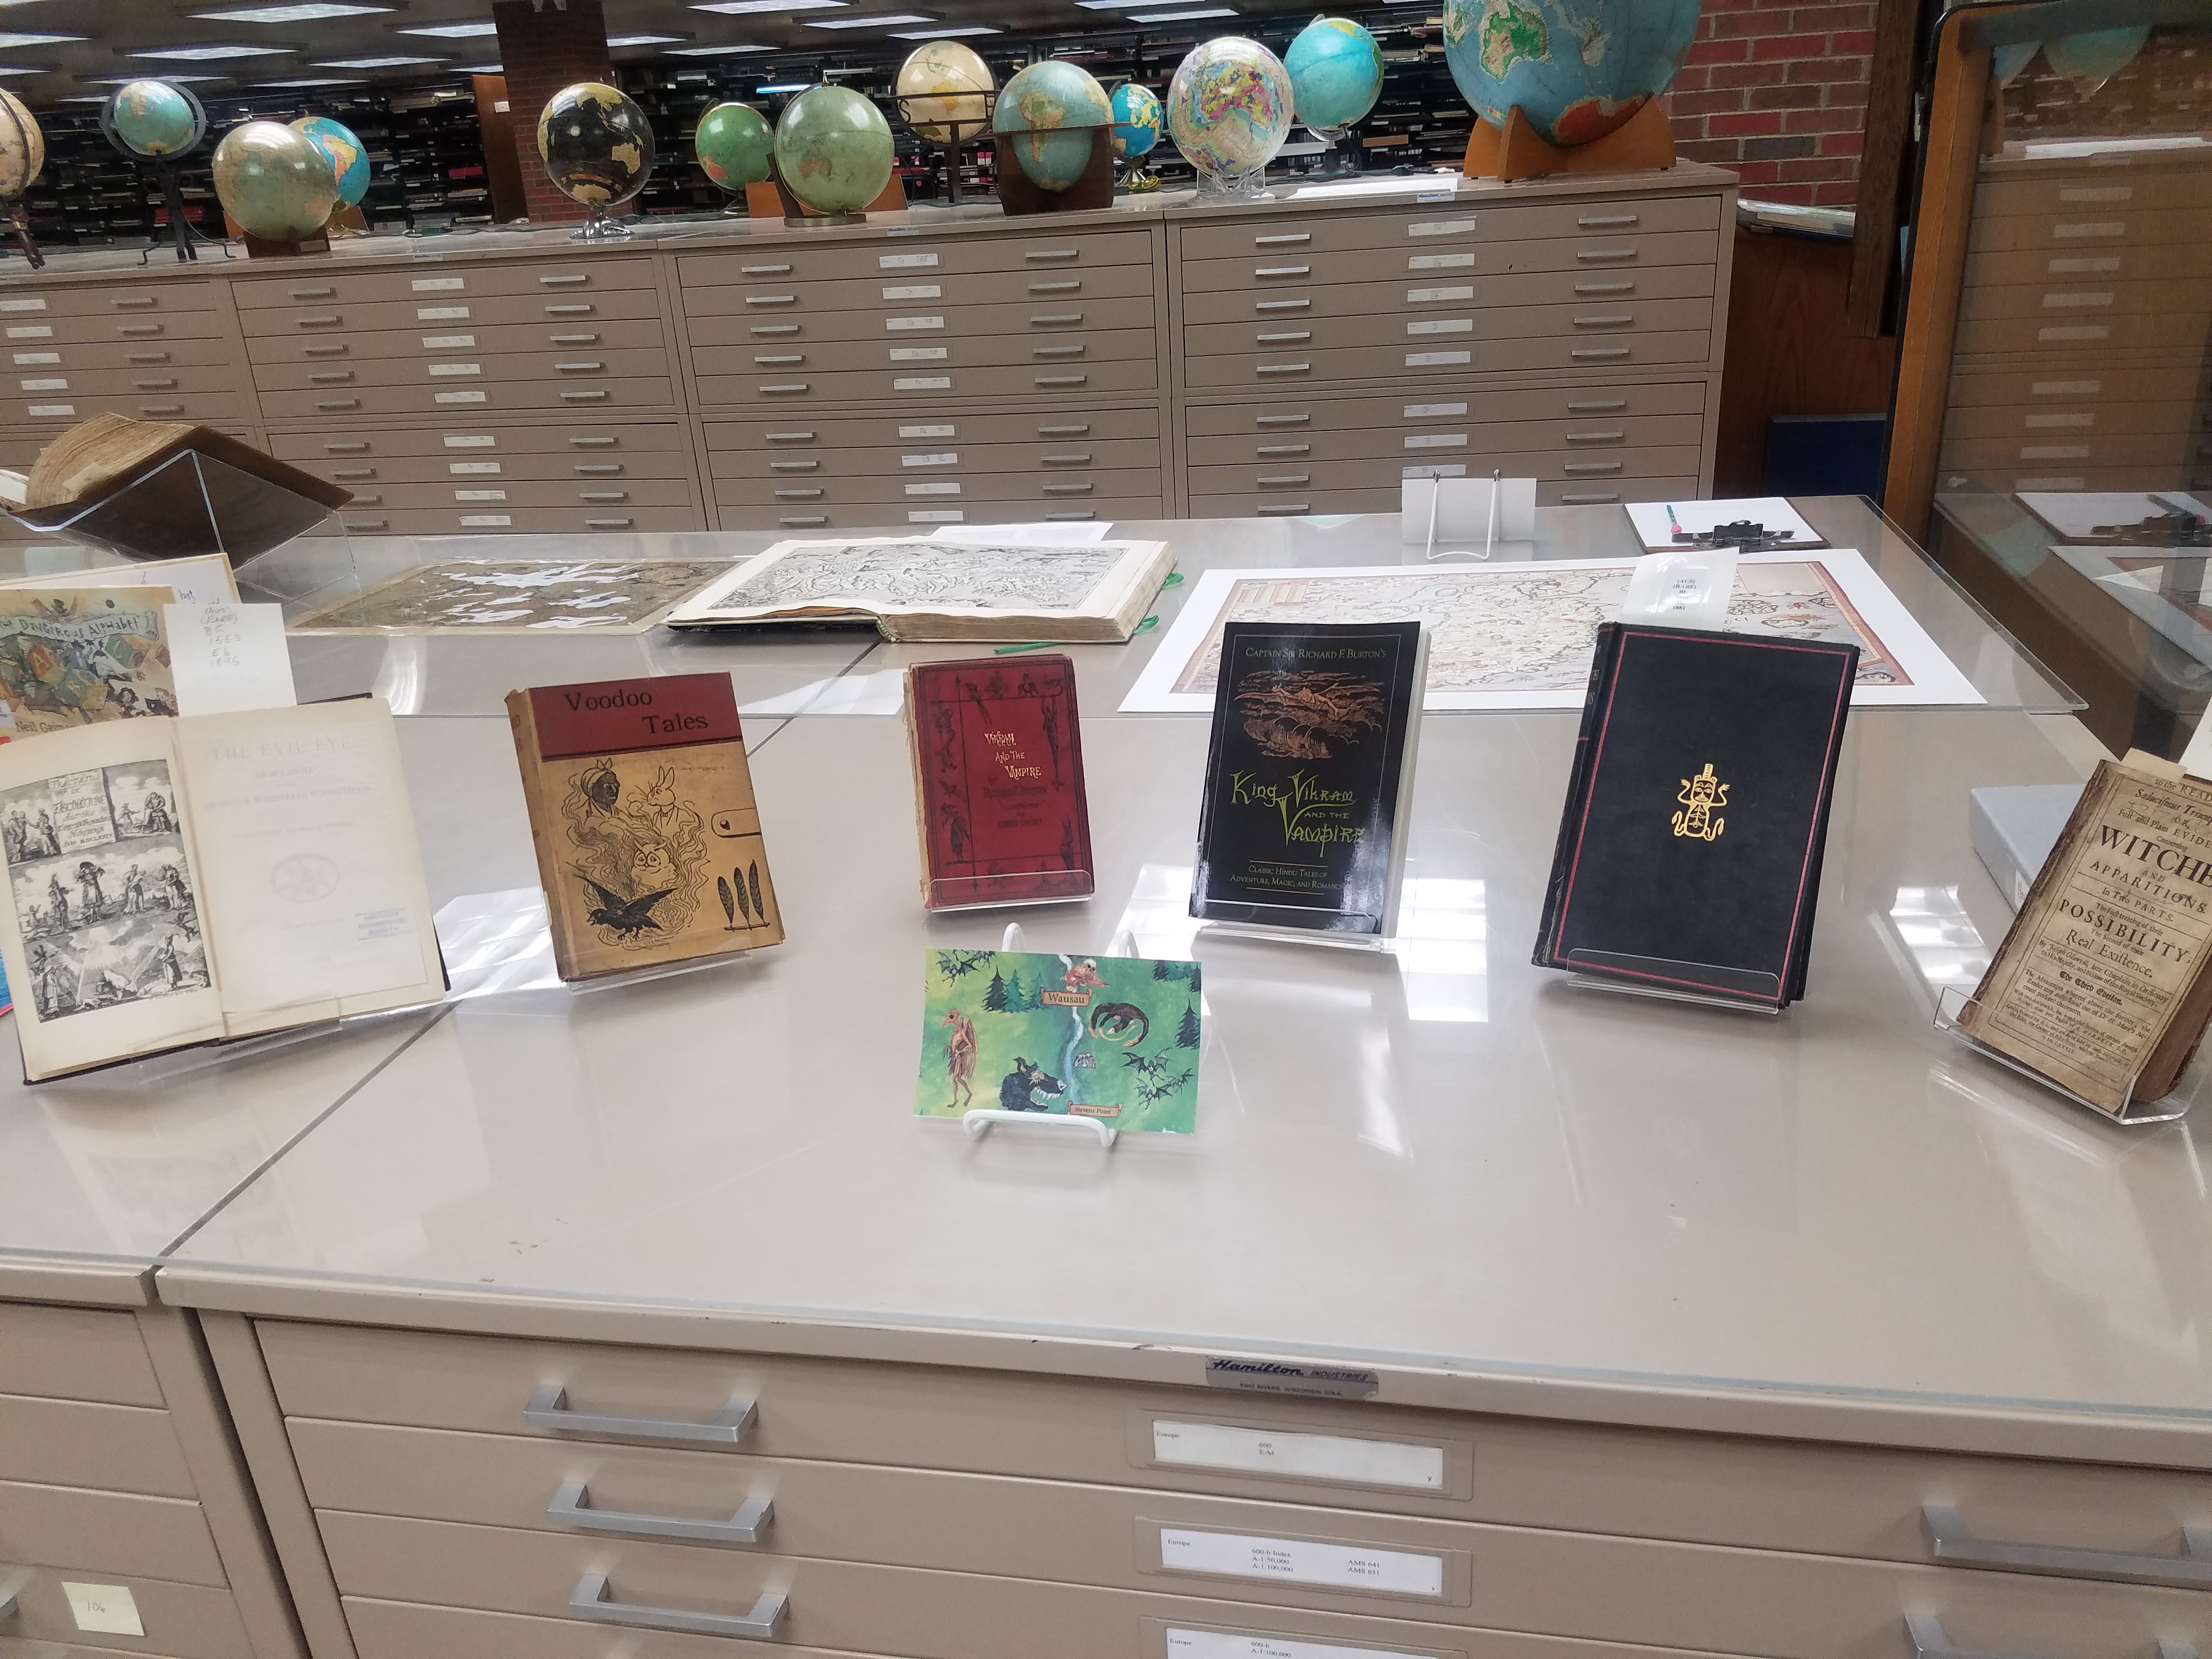
October Pop-up Exhibit
By Lauren Maddox
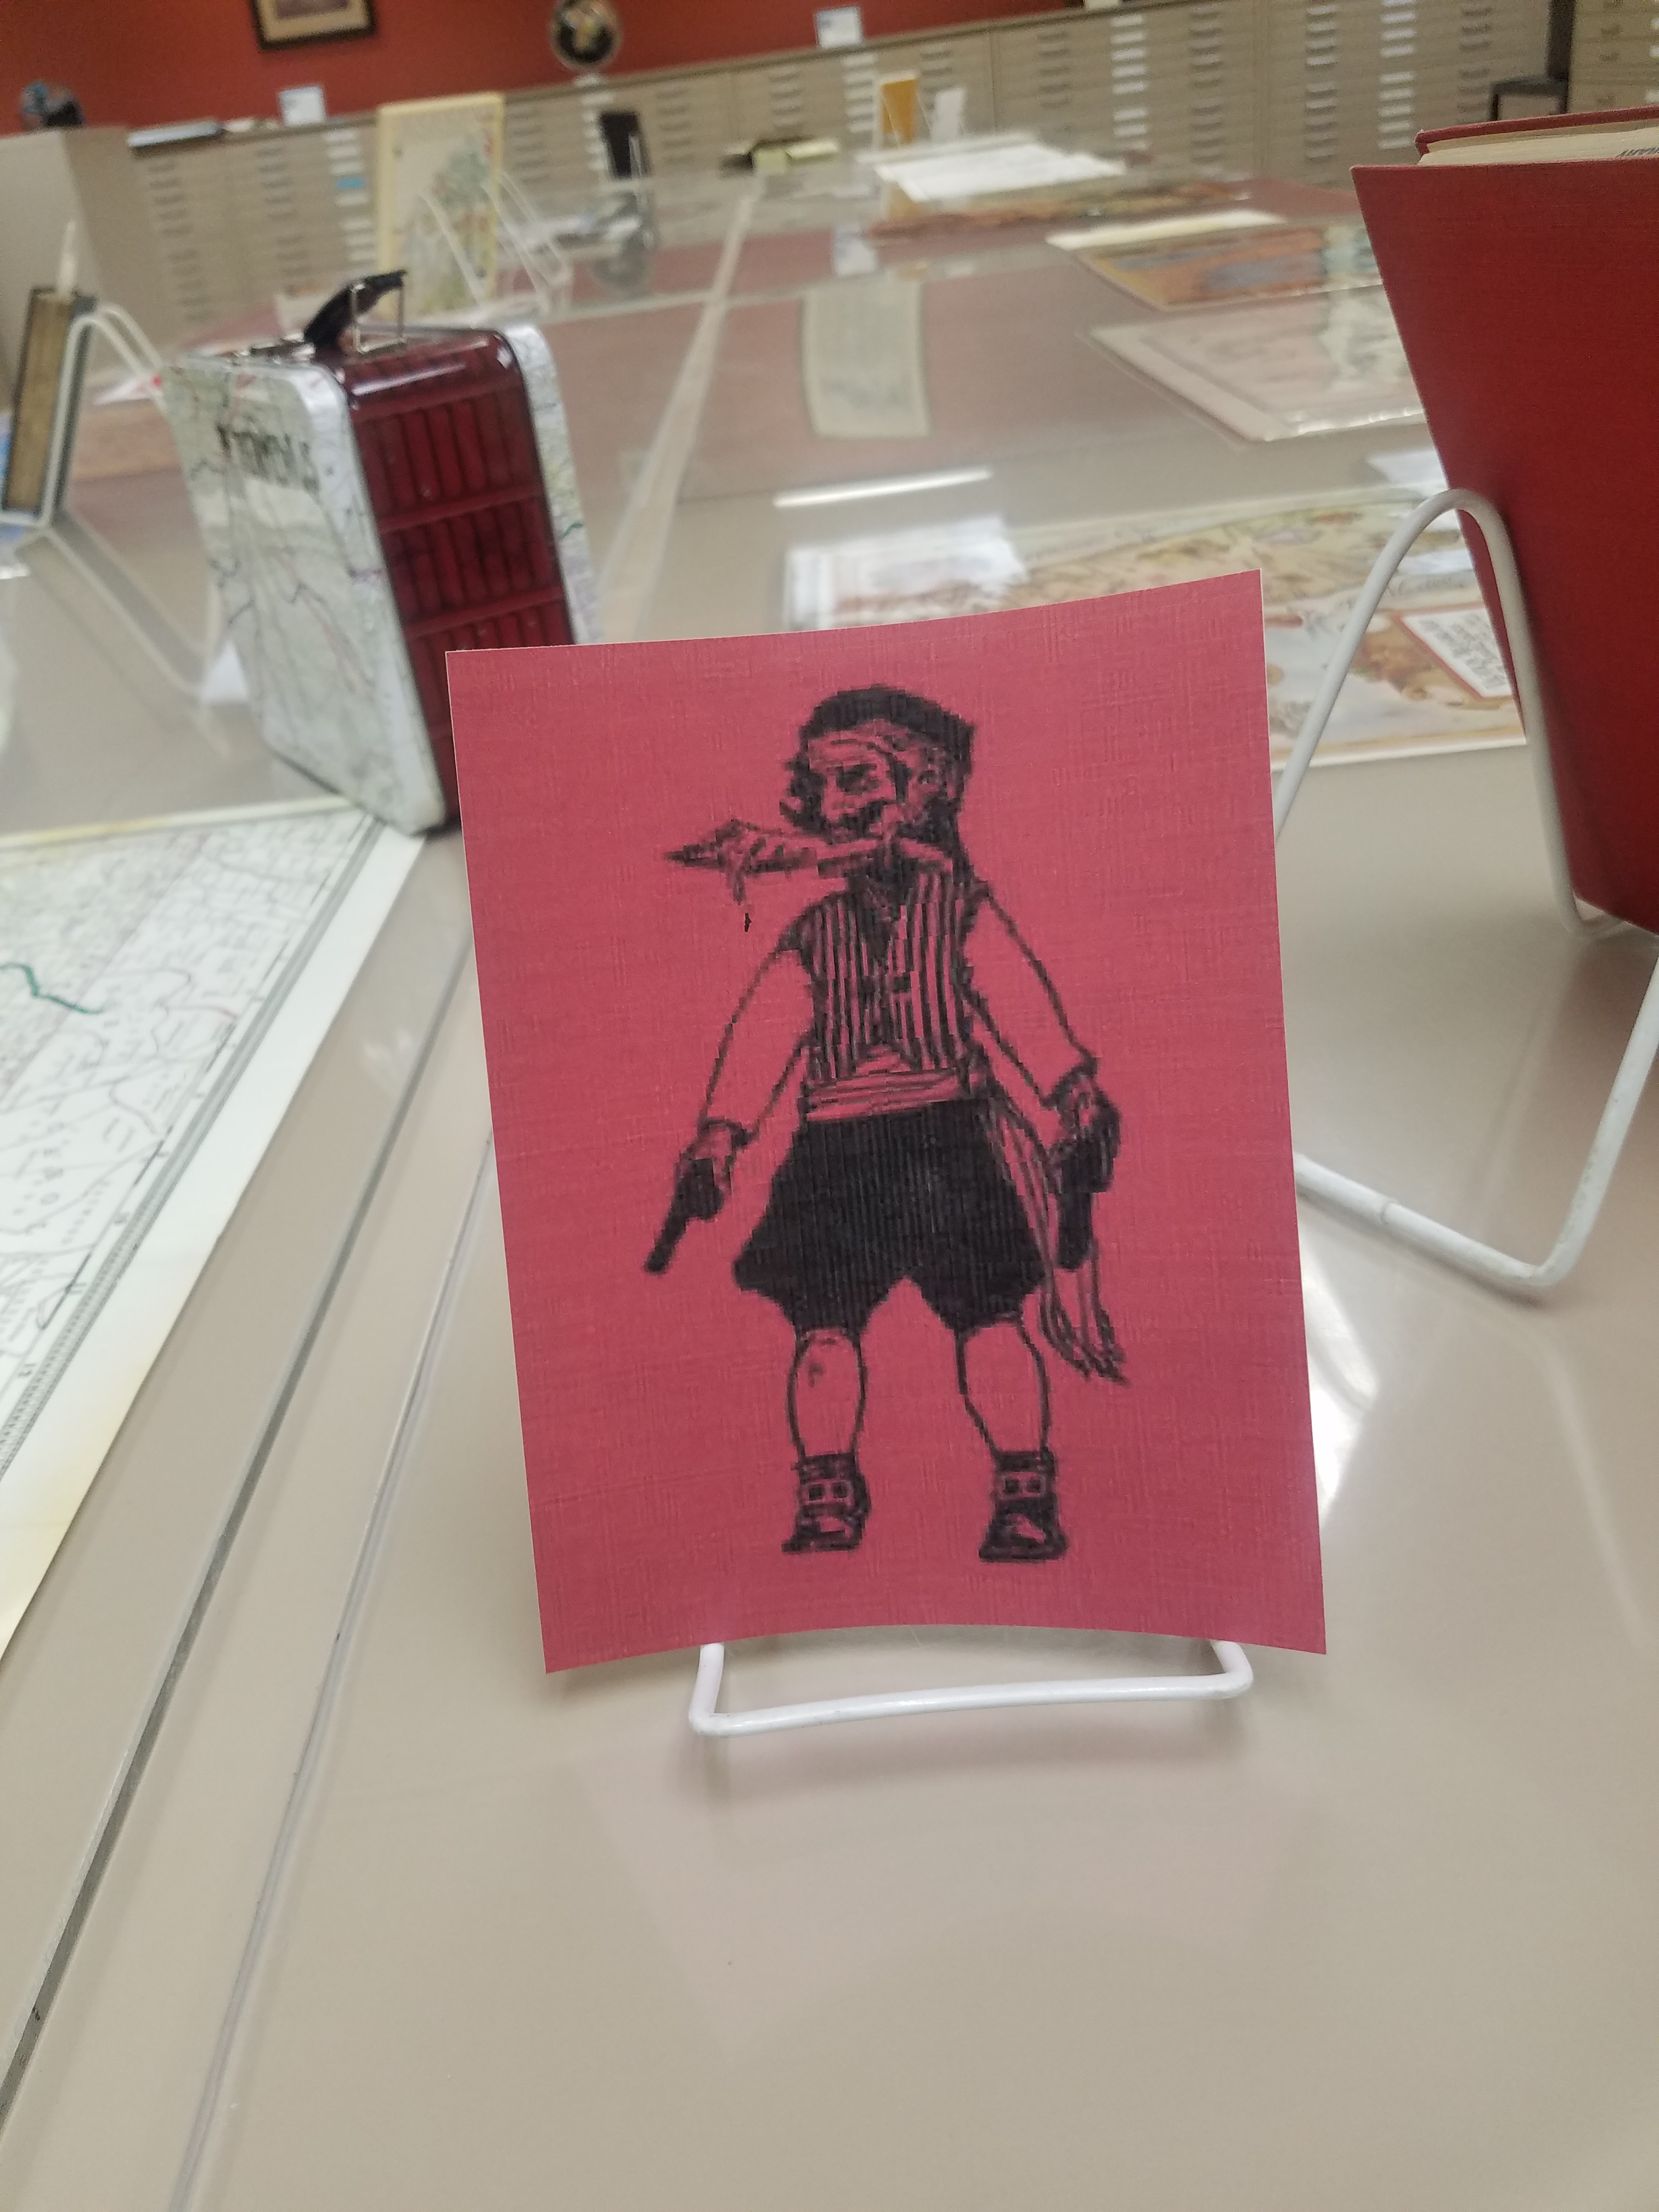
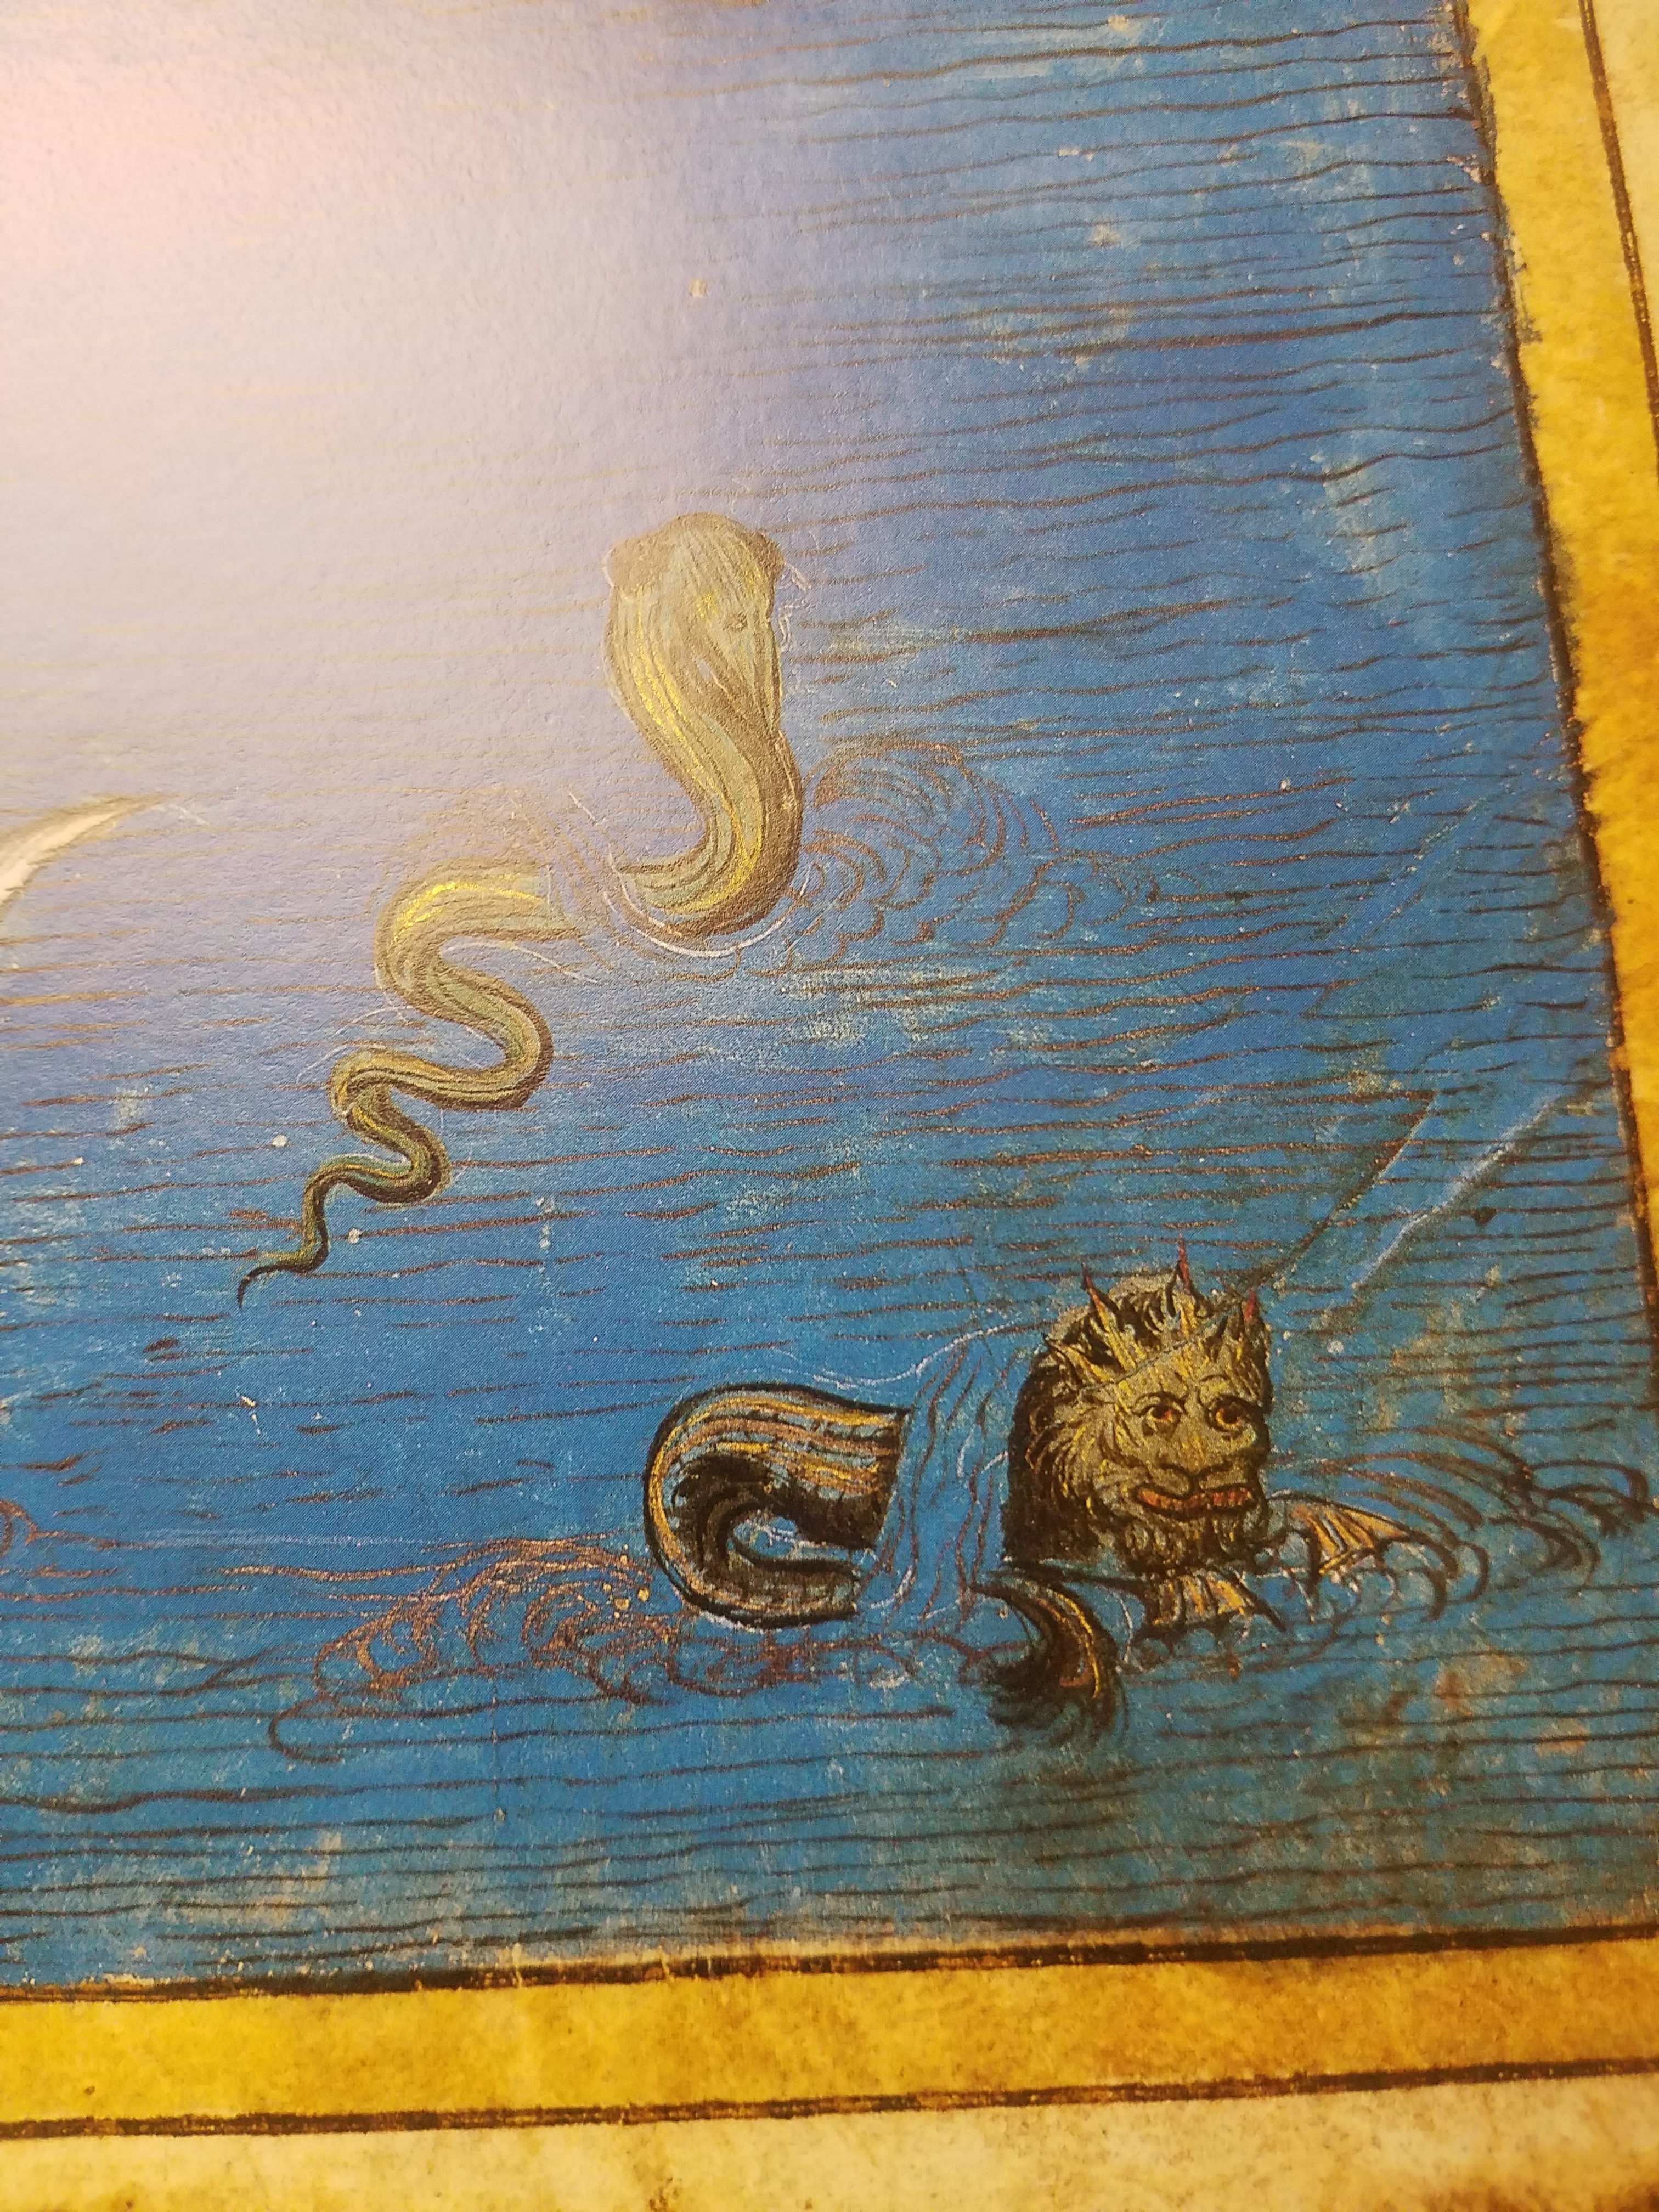
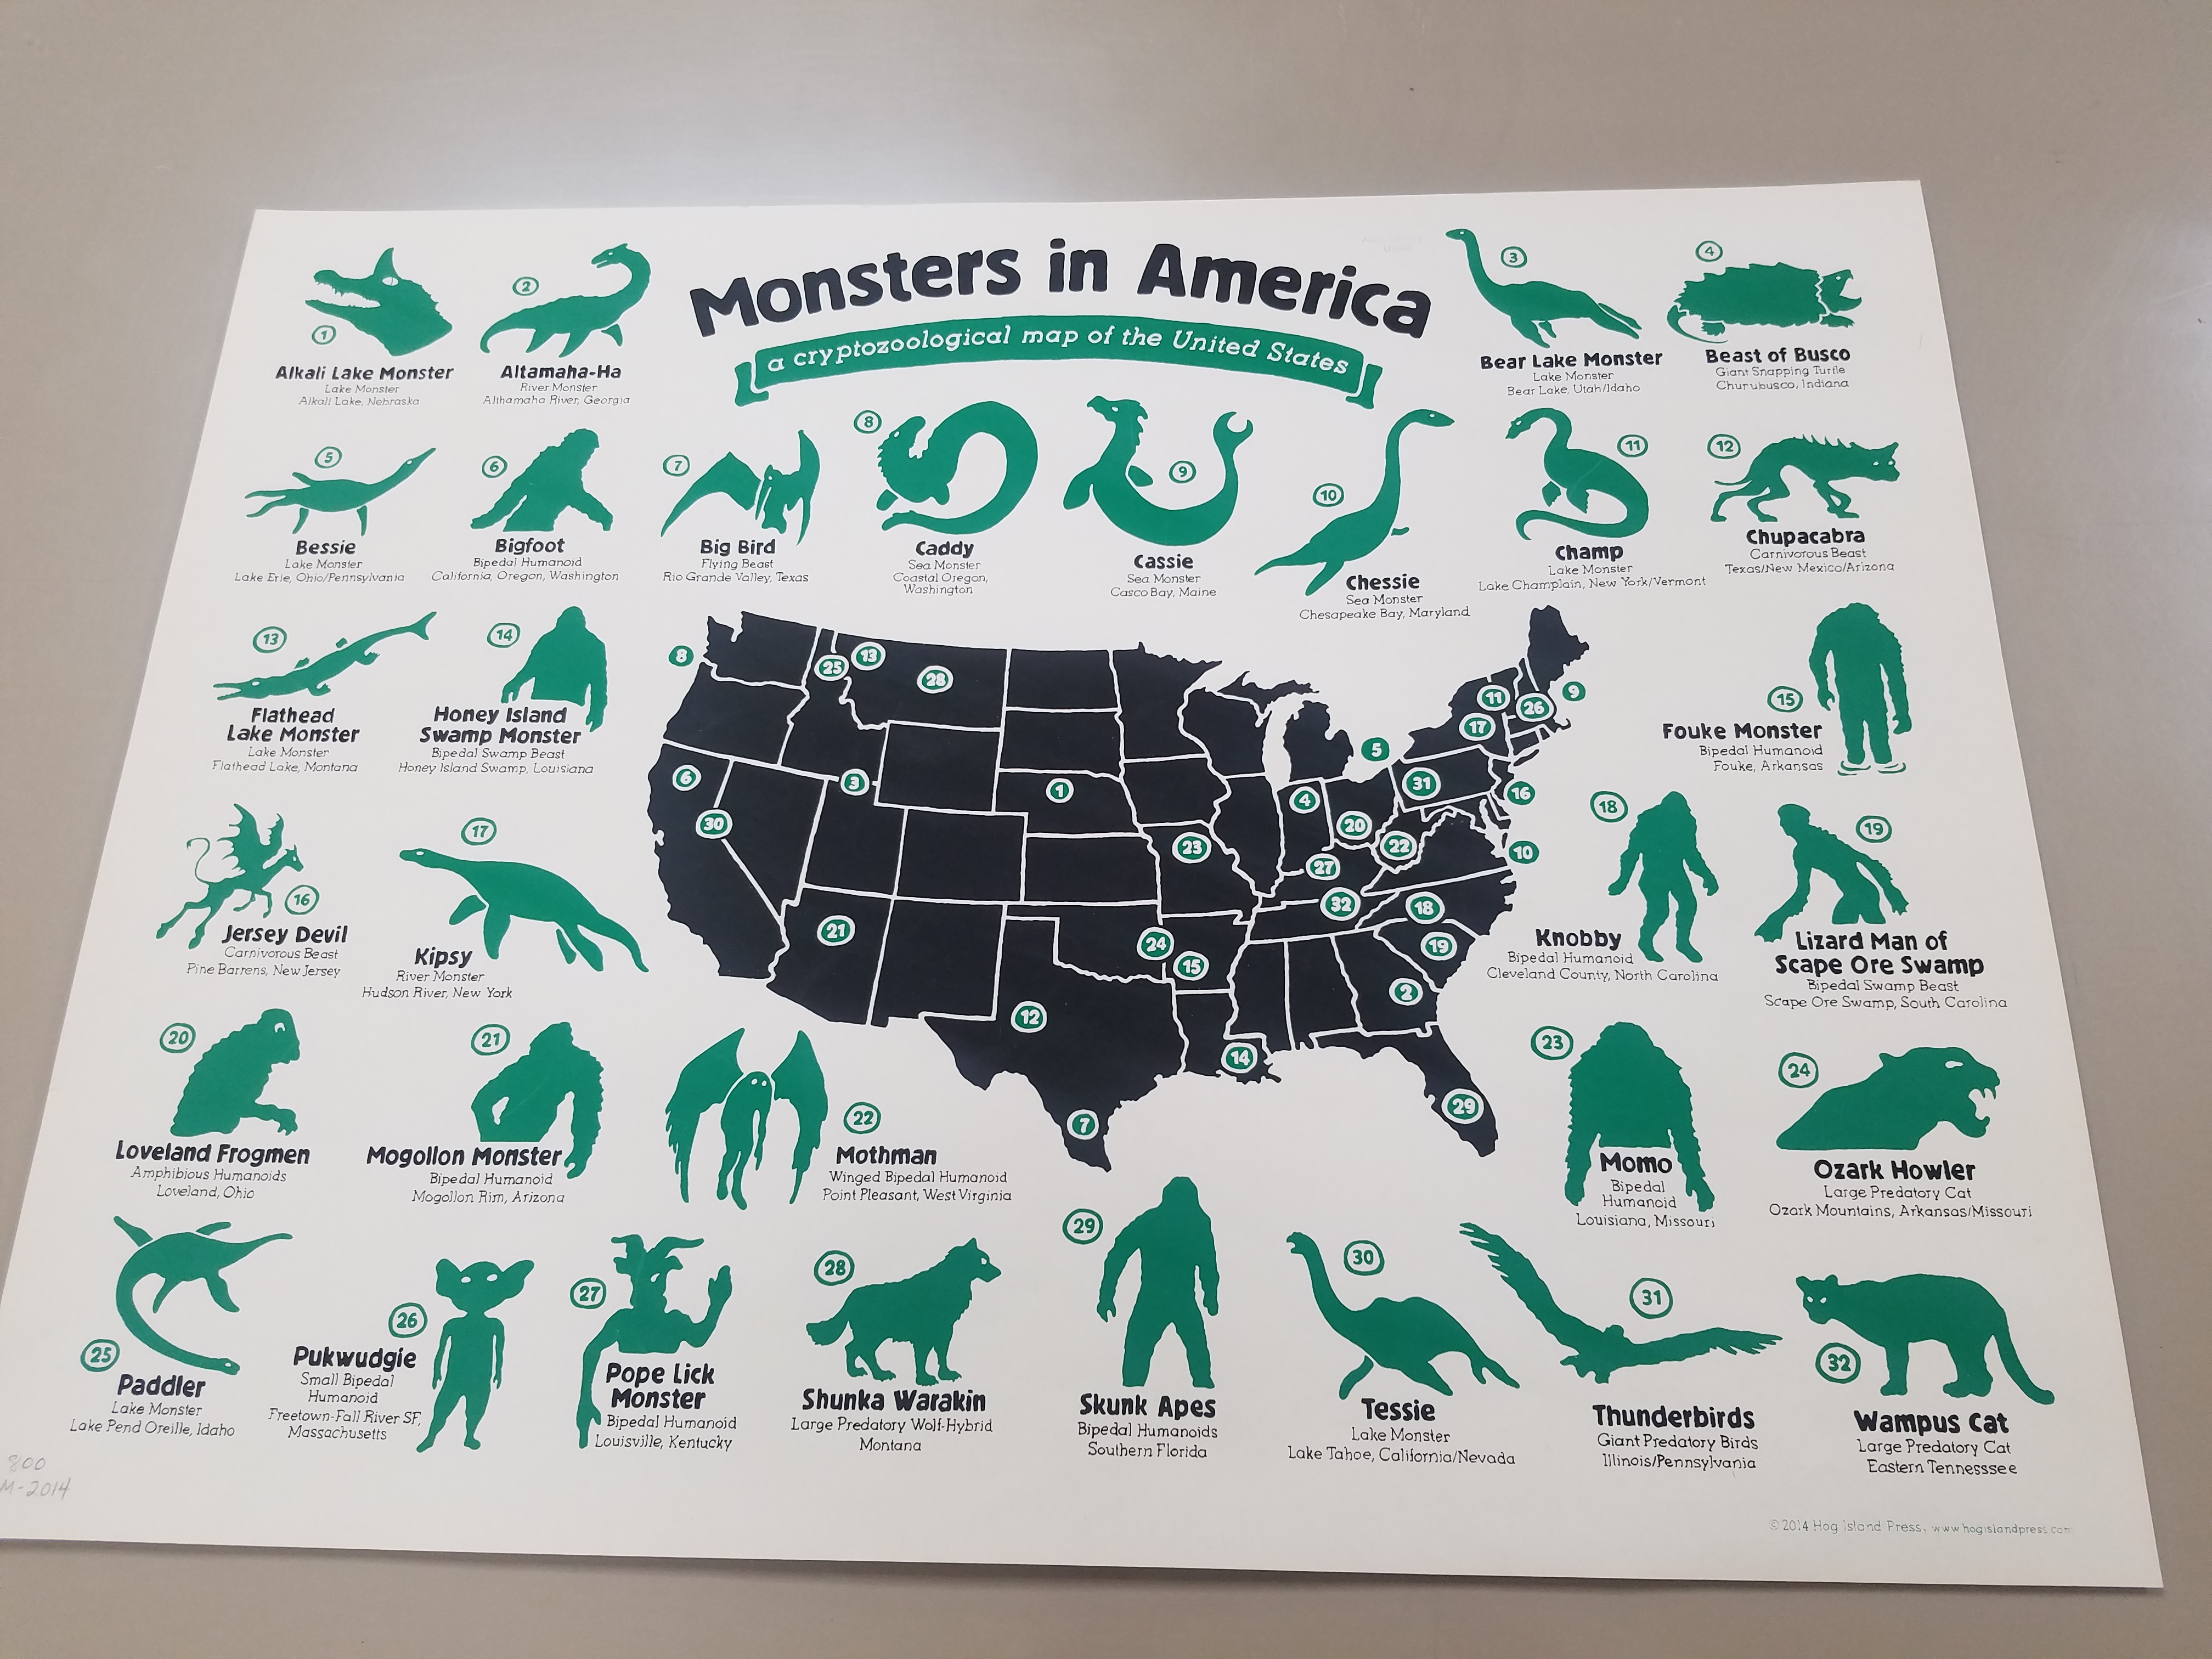
Happy Halloween! This month, the AGSL, UWM Archives, and Special Collections collaborated on another Pop-Up Exhibit! The official exhibit ran from October 23rd-25th and included specially curated pieces such as wood engravings of Mary Shelley’s Frankenstein by Barry Moser and many more spooky, scary artifacts! Well, you may have missed the full Pop-up Exhibit but don’t despair! There’s still time to see the hair-raising picks put out by the AGSL for the pop-up– our exhibition materials will stay on display until after Halloween! Peruse our collection; you may find sea monsters, witches, and haunted cemeteries– and if that doesn’t scare you, stay tuned for next week’s post which will feature some of the most spine-chilling, blood-curdling maps from this month’s Pop-Up!

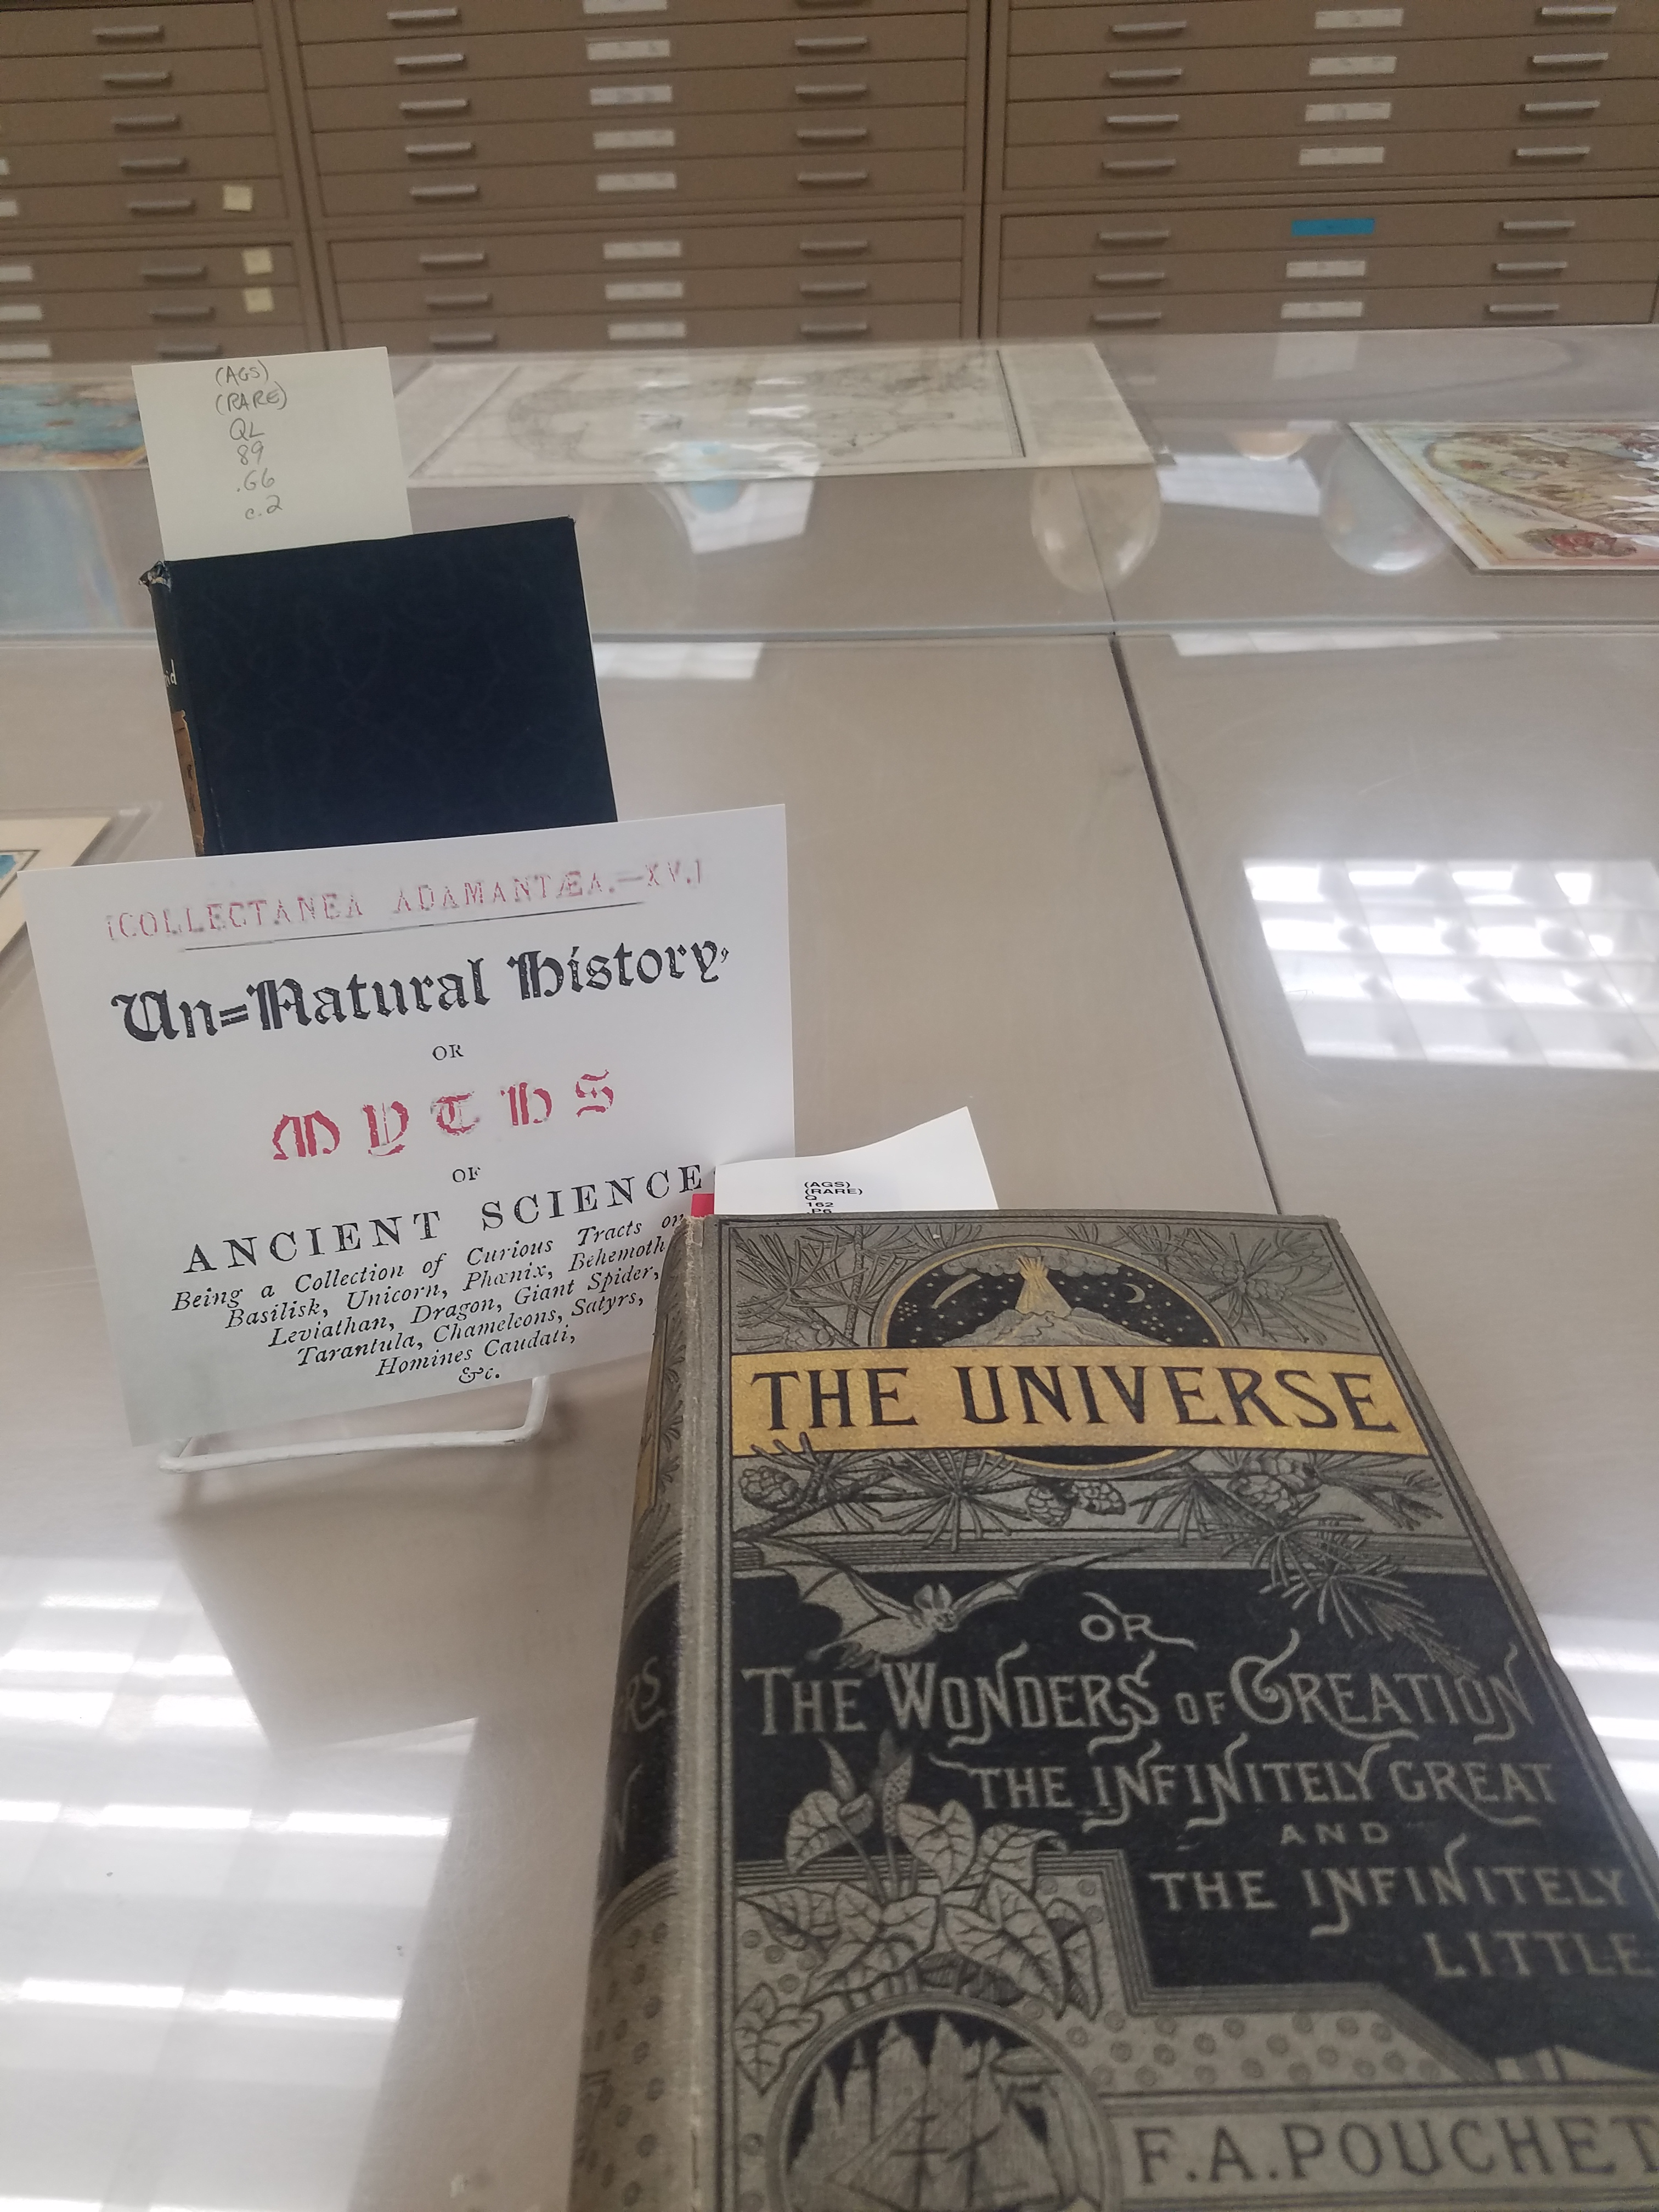
The AGSL is open to the public Monday through Friday, 8 a.m. to 4:30 p.m. Come see us and the Halloween Pop-up Exhibit while you still can!
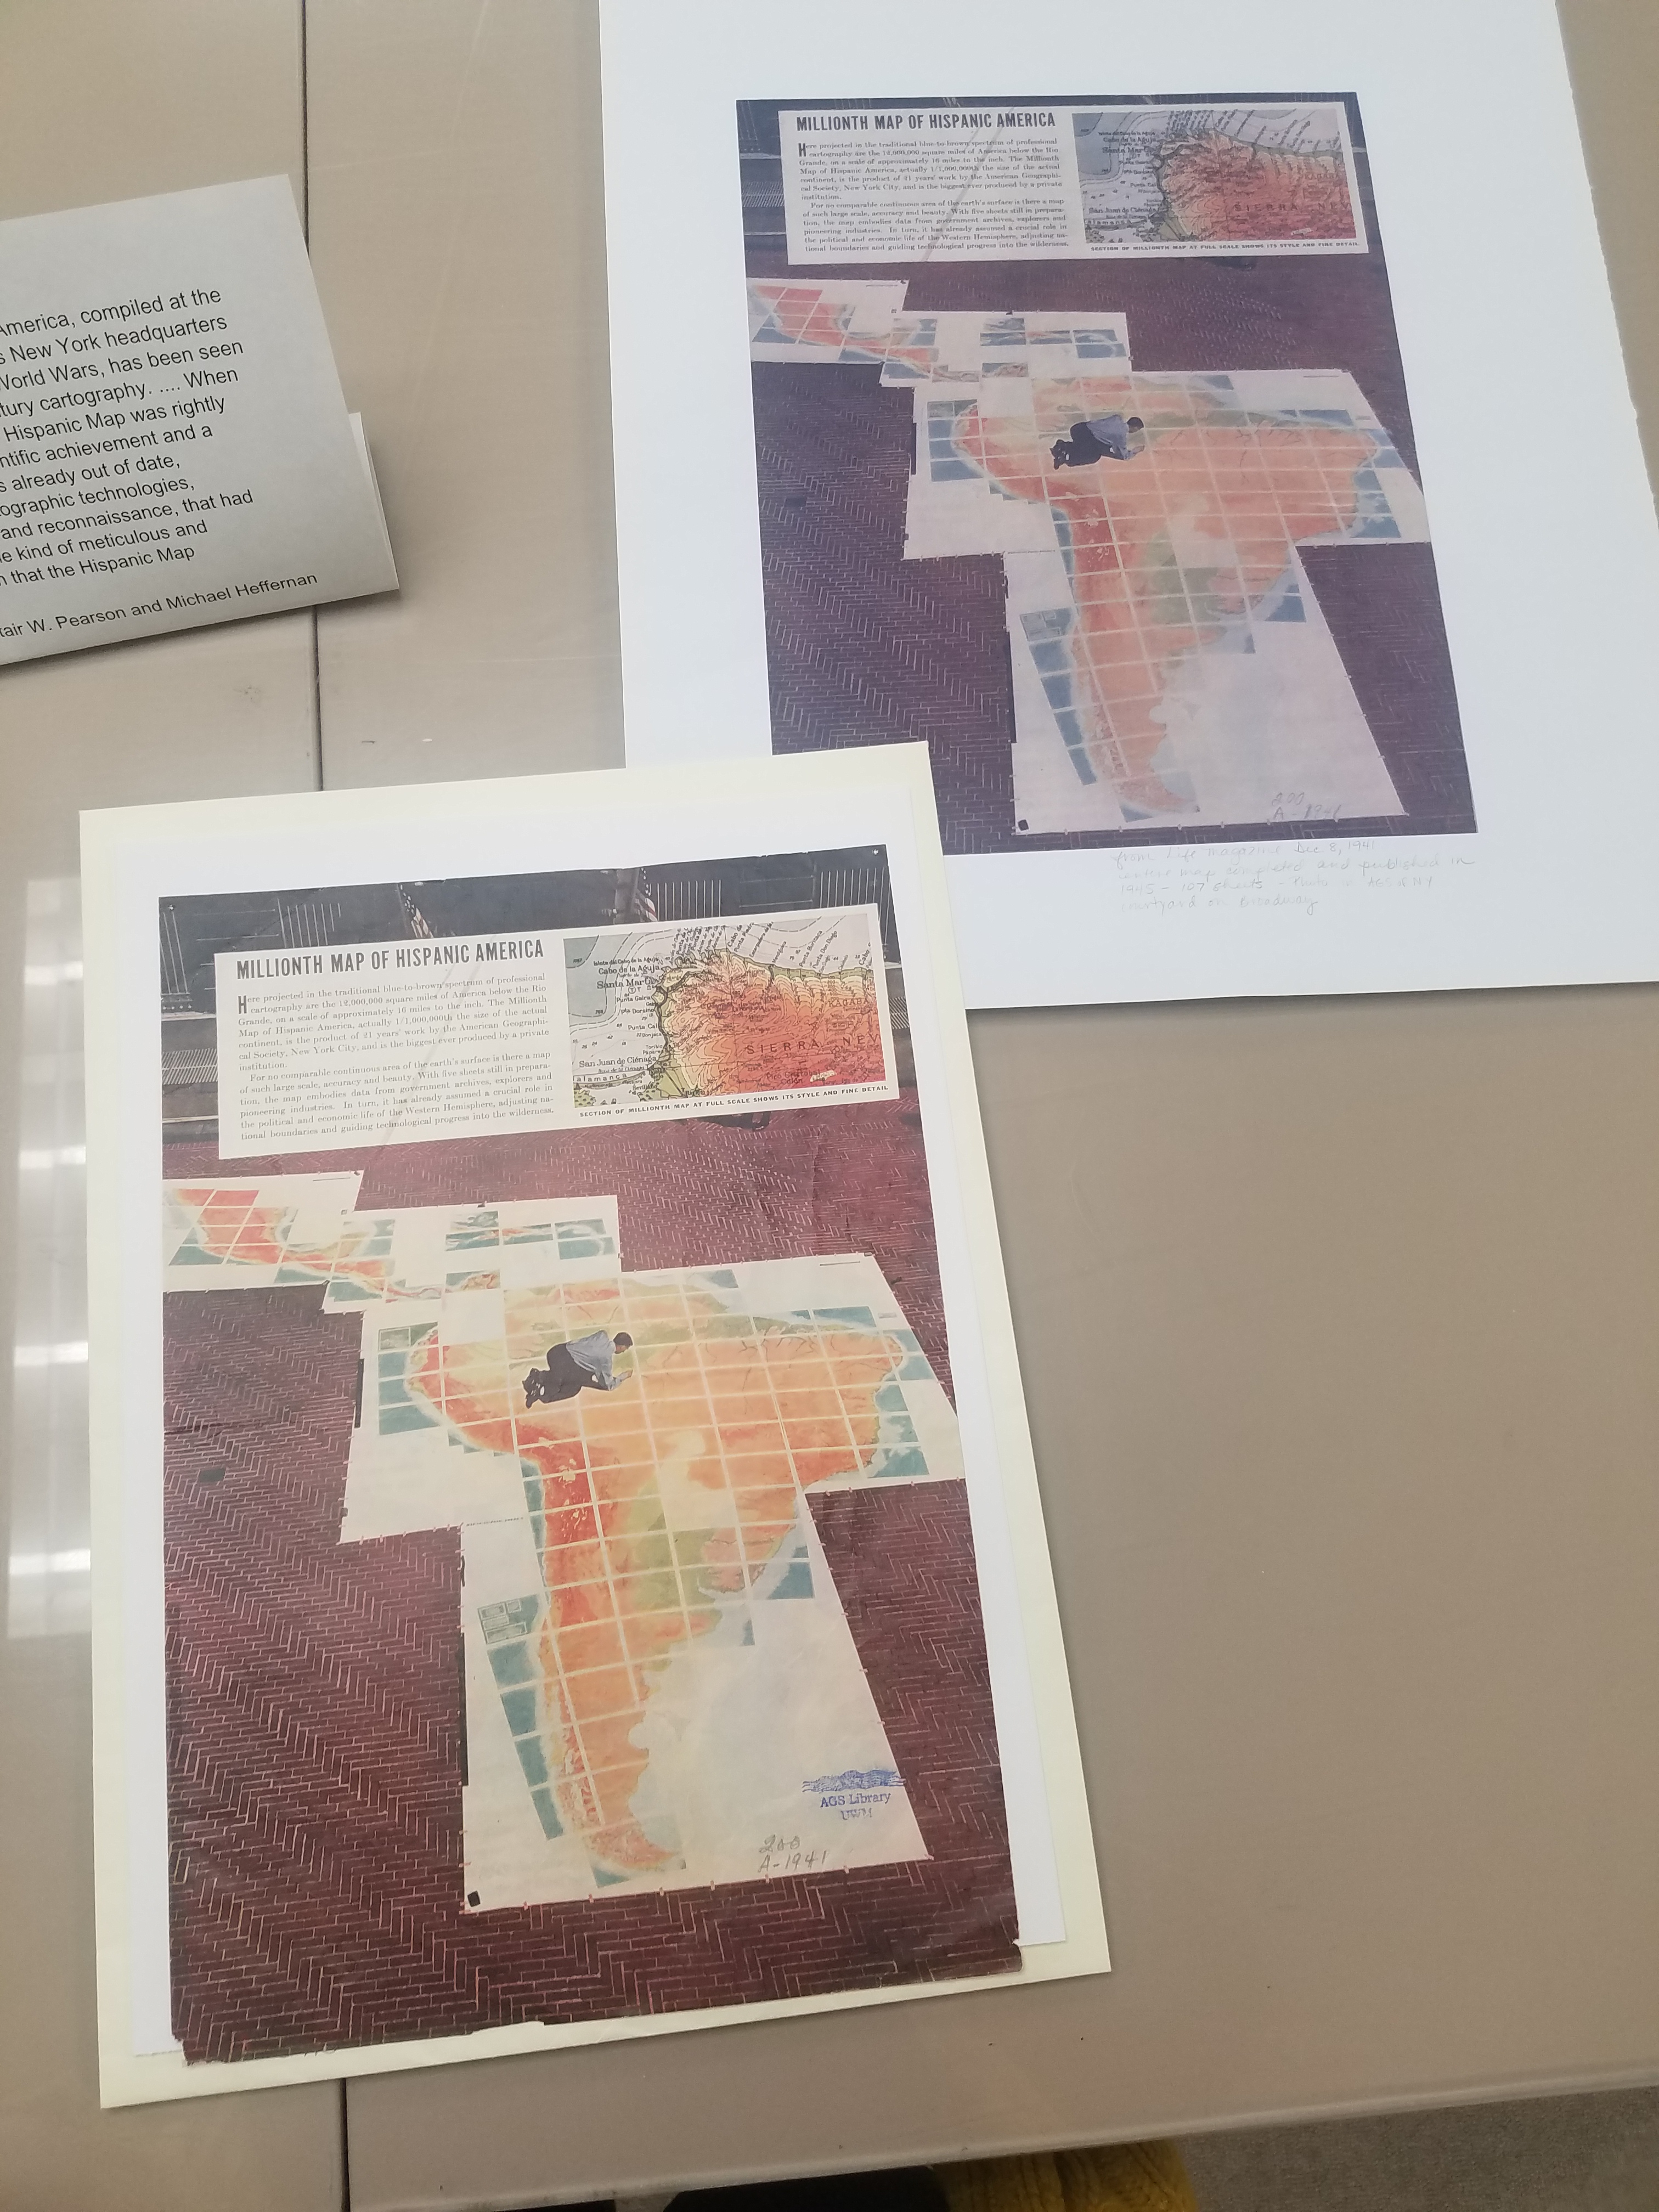
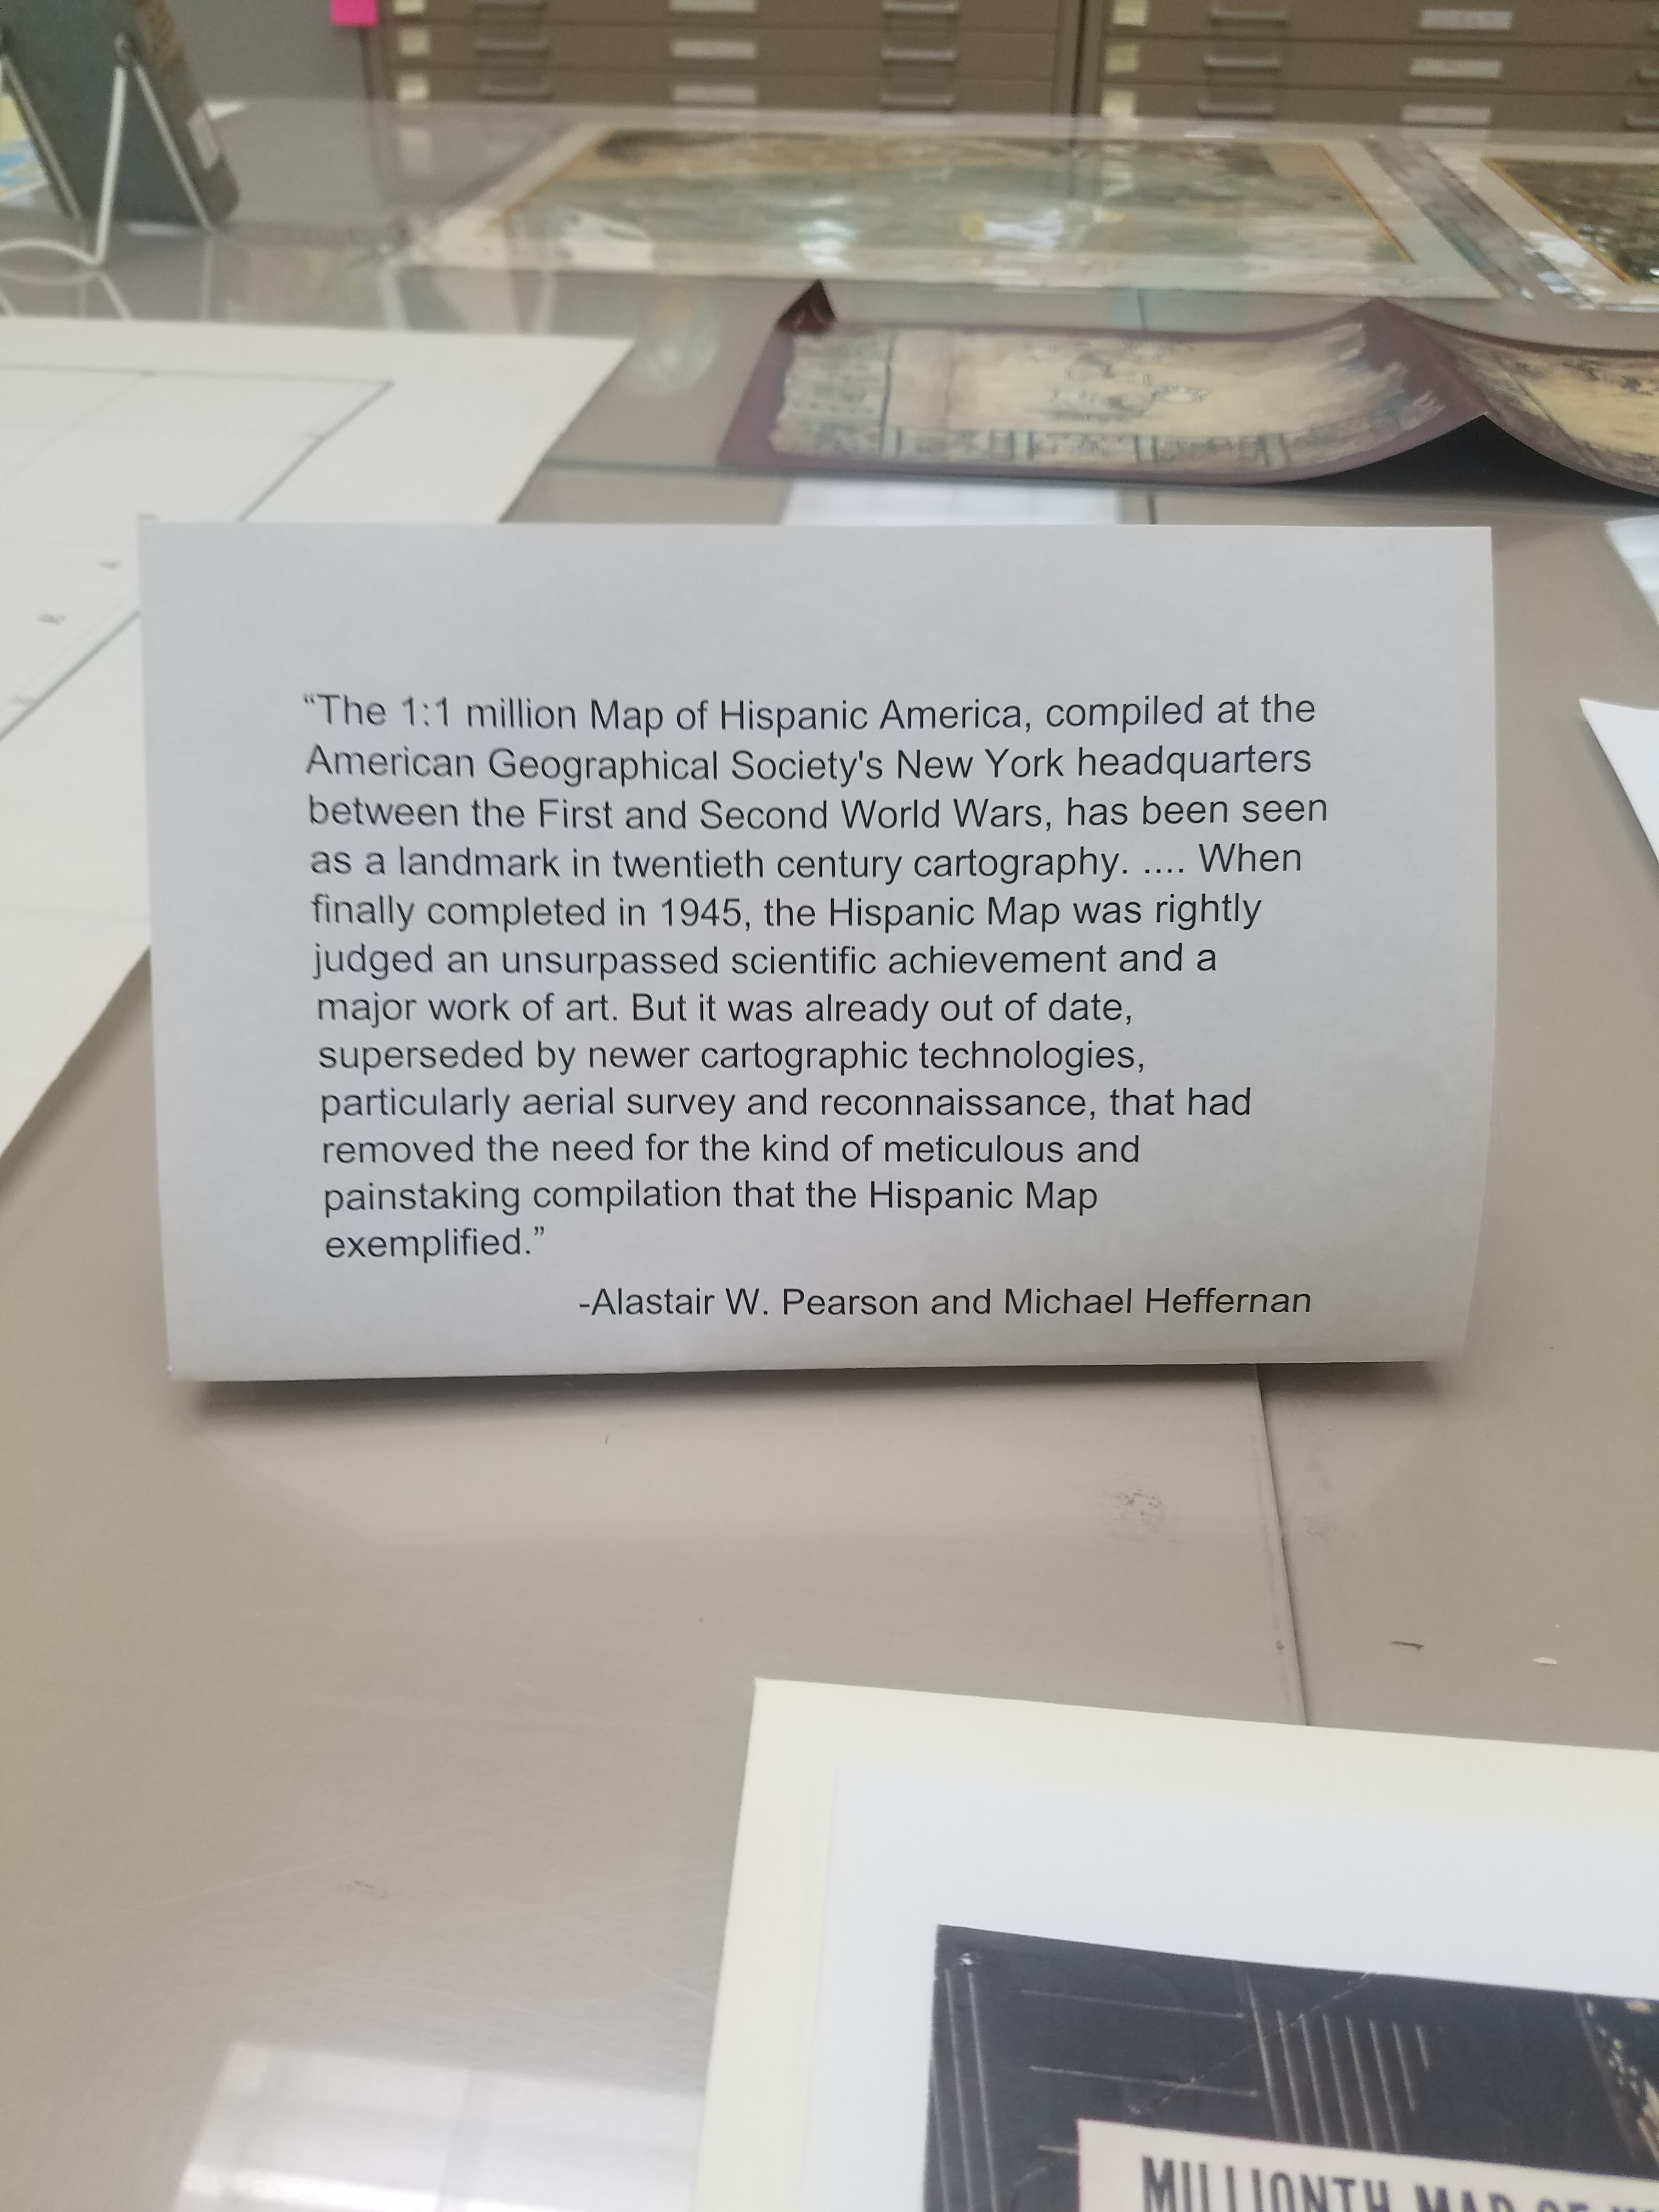
In Case You Missed Us: The National Hispanic Heritage Month Pop-Up Exhibit
By Lauren Maddox
Last month, I wrote about our then-upcoming Pop-Up Exhibit in celebration of National Hispanic Heritage Month. The exhibit was a collaborative project in conjunction with the UWM Archives to showcase some of our collections and honor this very special month. As we move into October, we will be putting up another exciting exhibit (stay tuned for more on that later!), but in case you missed this pop-up, here are some of the digital versions of pieces we featured in the exhibit:
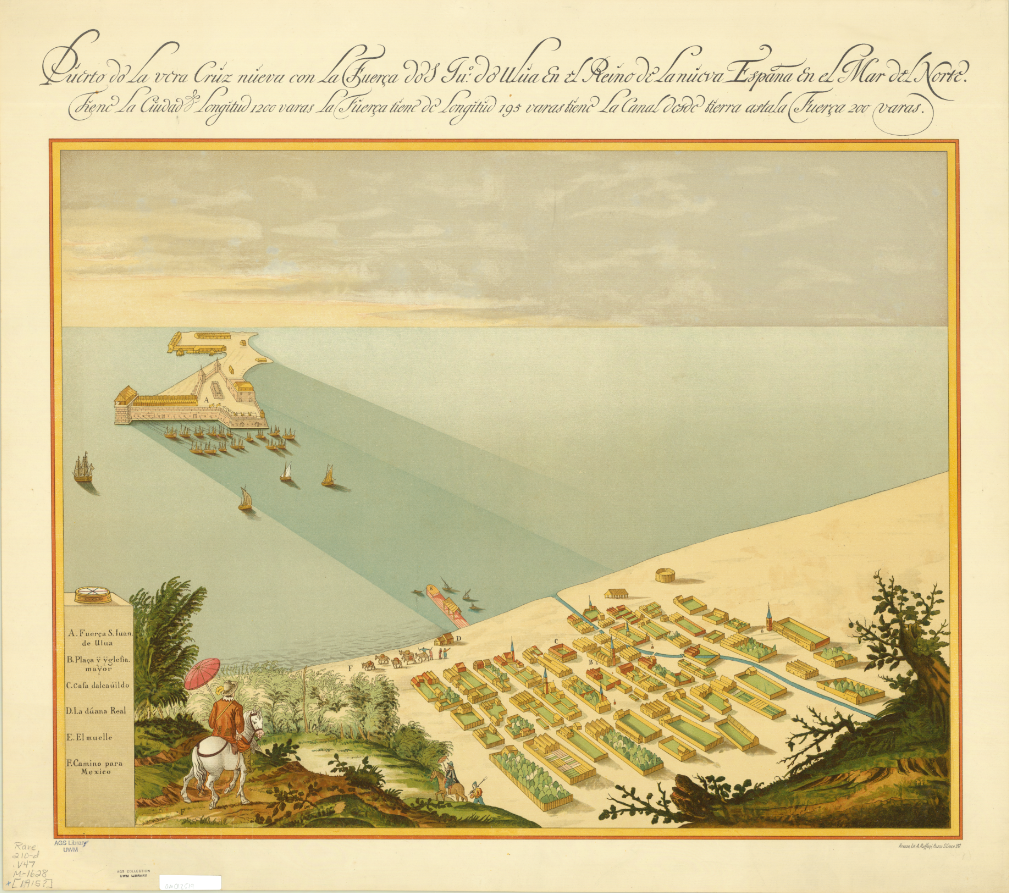
Map of San Juan Ulua Island in 1628. 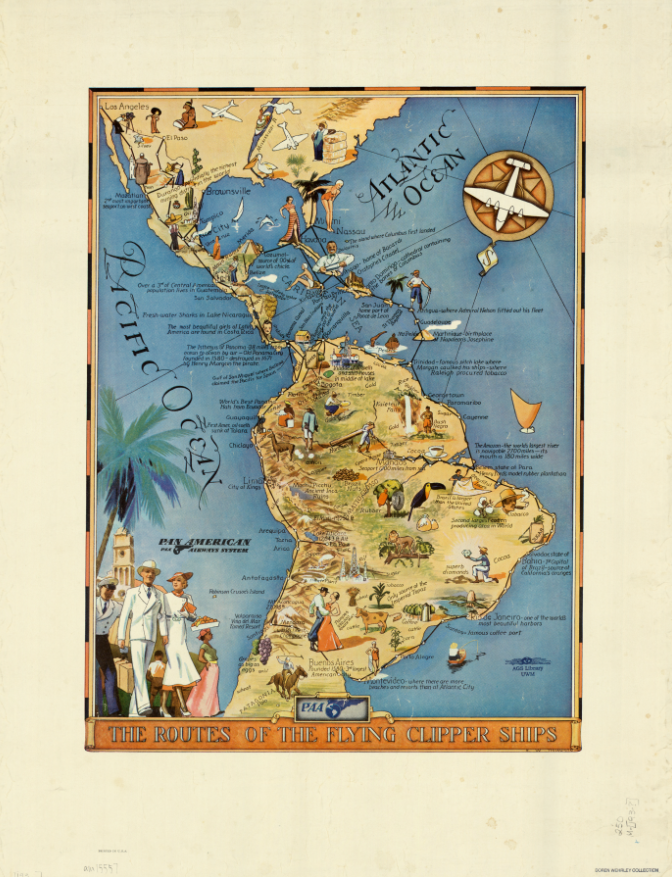
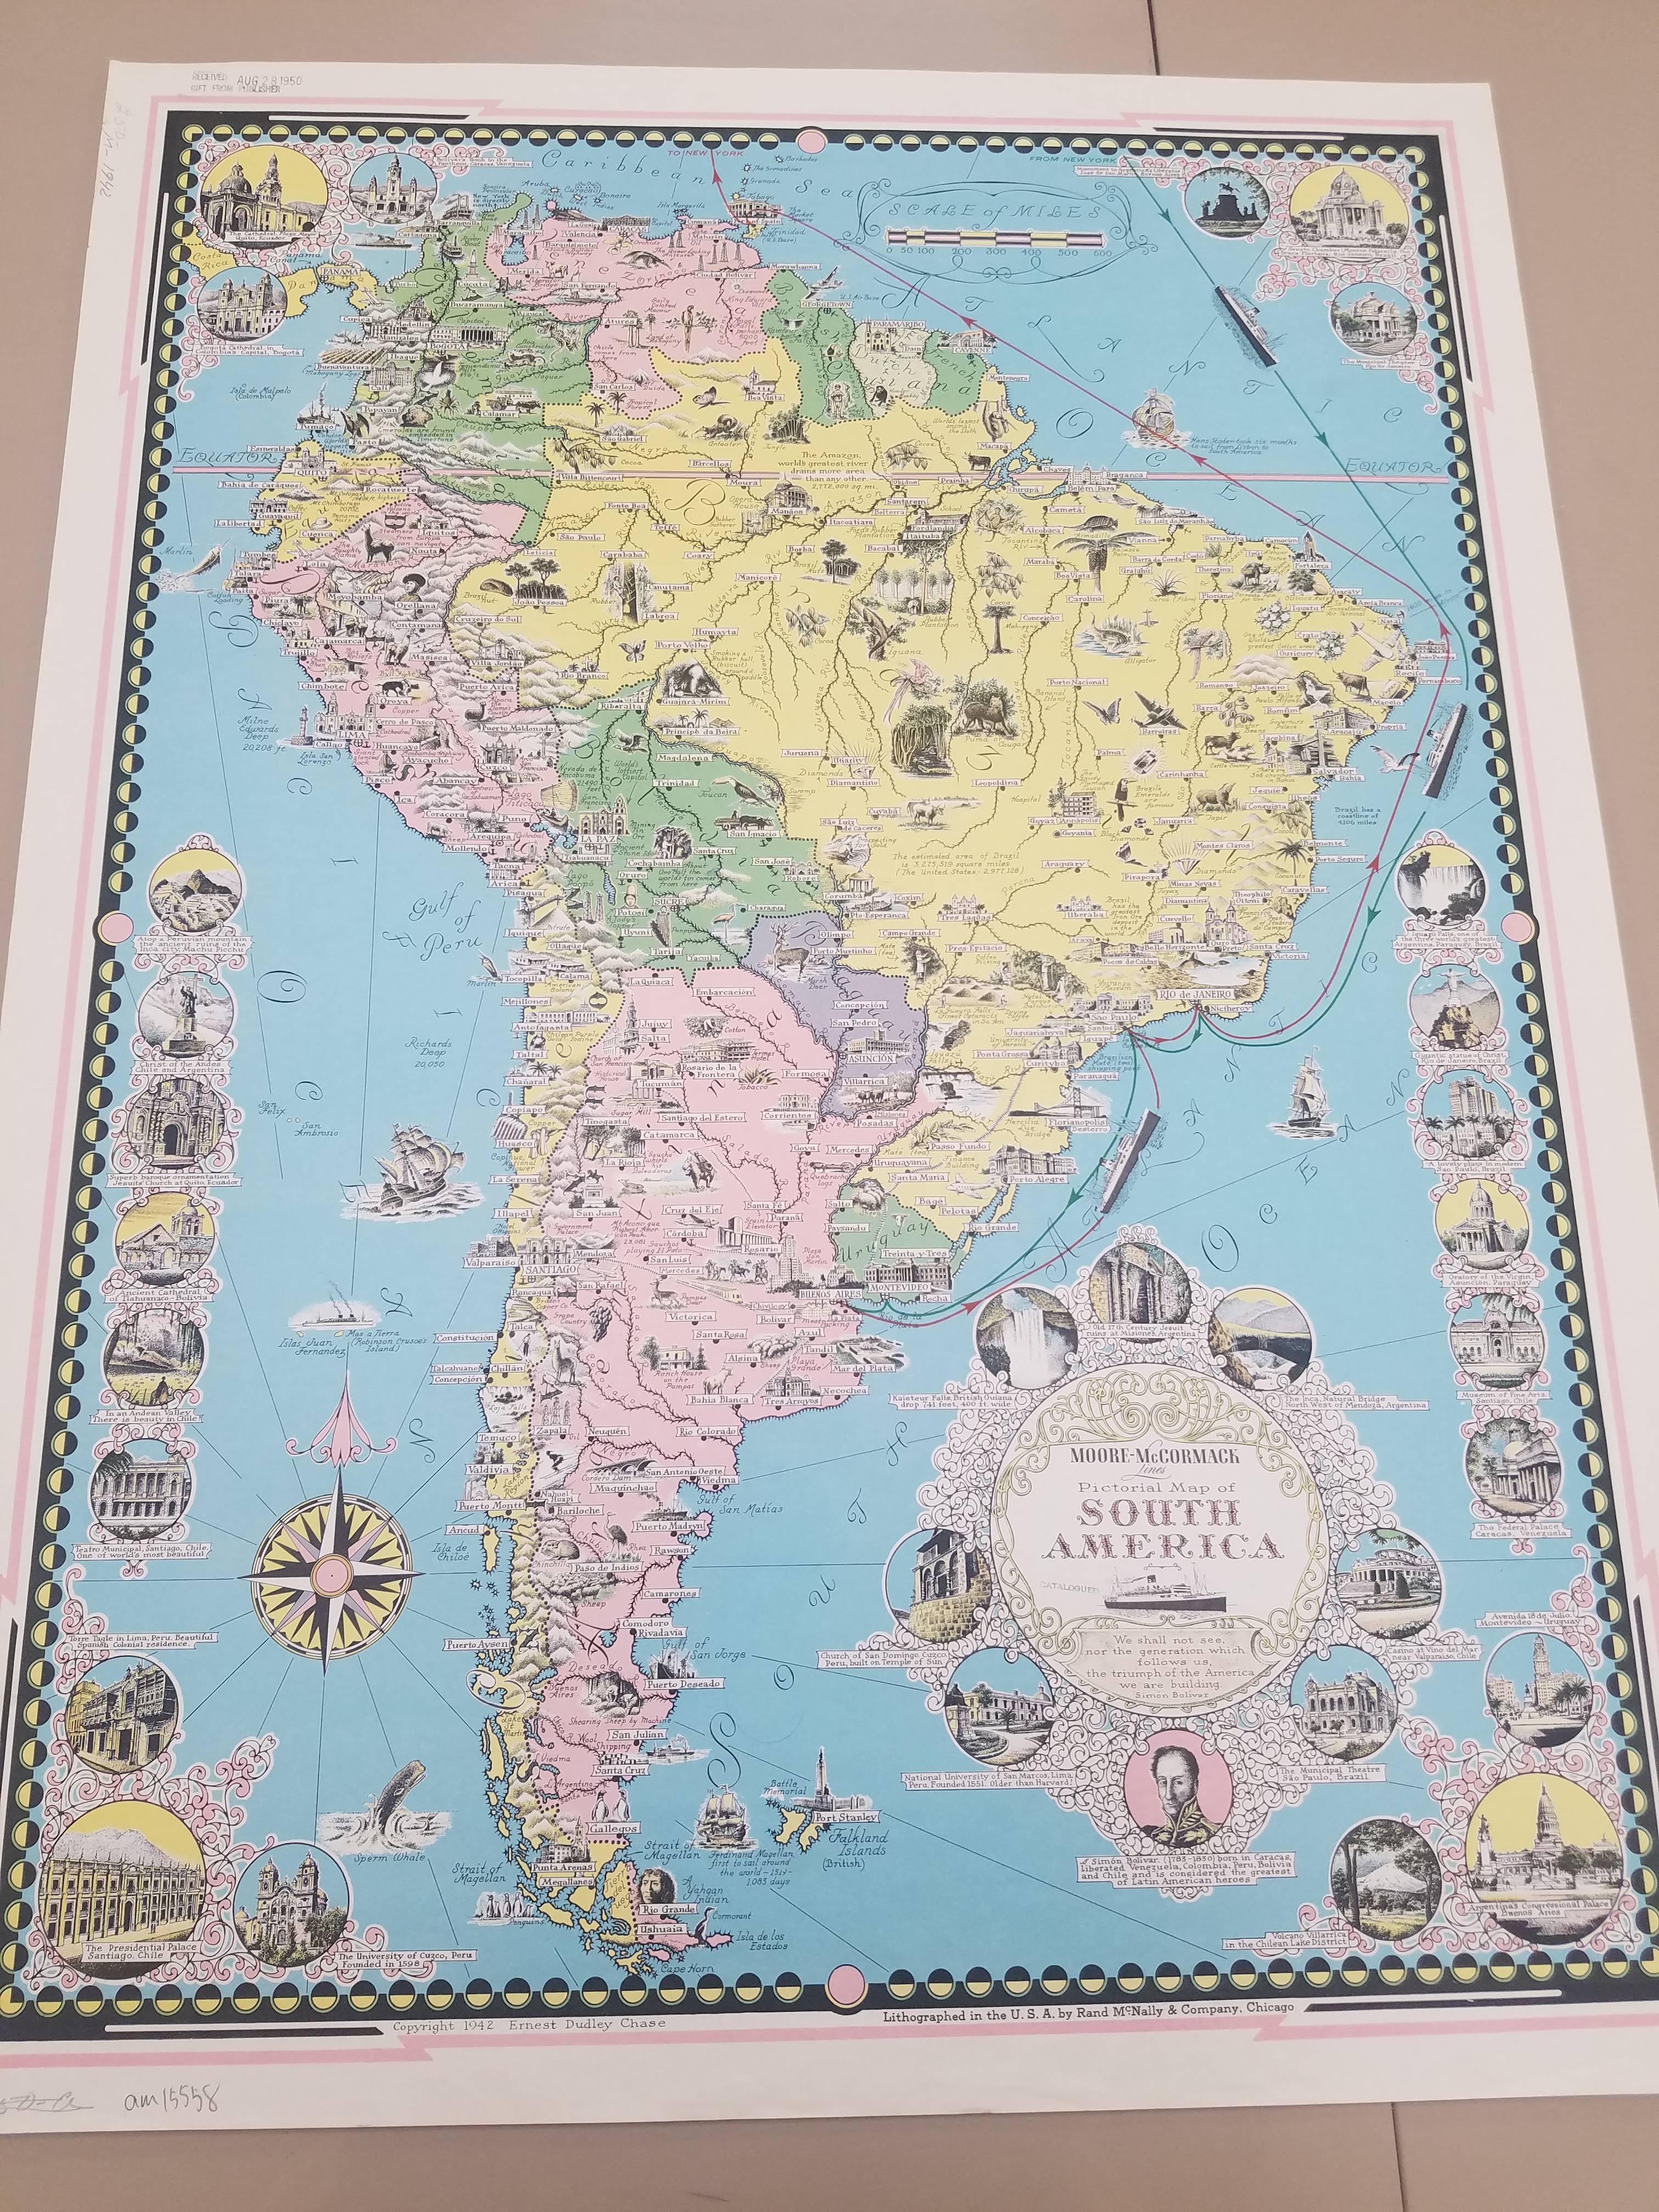
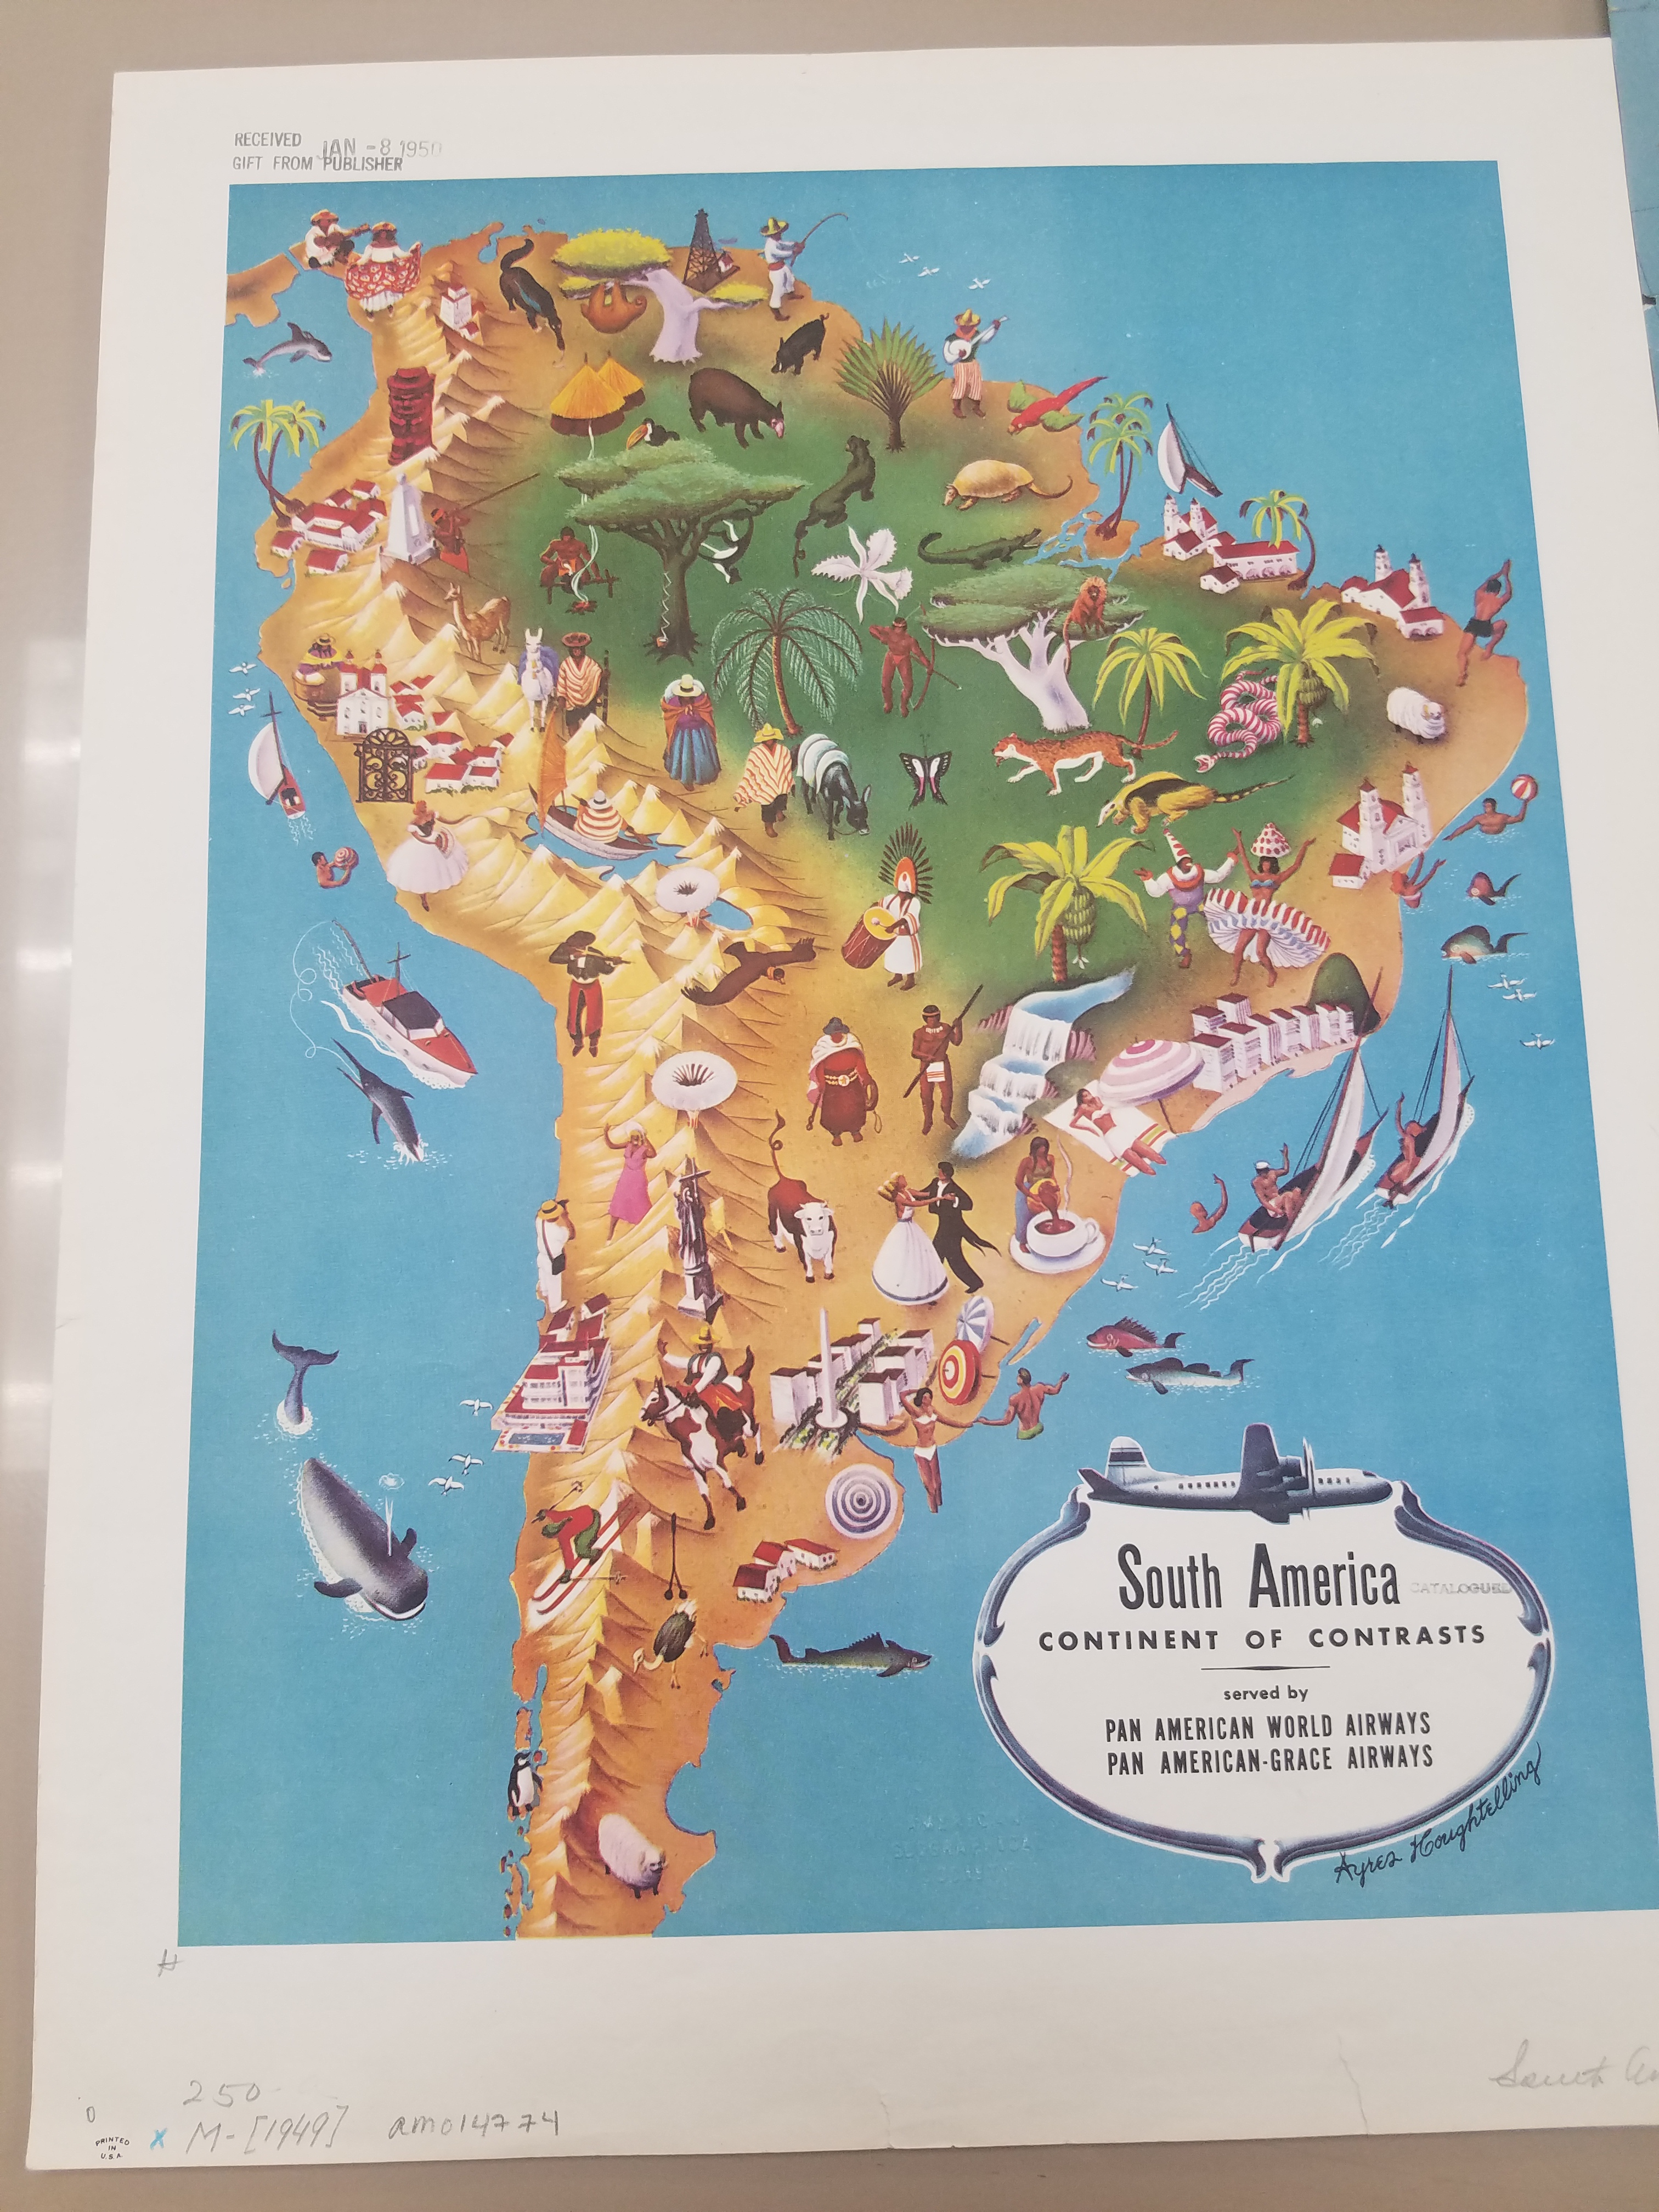
“The Routes of the Flying Clipper Ships,” 1930s. Click the links to see these maps in our Digital Collections! 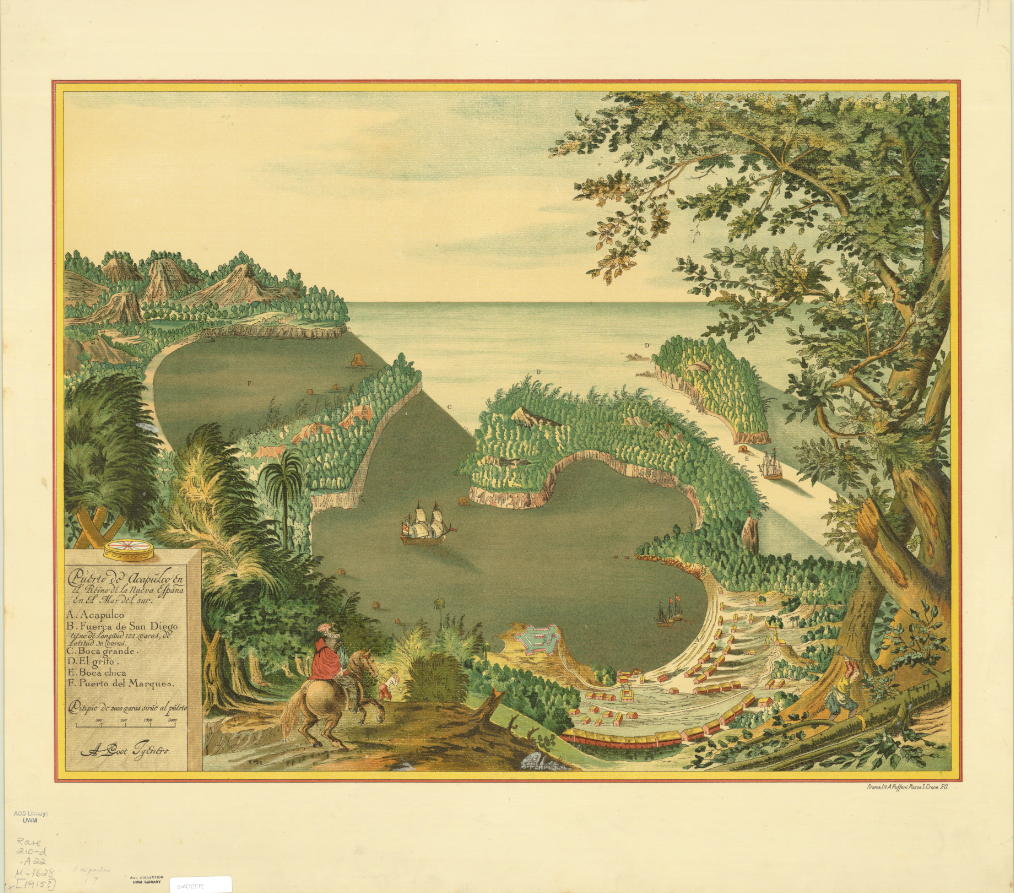
Map of San Juan Ulua Island in 1628. 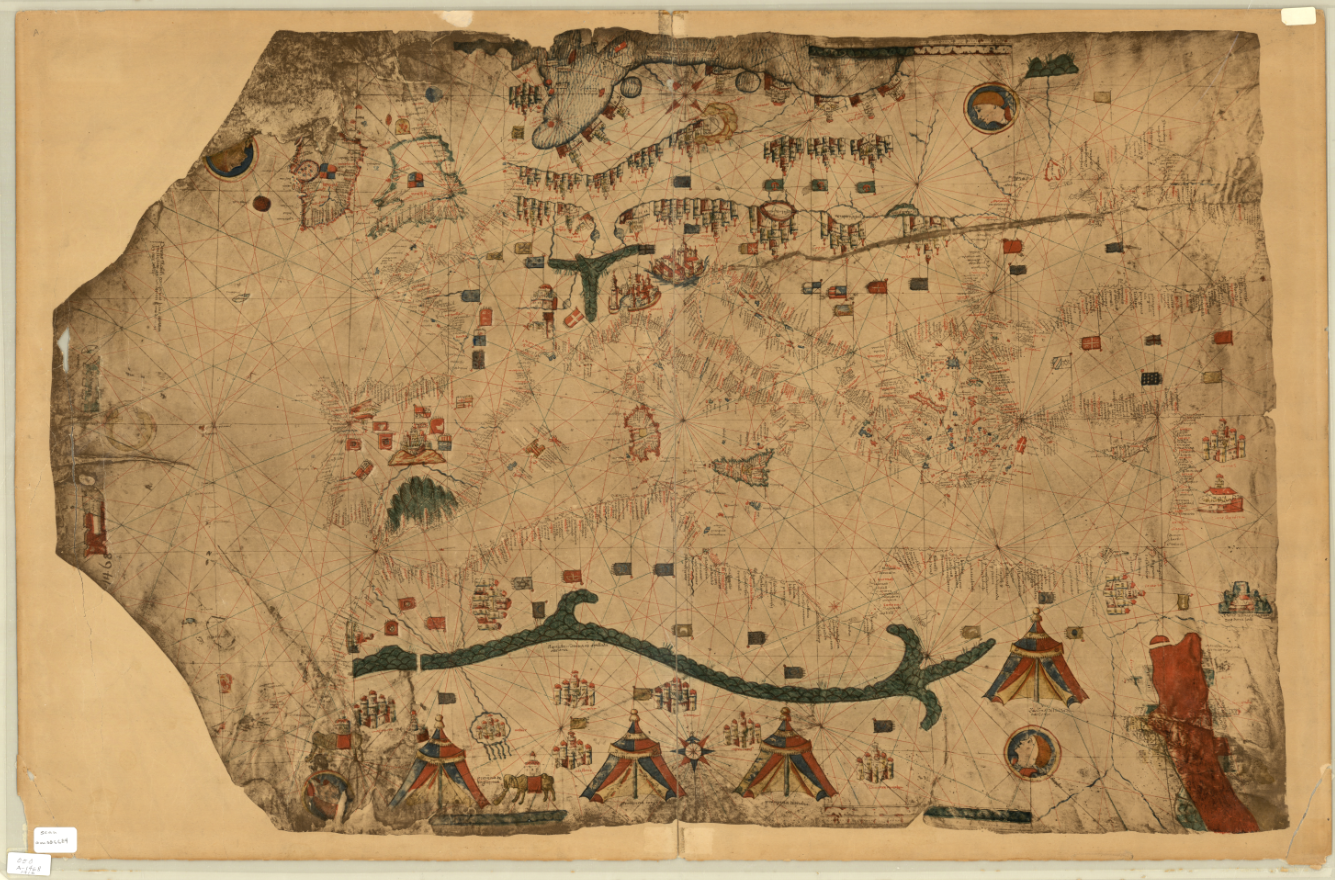
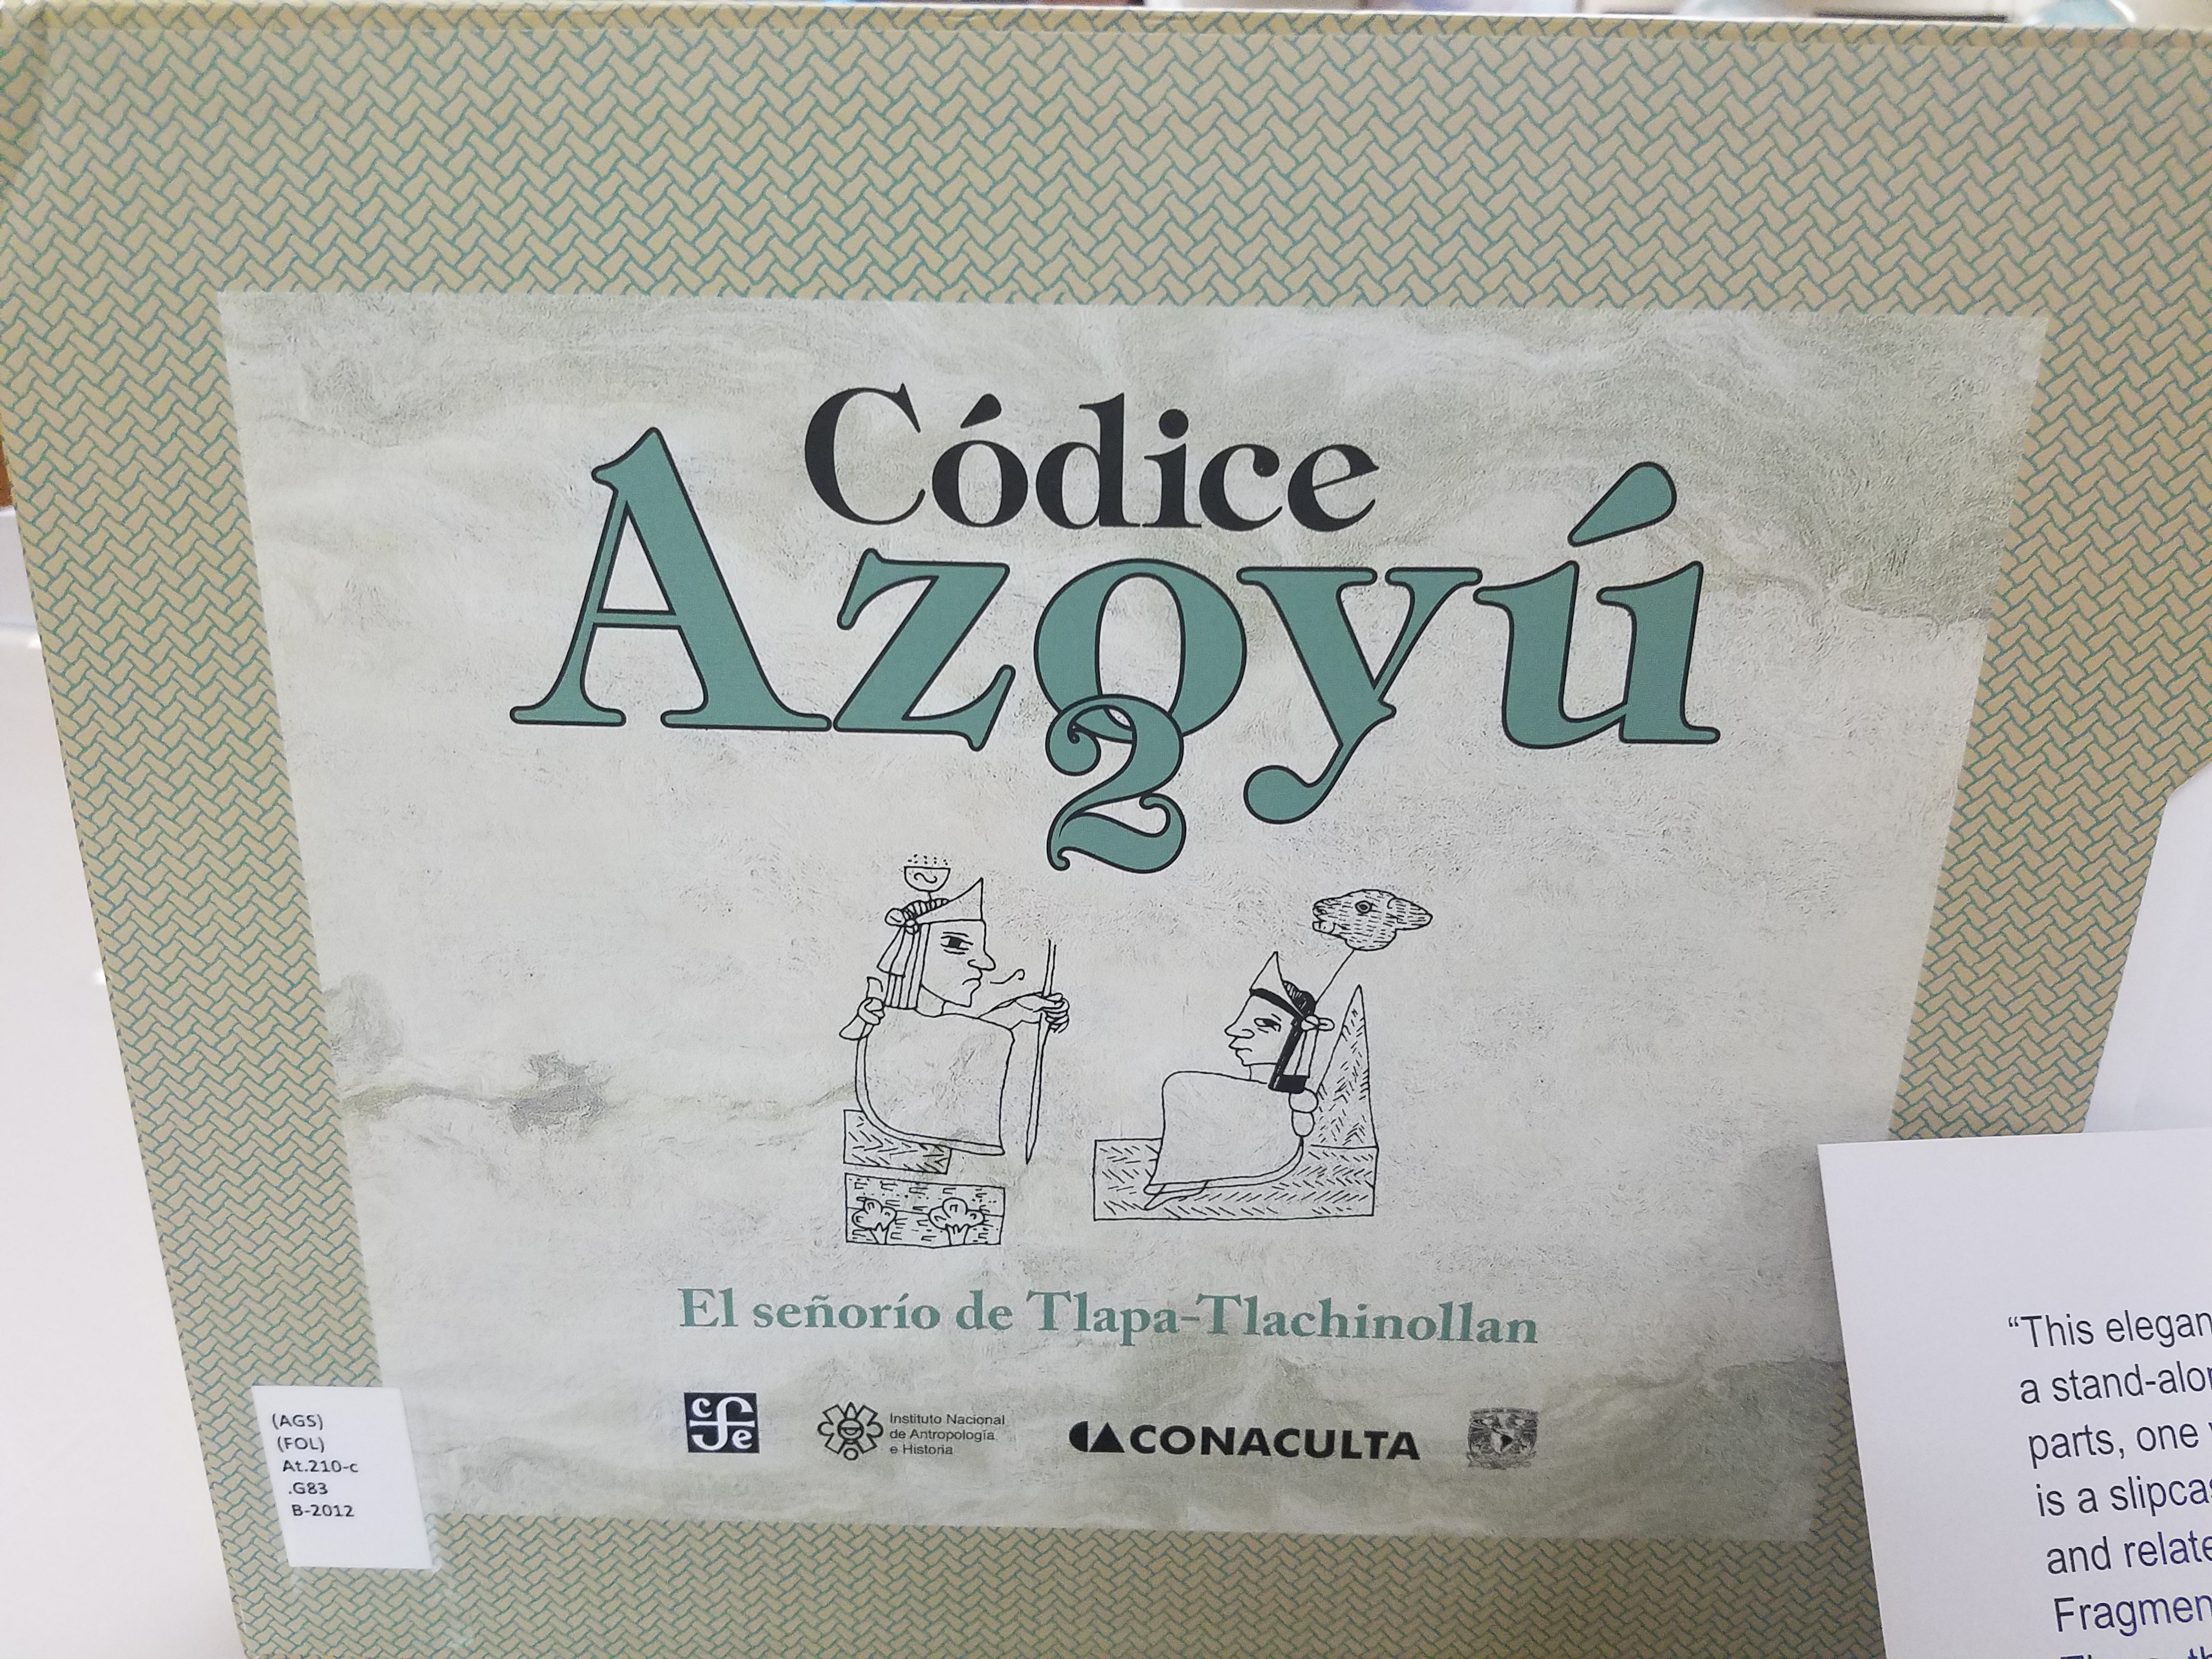
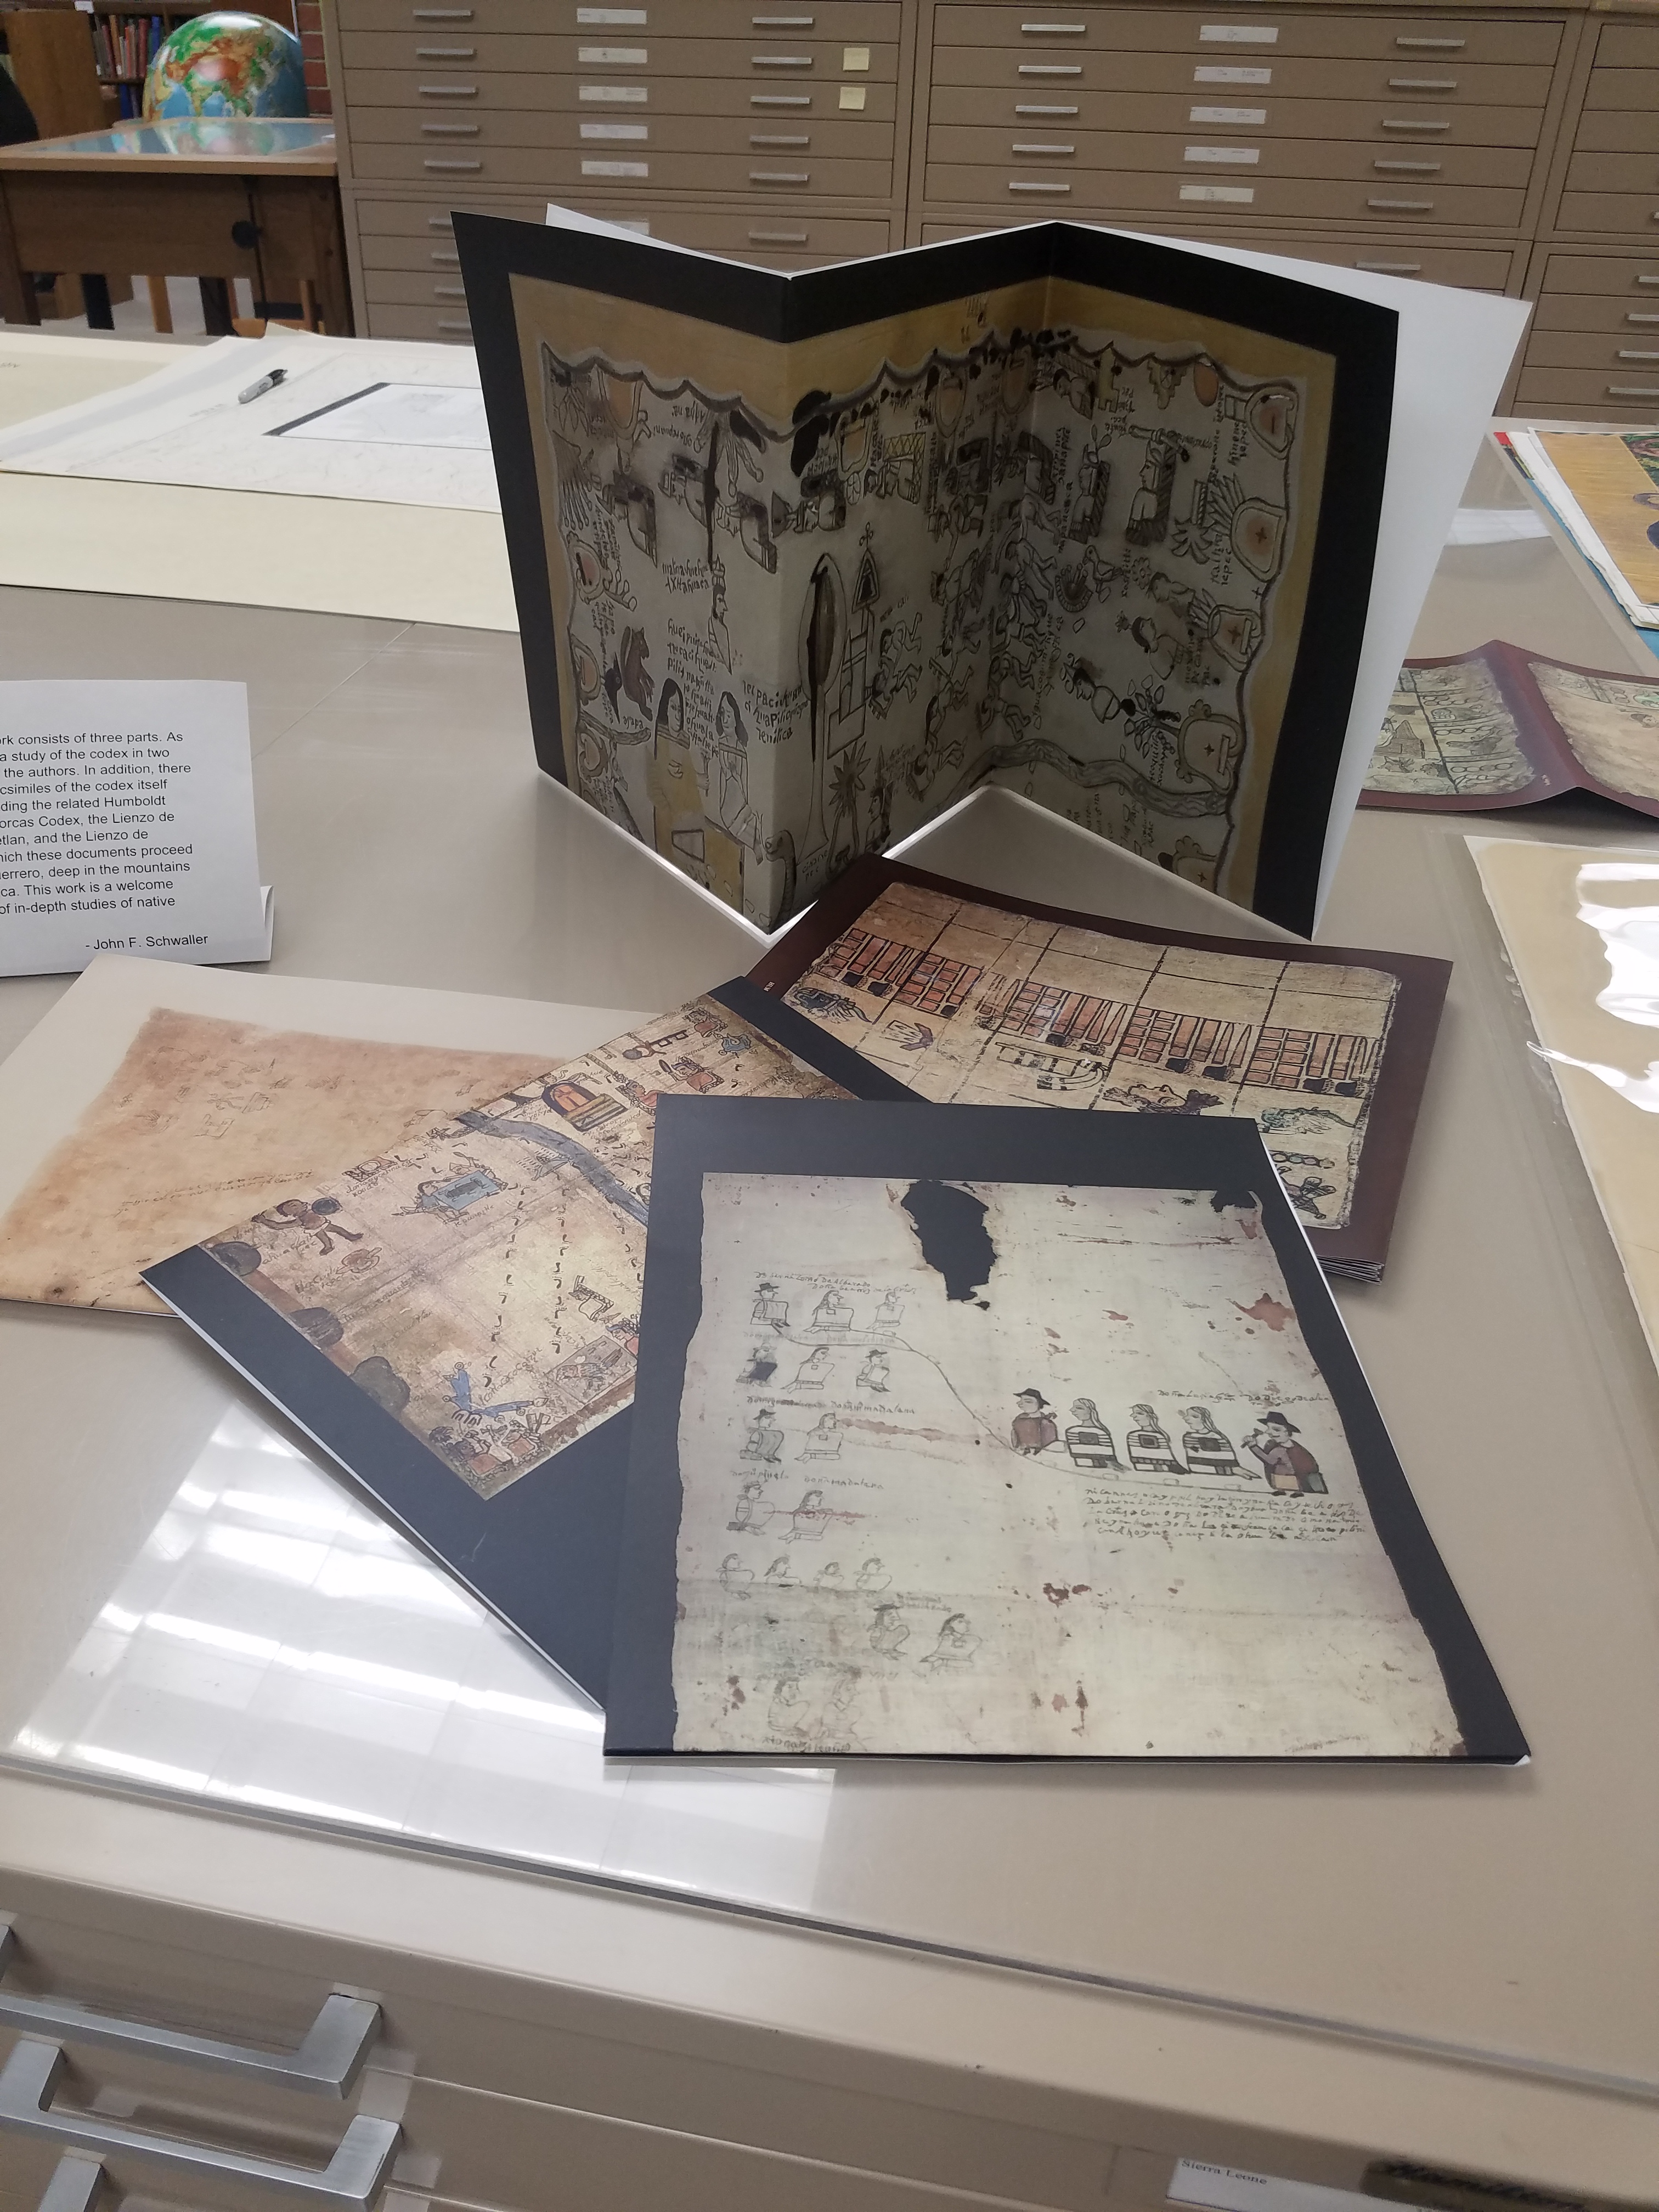
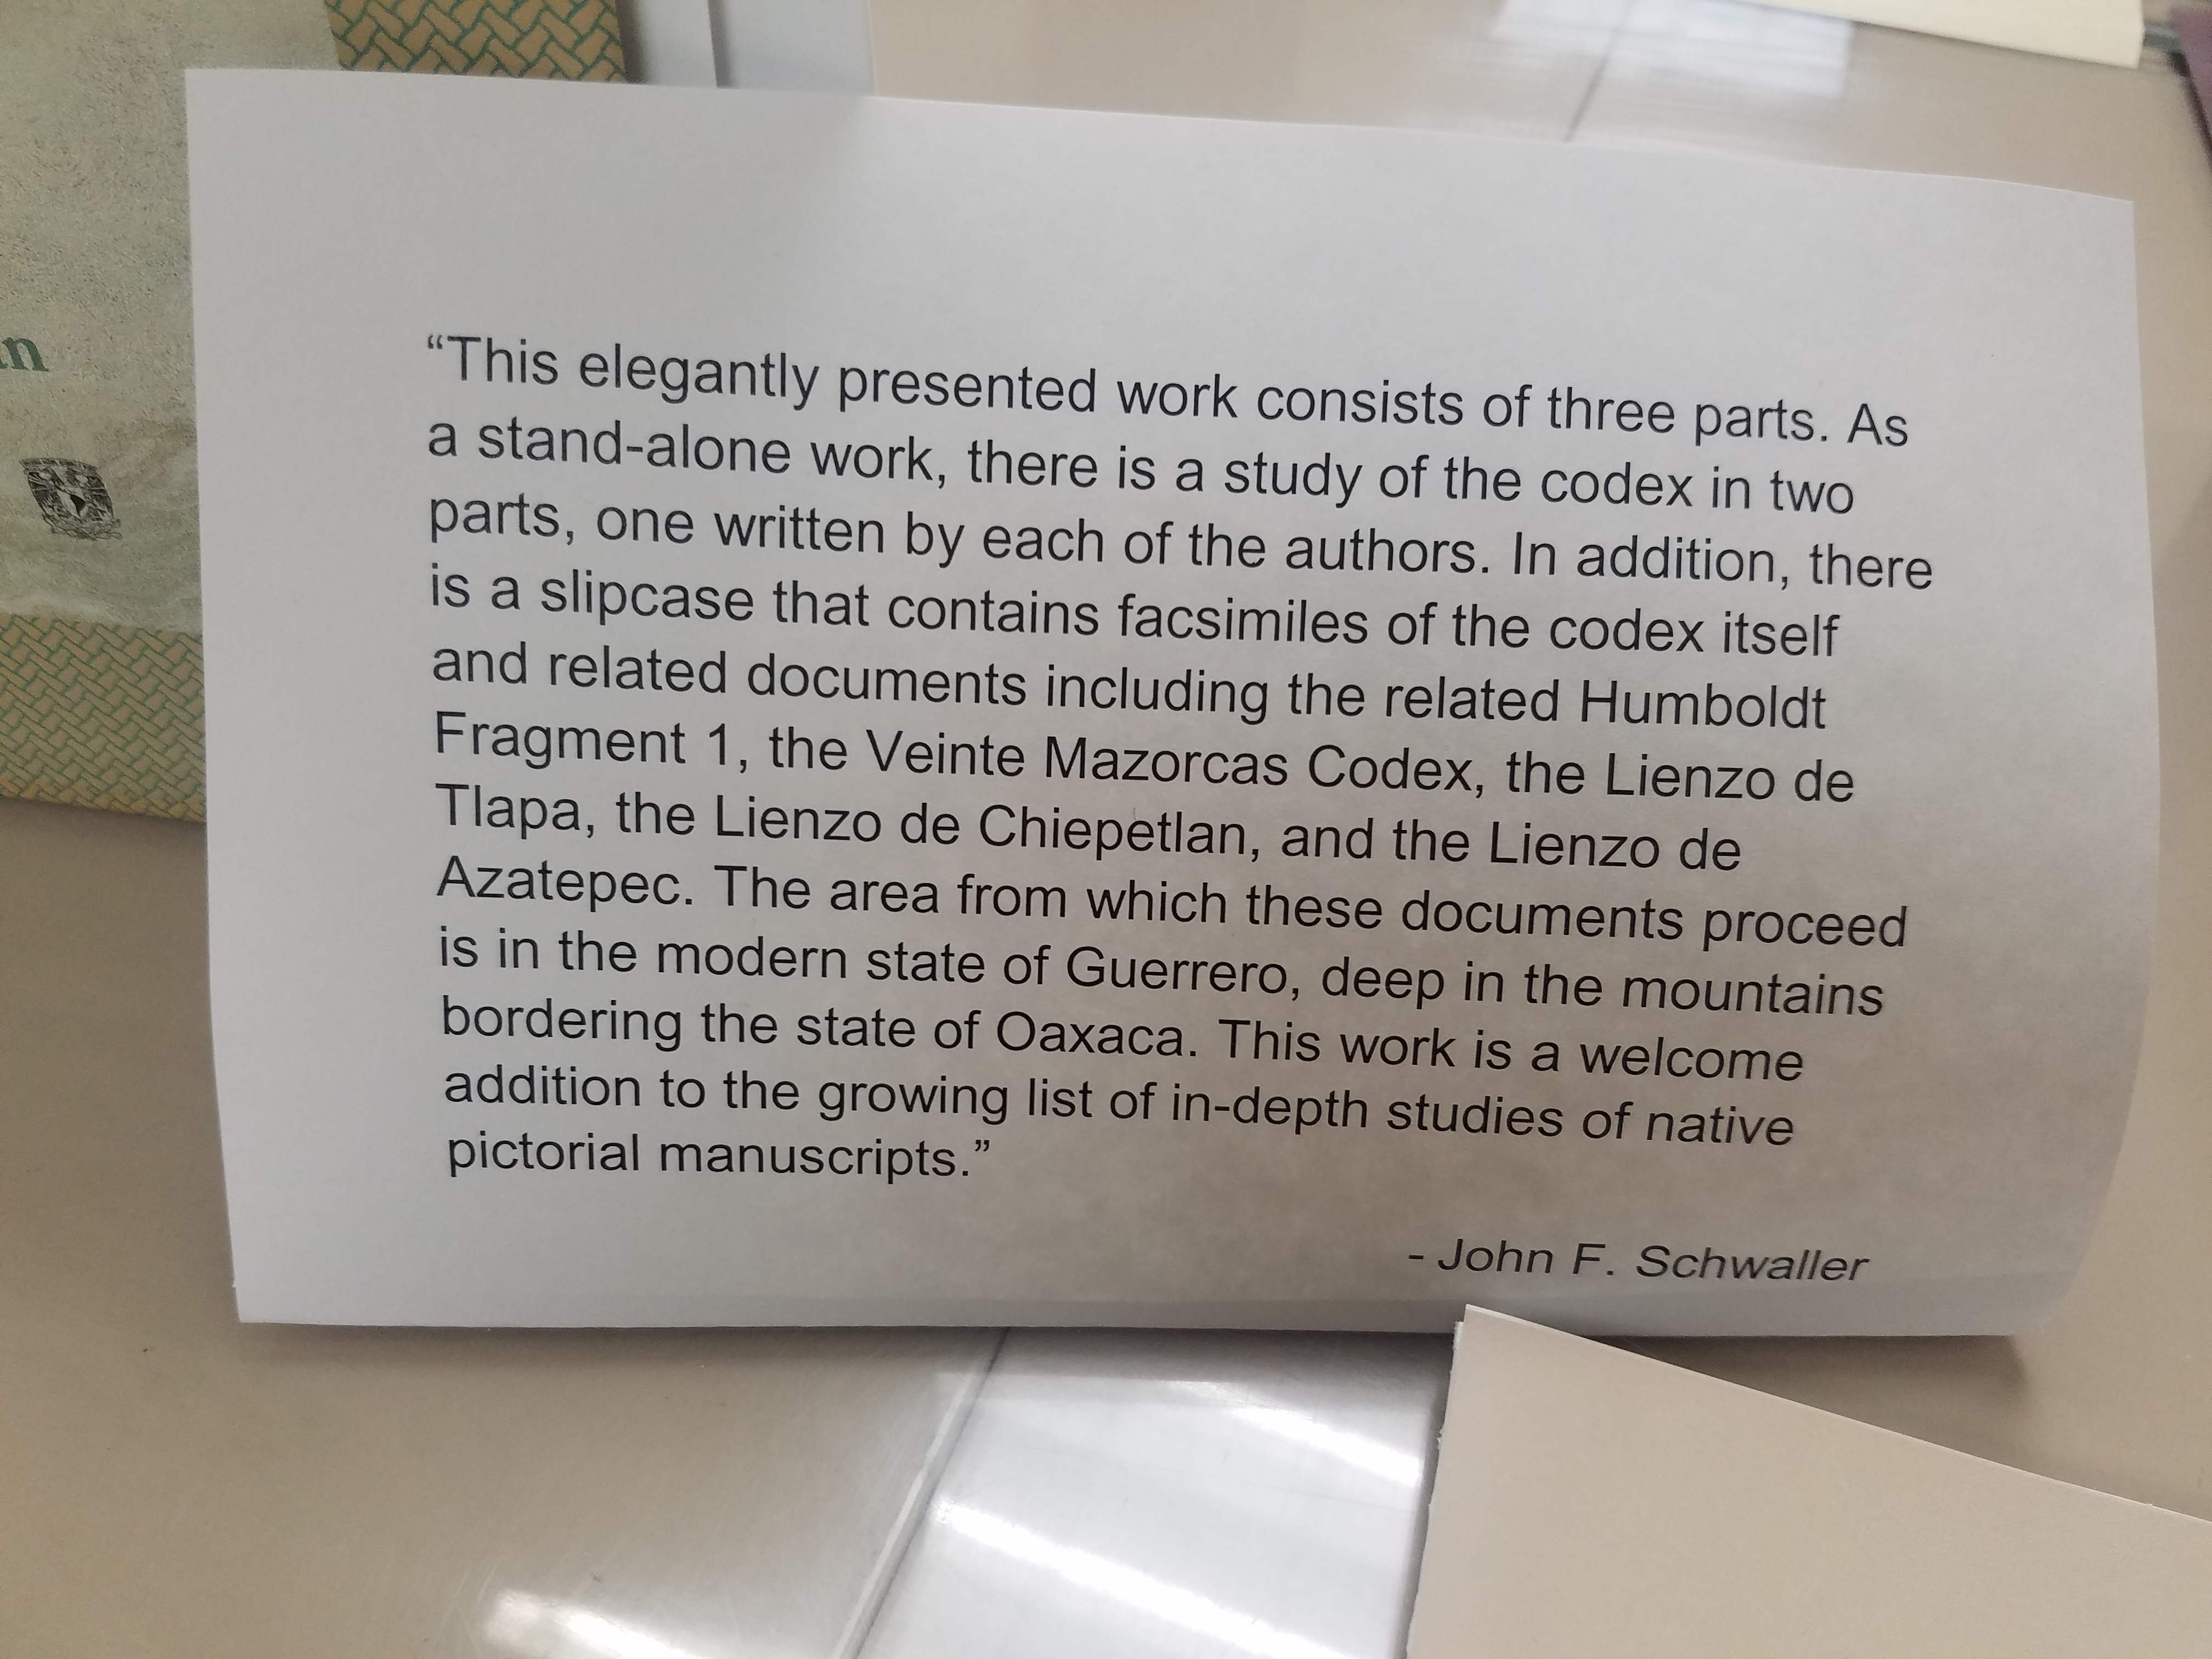
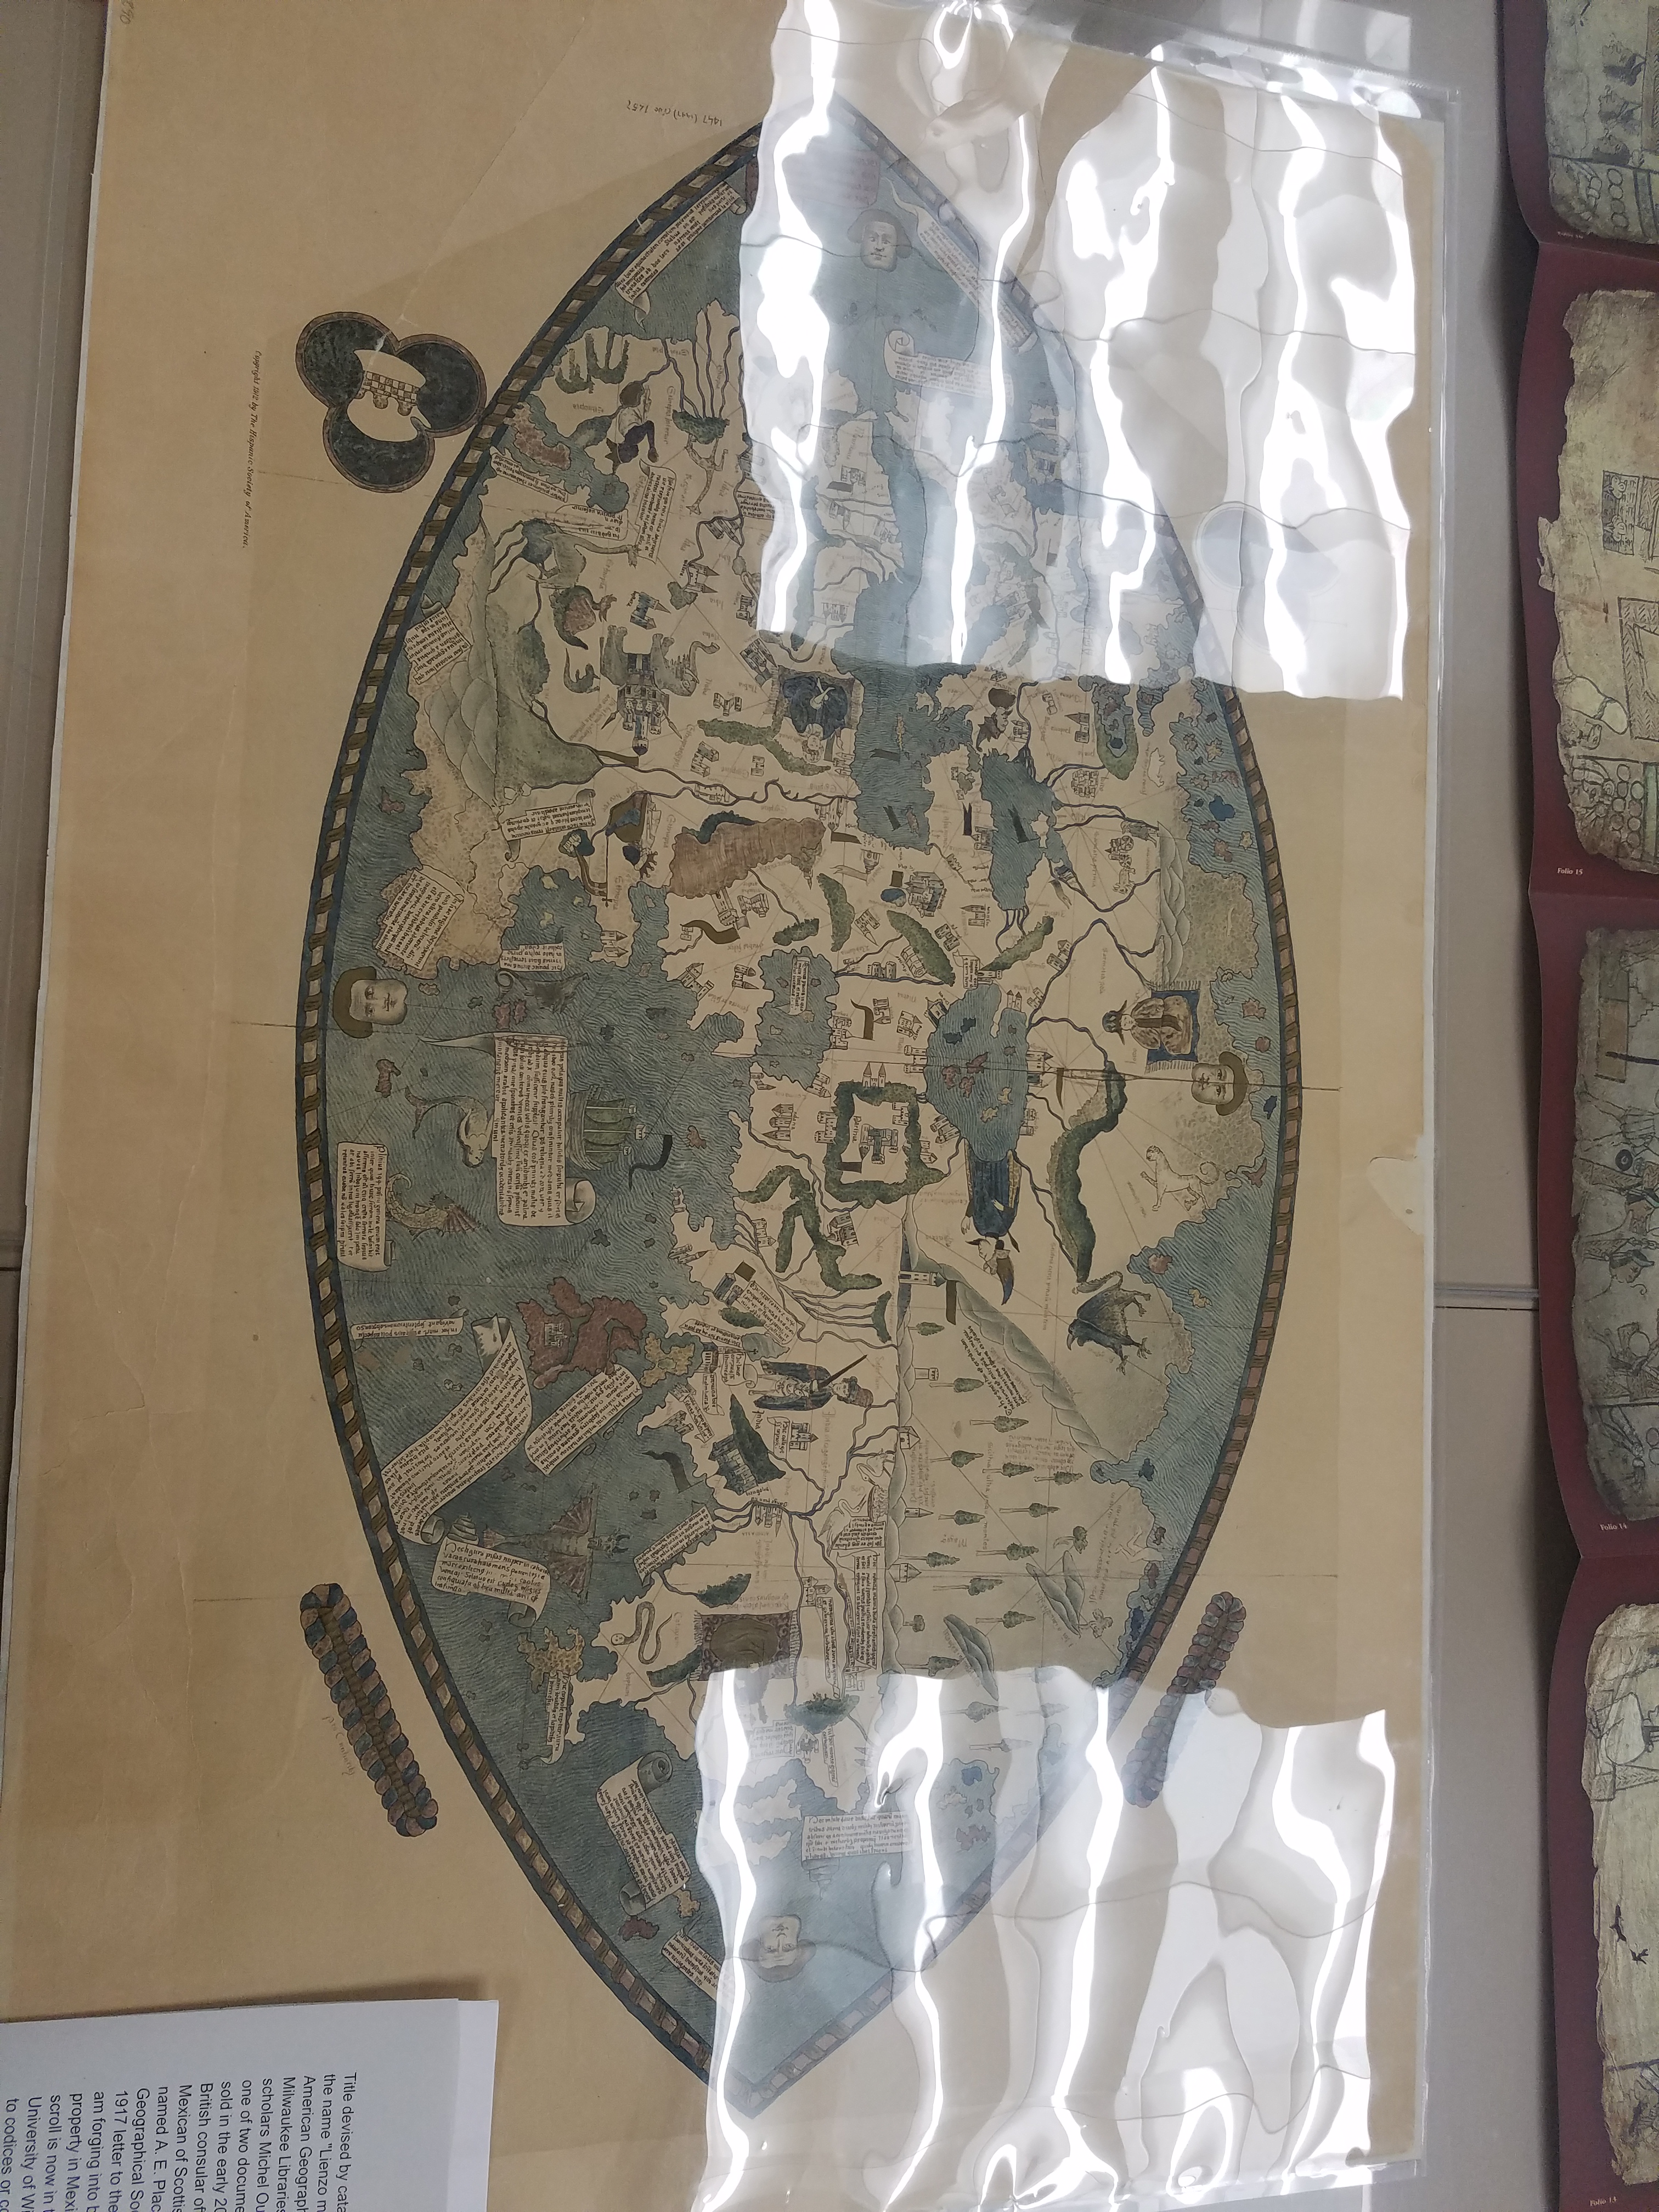
Fascimile of 1468 World Map, previously owned by the Hispanic Society of America.
And some photos of the exhibit live and in-person:
Stay tuned for more updates about future exhibits!
The Case of Turpan, China: How to Destroy a Culture
by Don Hanlon, Emeritus Professor of Architecture, UW-Milwaukee
In 1987, I conducted a survey of vernacular architecture in the oasis of Turpan in Xinjiang Province, in the far west of the Peoples Republic of China. The project was funded by the United Nations Development Program in response to my initial report to the UNDP in 1985 that this ancient architectural tradition was being systematically destroyed as part of a vigorous effort by the Chinese government to eradicate the indigenous culture of the Uighur people. The Uighur have lived in Turpan continuously for over 1100 years. My role was to document, in photographs and drawings, the architecture of the town as it related to Uighur social customs and other aspects of culture before they were annihilated. As of this writing, the Chinese government has demolished all of the Uighur domestic and religious architecture in Turpan except for a few examples preserved as tourist attractions.
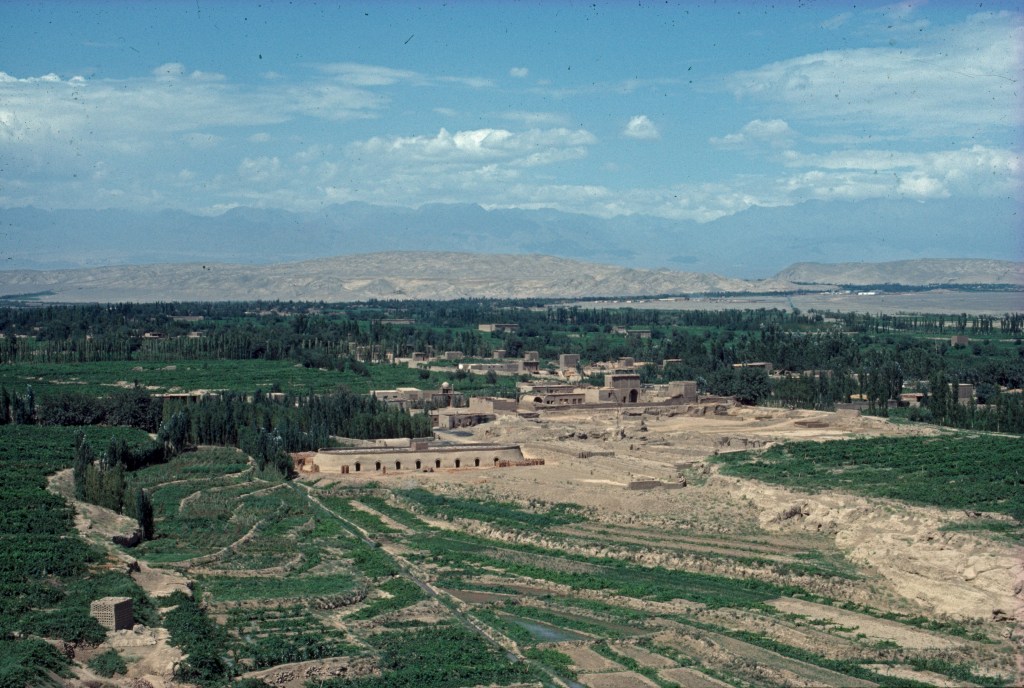
For centuries, Turpan was an important node on the Silk Road for merchants traversing the hostile Taklamakan desert in central Asia. The Uighur were originally a powerful Turkic-speaking tribe which over time absorbed cultural influences from the many different people who passed through their domain. For example, important architectural characteristics, music and dance show strong influences from Persia and the region of central Asia to the west known as Transoxiana, an area that was home to the great cities of the Mongol empire, such as Samarkand and Bukhara. The Uighur practice a form of Sunni Islam, but due to their heterogeneous population, religious practice and Islamic social conventions are moderate and tolerant.
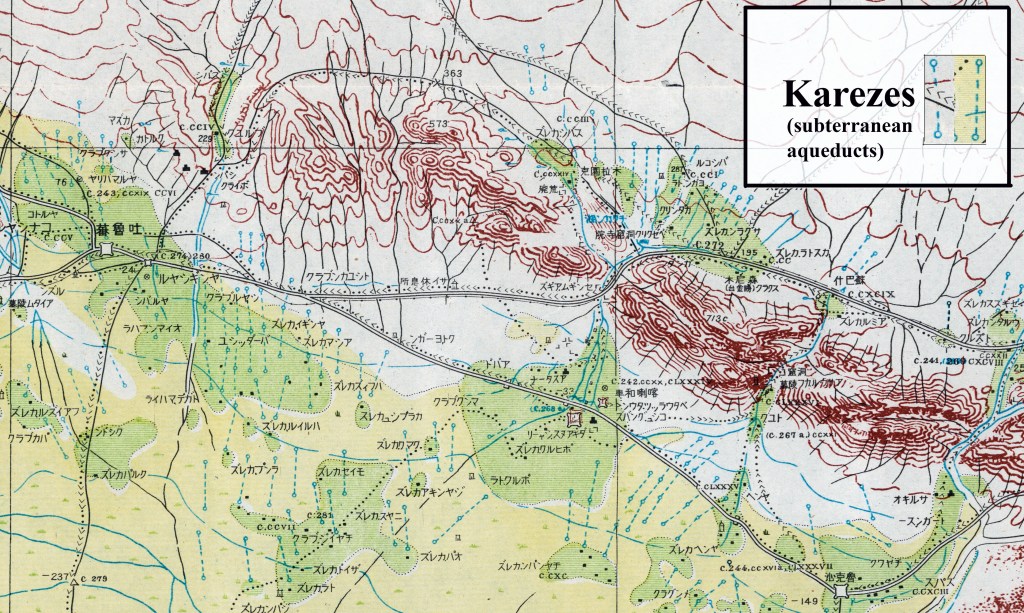
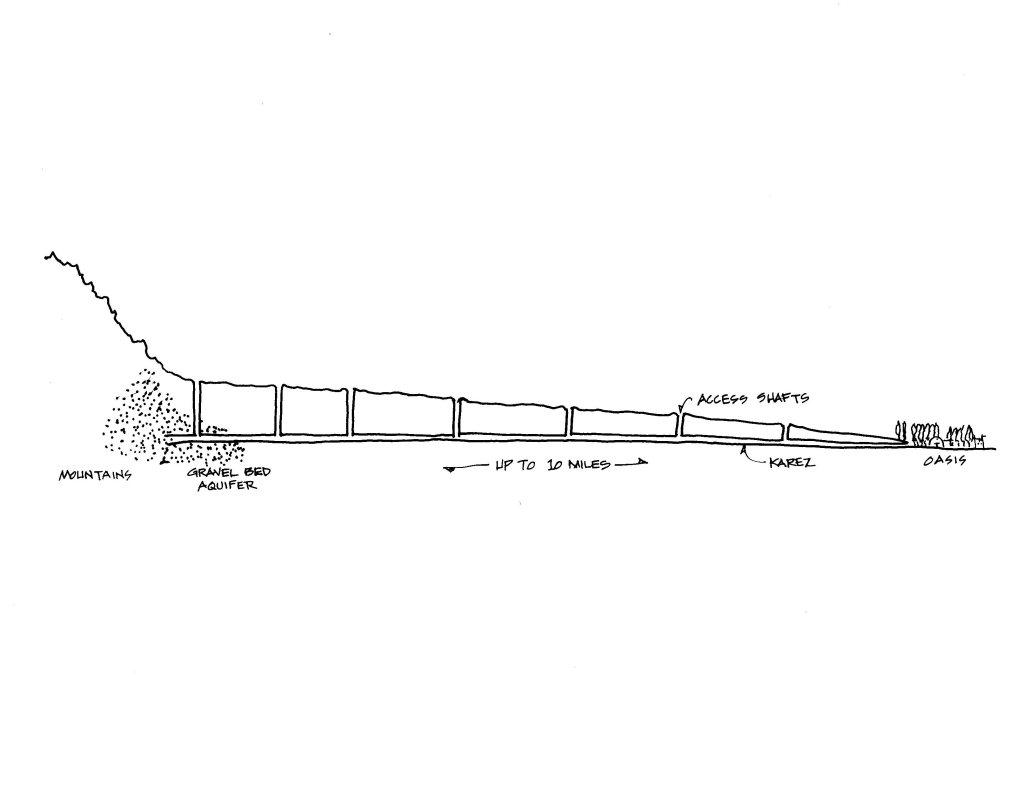
Despite a harsh climate of extreme heat and zero rainfall, trade and agriculture in Turpan have thrived due to an innovative hydrological innovation imported many centuries ago from Persia. This is the system of kareze which are subterranean aqueducts that bring water to the oasis from the foothills of the Tian Shan mountain range to the north. The kareze are tunnels dug far below the desert surface, carefully engineered to maintain a constant shallow slope to prevent erosion. Thus, Turpan enjoys clean, cold water year-round for both domestic and agricultural use. A 1943 map of Turpan by a Japanese spy shows the kareze as dotted lines (courtesy of the American Geographical Society Library).
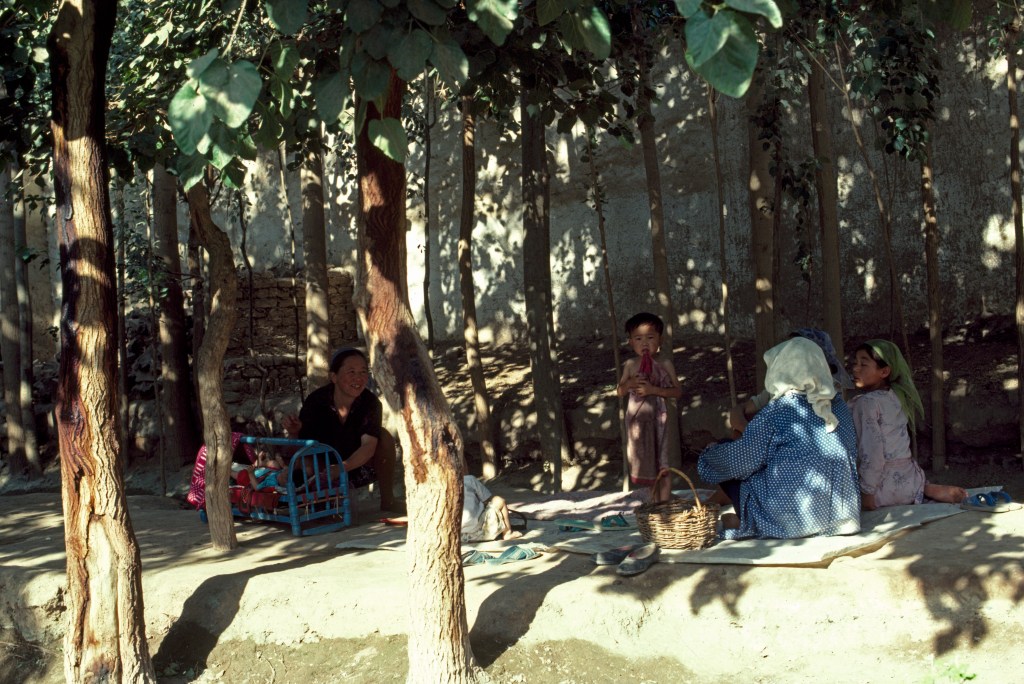
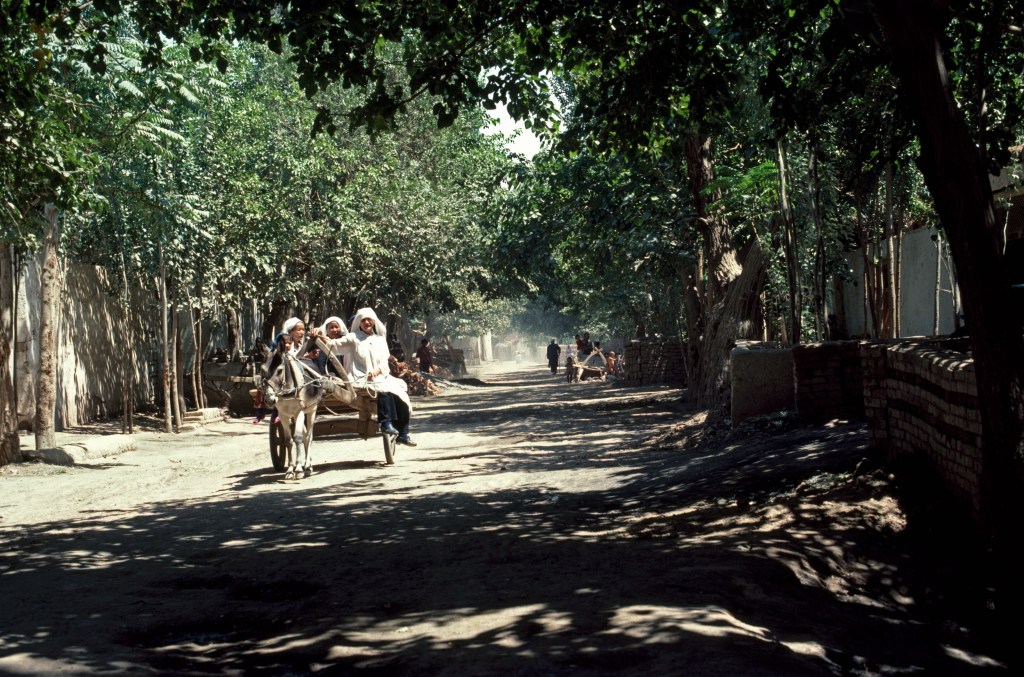
The kareze open into a system of canals in the town that form the boundaries between streets and residences. Tall, straight poplars grow in tight rows directly out of the canals. These perform several important functions: they provide deep shade for the houses and for the street; they create a wind break to control dust; they provide wood readily available for construction and heating; and they create a microclimate in the street by transpiring water through their leaves into the air, producing a natural means of air conditioning that can lower the temperature in the street and adjacent houses by as much as 20 degrees Fahrenheit. After circulating through the town entirely by gravity, water then enters into second system of canals for irrigating agriculture. All of this is accomplished without any mechanical devices or artificial sources of energy – a truly sustainable method.

My study included two types of architecture under threat – houses and mosques. The house form in use in Turpan for many centuries was typical of vernacular houses we find in an arc from Morocco, across north Africa, the Middle East to central Asia. It organizes all domestic spaces around a central courtyard, which functions as the main living space of the house. This design is a highly efficient, sustainable building form, perfectly suited to a hot, dry climate without using any mechanical means to artificially heat or cool. The house operates on a diurnal cycle. At night, cool air settles in the courtyard while heat captured during the day in the thick surrounding walls radiates into the night air. During daylight, the gradually heating mass of the house draws the cool air of the courtyard into surrounding interior spaces. In Turpan, a thick grape arbor over the courtyard enhanced this passive cooling system by breaking direct sunlight while allowing the passage of air.
Another important characteristic of the vernacular house in Turpan was a construction technology based on sun-dried mud brick coupled with simple wood framing using the poplars – materials that were 100% organic, non-toxic, biodegradable, re-usable and required no fossil fuels for processing and transport. This was effective for two reasons: first, materials were available immediately to hand, inexpensive or free; second, the method of building was easily conveyed through an oral tradition of instruction and simple enough that just about anyone was capable of building their own house. As an architect, I was delighted to find myself in a town full of designers and builders of all ages enjoying the freedom to determine for themselves how they were to live.
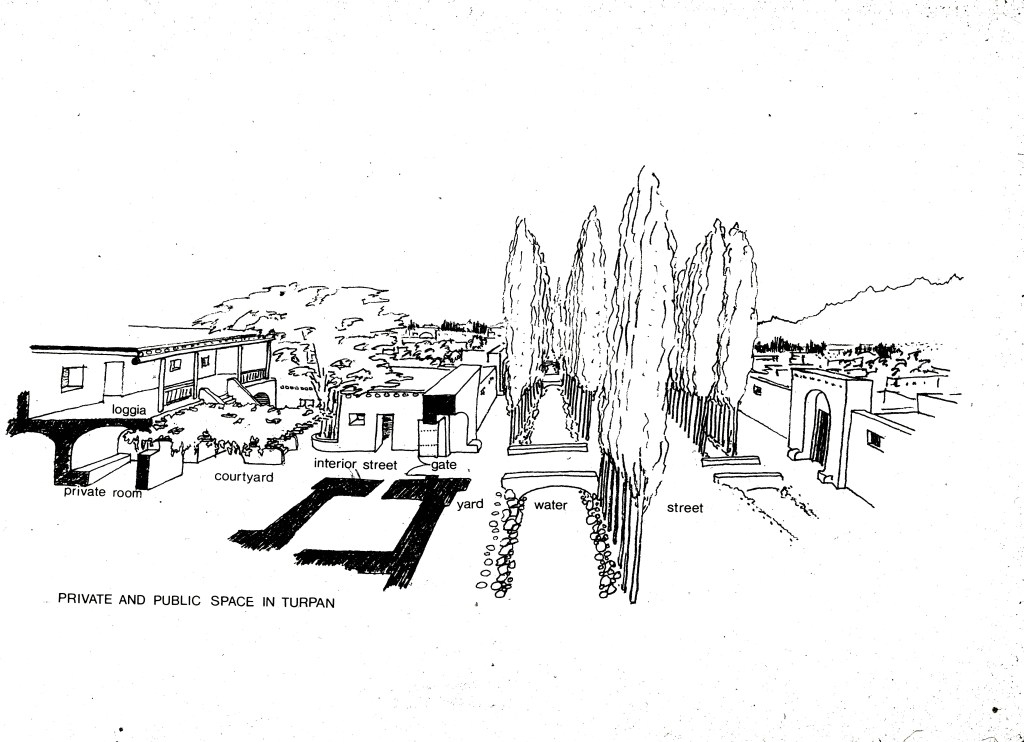
In addition to its entirely rational environmental attributes, the typical traditional house in Turpan served to organize and control social relations between members of the family it sheltered and the rest of the community. My study revealed a “privacy gradient” by which a sequence of simple spaces through the house and into the street produced a range of social settings in which people of varying relationships could interact informally or formally depending on circumstances or a person’s status in relation to the family. In this respect, the privacy provided by a house functioned in concert with the public life of the street rather than in opposition to it. There were eight social settings organized linearly in sequence: the public street; a short, wide bridge over the canal in front of the house; a narrow yard between the canal and the front wall of the house; a monumental gate that created a private room open to the street but separated from it by a canal; an interior street bounded by service spaces; the courtyard; a second floor mezzanine overlooking the courtyard; and finally the family’s entirely private interior spaces.

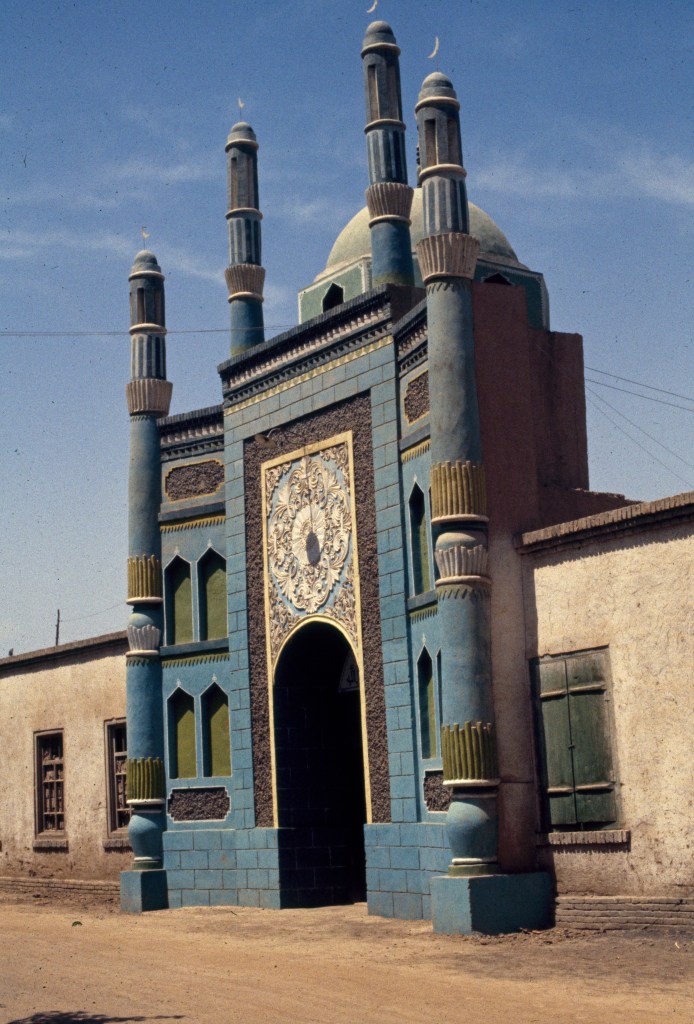
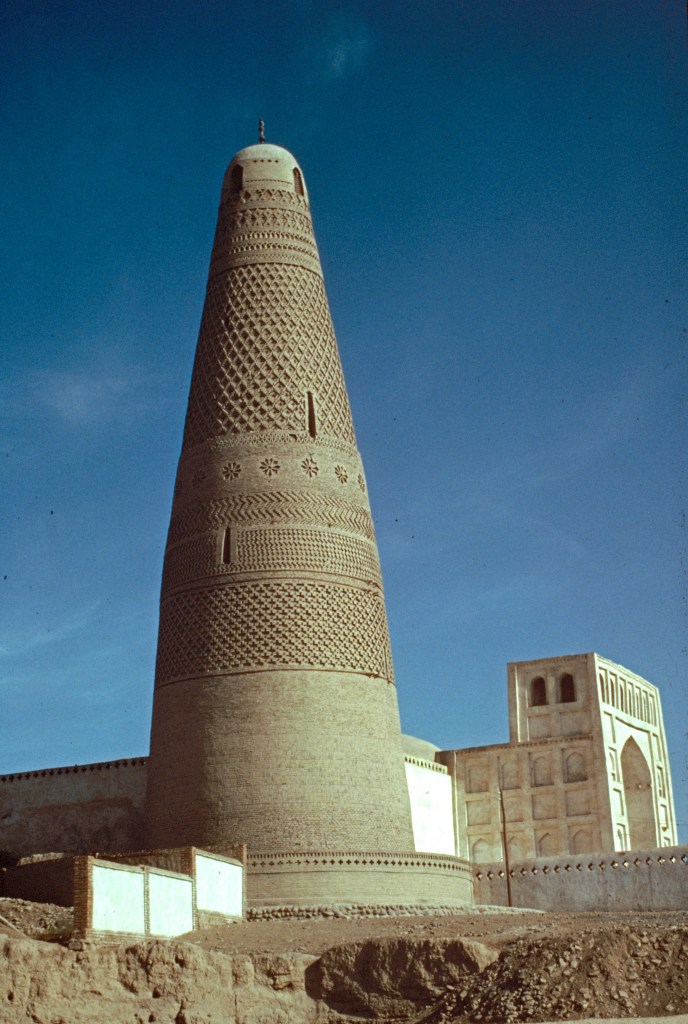
There were two types of mosques in Turpan: small ones serving neighborhoods and one large congregational mosque serving the entire community. Most of the small mosques vanished when the neighborhoods they served were destroyed. Similar to the one shown here, the neighborhood mosque typically employed an ornate entry gate on the street, then a narrow passage leading to a simple, often open-air prayer hall. Note in this example of a decorative gate, the plastered brick minarets marking the corners of the building have bases in the shape of pots. This motif harks back to the form of much older, extinct precedents in which the minarets were made of bundles of reeds. These were set in pots of water to protect them from insects. The ancient, traditional form in a fragile material persisted in a later durable material.
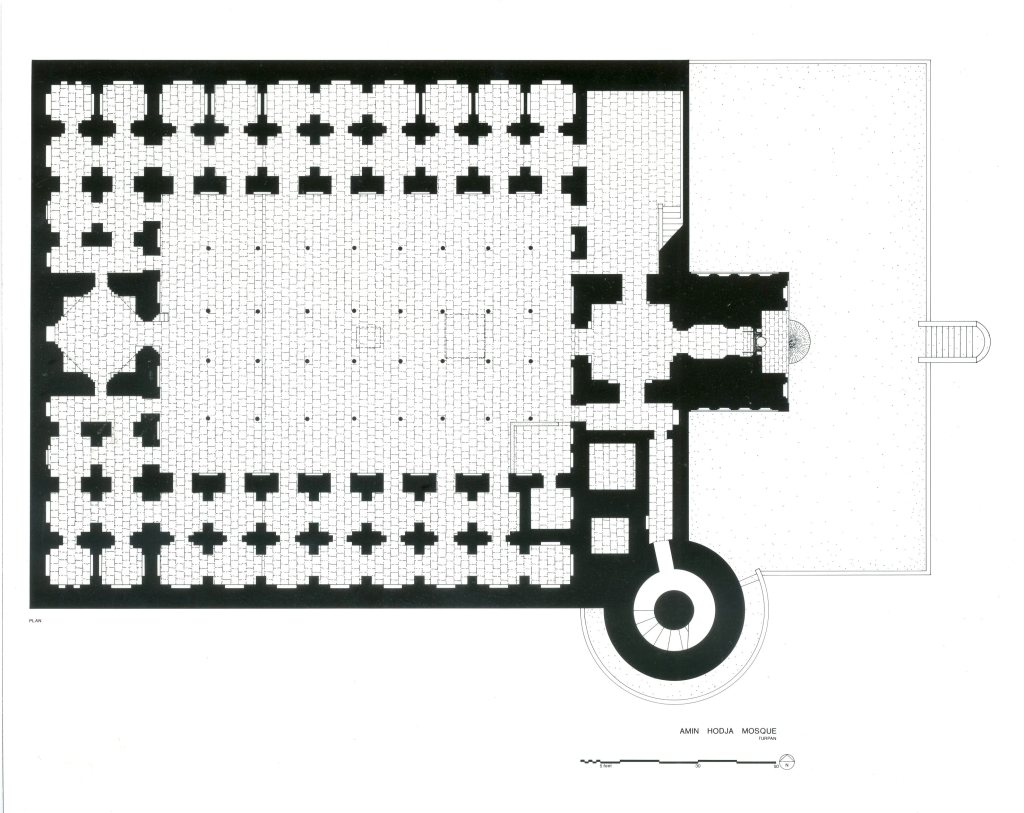
The monumental mosque of Turpan was the Amin Hodja Mosque built in 1776 and sited at the edge of town. The main body of the building is plastered brick while the 144-foot tower is exposed fired brick in a design typical of towers still to be found in Iran and Transoxiana. An interesting feature of this example is that it serves three purposes simultaneously. First, it can be used as a minaret from the top of which a muezzin would call the faithful to prayer; second, it is a tomb-tower marking the location of the tombs of its patron and his father at the base; and third, it may have been used as a lighthouse, since even a small fire at its top could have guided caravans to the oasis from many miles away. The main building also had a dual purpose. The size of its central hall suggests that it once accommodated a large congregation of worshipers while the surrounding cubic cells were used as a madrassa, or a koranic school, with boys to the right side and girls to the left. Curiously, the plan, with ranks of double cells surrounding an open center, is virtually the same as that for a typical caravanserai, which was a medieval fortified hostel for traveling merchants. A merchant would marshal his animals in a central, unroofed space and set up temporary housekeeping in one of the pair of peripheral cells – his baggage in the outside cell and his sleeping space facing the center space. Long ago, these hostels appeared at intervals of a one-day march along the entire Silk Road. Though this building was definitely intended as a mosque from its inception, it is interesting to see in the Islamic tradition how a particular plan type could accommodate different functions, in this case both religious and commercial. Though this beautiful building has not been destroyed, it was stripped of its religious function and insensitively “restored” to serve as a theme park requiring tourists to pay admission.
As we can readily see, the vernacular architecture of Turpan functioned as the physical armature of Uighur culture and a clear indicator of a durable, transparent social structure. The destruction of this architecture meant the fatal weakening of traditional social relations and finally the destruction society as a whole. It is clearly apparent that this was understood by the Chinese government as a means to eradicate the Uighur as a distinct ethnic group and institute a total surveillance state in Xinjiang province. In addition to other methods of control, destruction of mosques was critical to the suppression of Islam. Also, the systematic destruction the Uighur house, which served as the basic building block of urban civic life in Turpan, resulted in the destruction of the family unit, weakening the extended family, neighborhoods and broader communal relations.

In the ruins of traditional neighborhoods, tall, impersonal concrete structures now rise, with hot, airless cells dependent on fossil fuels for ventilation and lighting. This act of ethnic cleansing eliminated the ability of the Uighur of Turpan to decide for themselves how to live by stripping them of their freedom to build. The result is the atomization of a community, reducing it to no more than alienated individuals, susceptible to manipulation and indoctrination and entirely reliant upon an alien regime that compels them to be obedient above all.

Last week Emeritus Professor Don Hanlon was the Academic Adventurers speaker at the AGS Library. The title of his talk “The Case of Turpan, China: How to Destroy a Culture” highlighted the village of Turpan and what has happened to it over the decades. He wrote this article as a guest blogger.
To view more of the nearly 300 photographs and sketches that Donald Hanlon recently donated to the AGS Library, visit the AGSL Digital Photograph Collection.
Fair and Square: A Short History of World’s Fairs
By Lauren Maddox

Unisphere Sculpture from 1964 New York World’s Fair, Taken by Harold Mayer. Click the link to see this photo in our Digital Collections!
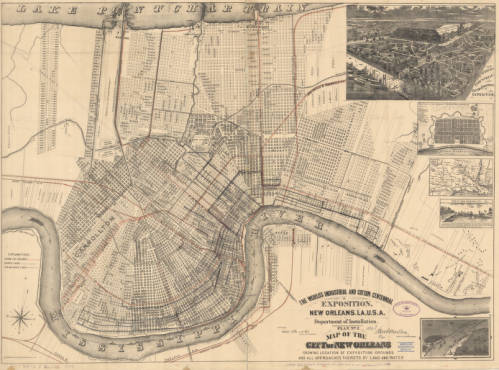
1884 Map of New Orleans’ Exposition Grounds. Click the link to see this map in our Digital Collections!
In 1984, Louisiana hosted a World’s Fair celebrating “The World of Rivers.” It was the last World’s Fair in the U.S. And it was the most financially disastrous fair in the history of World’s Fairs. To be fair, the point of hosting World’s Fairs and Expositions was never to make money– most host countries had to shell out exorbitant amounts of money to finance their fairs. But the point of the World’s Fair was never to make money; instead, these fairs were celebrations of progress and a chance to impress the international community. Host countries never expect to make a profit off of the Fair, but the 1984 Fair was particularly draining– it was the only Fair to ever go bankrupt.
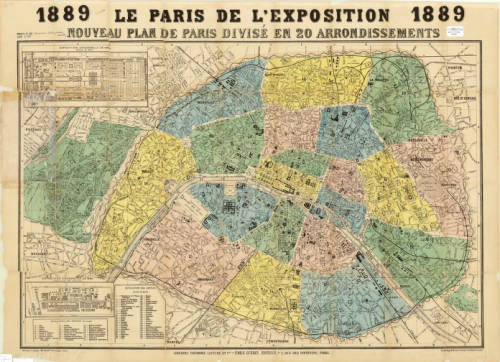
Map of Paris for the 1889 Exposition. Click the link to see this map in our Digital Collections!
But before the 1984 fair, the U.S. had a rich history as a member of the International Bureau of Exhibitions– they’ve hosted 30 World’s Fairs since their first in 1829. And before that?
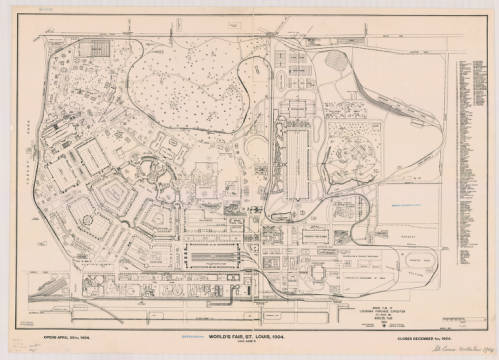
Ground Plan of Louisiana Purchase Exposition, 1904. Click the link to see this map in our Digital Collections!
The tradition of the World’s Fair is based heavily on French national expositions– but the first was actually hosted in Prague in 1791. This exposition was before World’s Fairs were standardized and regulated by the Bureau of International Expositions. These early expositions had their roots in Medieval festivals, and quickly became a way for post-revolution France to unite their new republic. The industry-focused expos continued under Napoleon but still focused on French products.
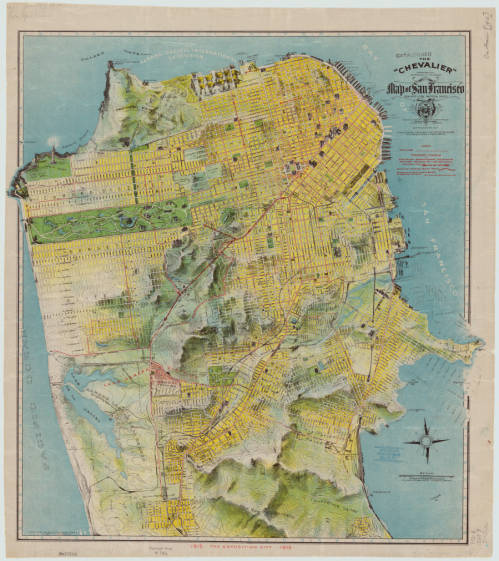
1912 Chevalier Map of San Francisco featuring the Panama-Pacific International Exposition grounds. Click the link to see this map in our Digital Collections!
The exposition most commonly cited as the first international affair is London’s Great Exposition in 1851. This World’s Fair was iconic– its great Crystal Palace became the symbol of World’s Fairs for years to come and continues to be one of the most quintessential Victorian structures.
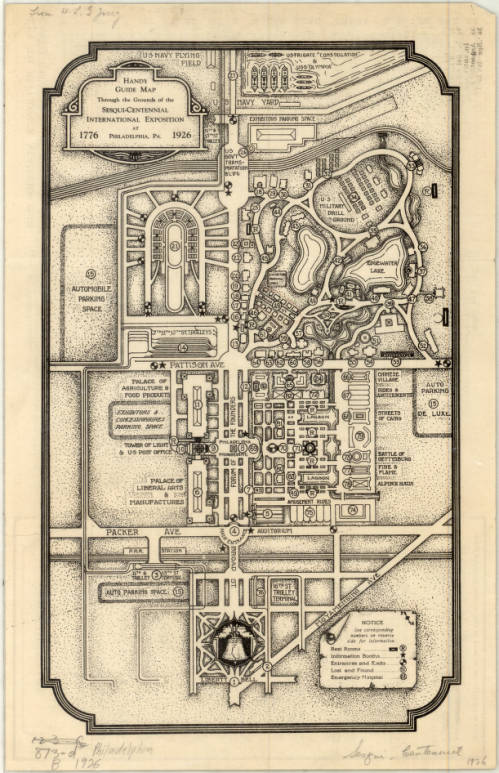
Complimentary Map of the Sesqui-Centennial International Exposition at Philadelphia, PA, 1926. Click the link to see this map in our Digital Collections! 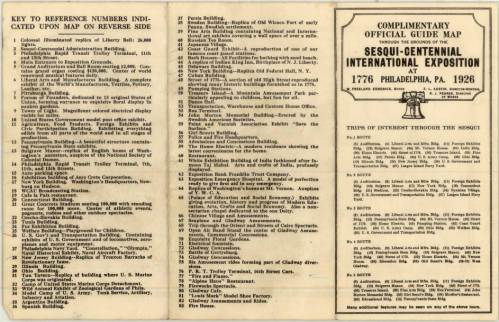
Points of Interest at the Sesqui-Centennial International Exposition at Philadelphia. Click the link to see this map in our Digital Collections!
In 1928, the Bureau of International Expositions (Bureau international des expositions) was established in order to oversee and approve of expo arrangements internationally and to set standards for expositions across nations. 170 countries are currently members of the BIE– including the United States. The BIE has remained in charge of international expositions ever since.
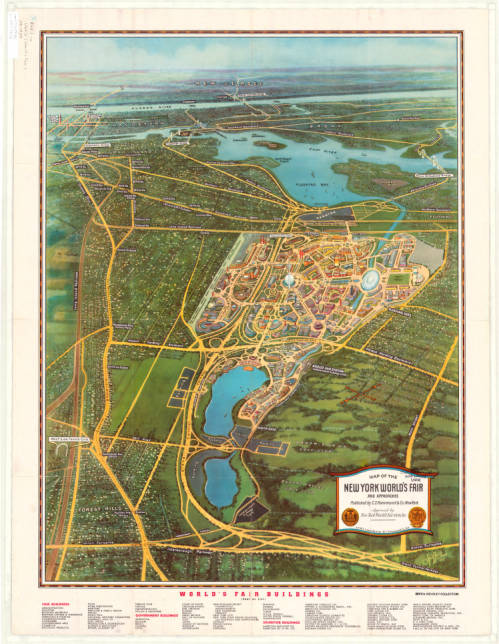
Map of the New York World’s Fair with Map of Greater New York’s Transit, 1939. Click the link to see this map in our Digital Collections! 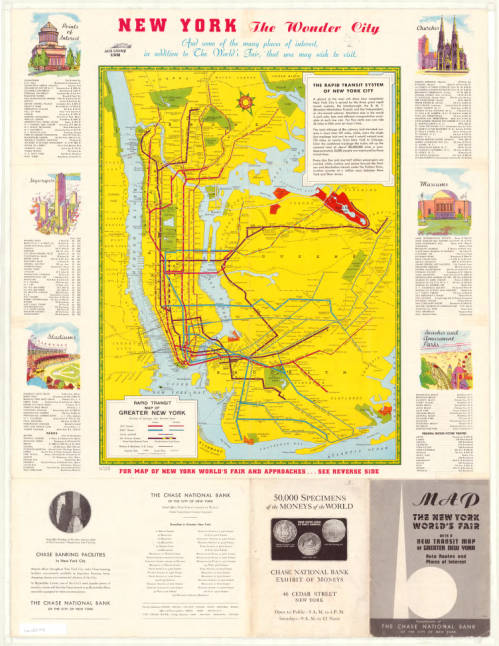
Map of New York Transit System with Points of Interest in the City, 1939. Click the link to see this map in our Digital Collections!
The nature of World’s Fairs have changed drastically since their Medieval beginnings– these fairs began as a way to unite communities, national and international, and then became an opportunity for countries to showcase their industrial prowess and establish themselves on the global stage.
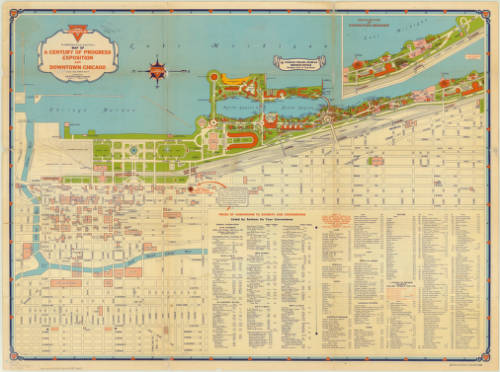
Map of Chicago’s 1933 World’s Fair. Click the link to see this map in our Digital Collections! 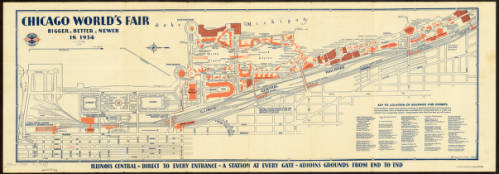
Map of Chicago’s 1934 World’s Fair. Click the link to see this map in our Digital Collections!
The 1984 exposition signaled the end of an era for World’s Fairs. It wasn’t just the last Fair to be hosted on American soil– it was also one of the first environmentally focused specialized expos. No longer are World’s Fairs an opportunity to flex wealth and status; instead, new expos are interested in environmentalism, building a sustainable future, and the building of a more united global community.
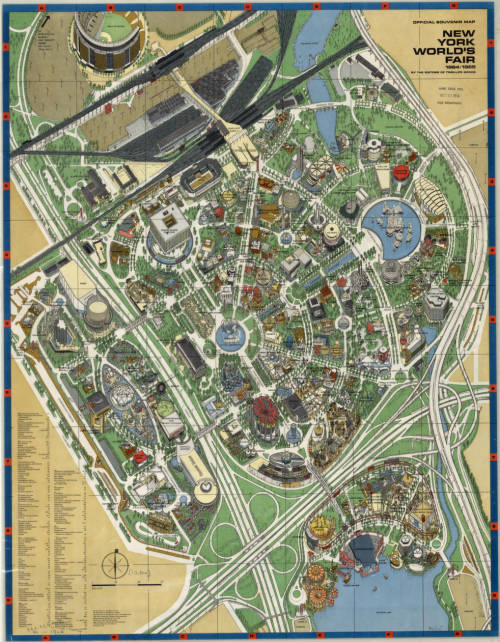
Map of New York’s 1964 World’s Fair. Click the link to see this map in our Digital Collections!
The United States withdrew membership from the BIE in 2002, but in 2017 rejoined. And maybe, in the near future, we can expect another Fair, as part of America’s long legacy of World’s Fairs, looking forward into a bright future.
Hispanic Heritage Month: A Special Pop-Up Exhibit
By Lauren Maddox
This past Sunday marked the beginning of National Hispanic Heritage Month. This month is a celebration of Hispanic Americans who, according to the National Hispanic Heritage Month website, “have positively influenced and enriched our nation and society.” The tradition of a National Hispanic Heritage Month began in 1968, when Representative Edward R. Roybal sponsored legislation that would establish a National Hispanic Heritage Week. The holiday week was signed into effect under Lyndon B. Johnson and then expanded to a month-long period during Reagan’s presidency in 1988. The original start date, September 15th, was chosen to celebrate the official independence days of Costa Rica, El Salvador, Guatemala, Honduras, and Nicaragua declared in 1821. The original week also encompassed Mexico, Belize, and Chile’s independence days. Now the month-long observance, celebrated from September 15th-October 15th, includes all of these days as well as Dia de la Raza.
In honor of National Hispanic Heritage Month, many organizations including the Library of Congress, the National Gallery of Art, the Smithsonian, and the National Park Service are hosting events throughout September and October. Throughout the month, there will be a Community Day, a Hispanic Heritage Month Concert with Inca Son, a book talk with Haitian-American writer Edwidge Danticat, and a Wikipedia Edit-a-thon and more. And in addition to the live events, many digital archive collections are being made public this month– the National Hispanic Heritage Month website includes a list of all related exhibits and collections here. Some highlights from this list: the Library of Congress’s Archive of Hispanic Literature on Tape, Documents of 20th Century Latin American and Latino Art supported and hosted by the National Endowment for the Humanities, and many, many others.
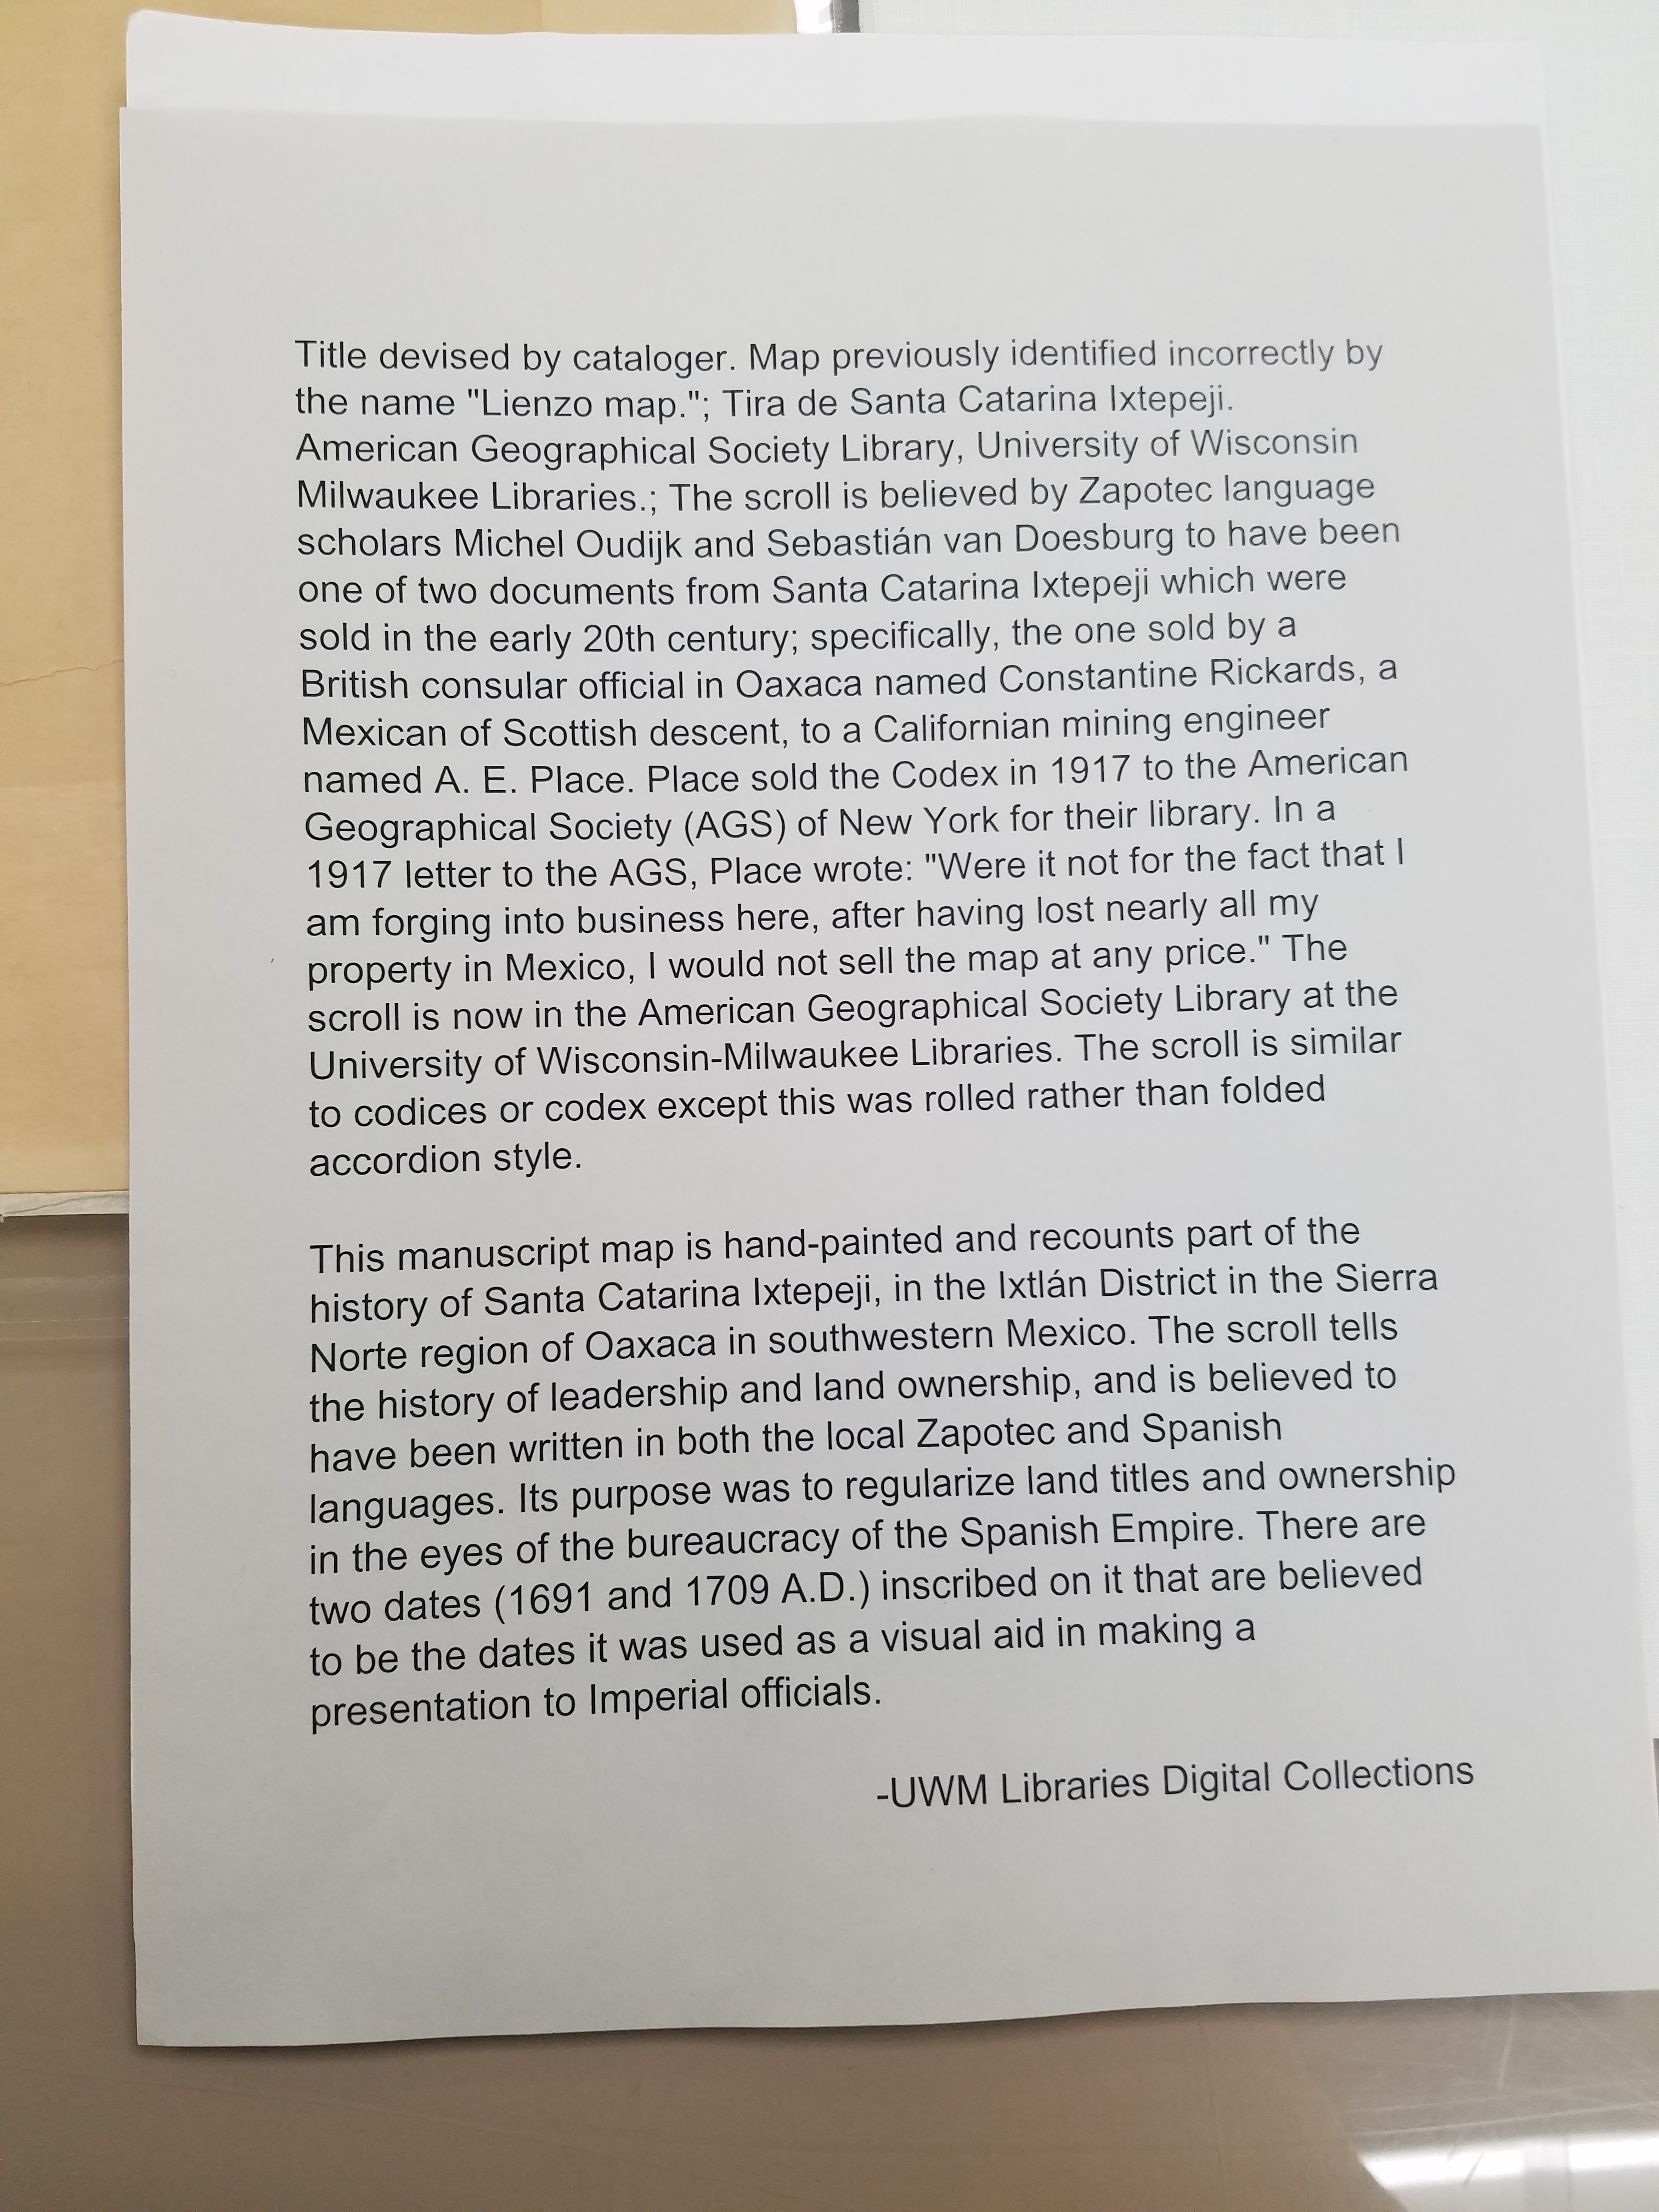
But these aren’t the only ways to celebrate National Hispanic Heritage Month! This week from September 25-27th, the AGSL and UWM Archives are collaborating on a pop-up exhibit featuring curated pieces from both libraries’ collections. The exhibit will span both of our libraries: materials from the Archives will be on display on the second floor and maps from our collections will be exhibited in the AGSL. We are especially excited to showcase the Tira de Santa Catarina Ixtepeji scroll. Please, come celebrate this historic month with us! And enjoy a preview of some of the maps included in the exhibit:
Map of San Juan Ulua Island in 1628. Fascimile of 1468 World Map, previously owned by the Hispanic Society of America. Map of Acapulco in 1628. “The Routes of the Flying Clipper Ships,” 1930s. Click the links to see these maps in our Digital Collections!
The AGSL is open from 8:30-4:30 Monday-Friday! We will also be participating in Milwaukee Open Doors this weekend on September 28th from 10-5! Please stop by and see us!
The New Northwest Passage: Tourism through the Arctic
By Lauren Maddox
At the beginning of the summer, I did a series of posts discussing some of the AGSL’s connections to Arctic exploration and the famous explorers of that age (or, more accurately, the scandalous love lives of those explorers). But the Northwest Passage is still a part of the public’s romantic imagination– it’s a largely untraversable and unexplored wild full of cold beauty. And the fact that a Northwest Passage has been a geographical mystery for so many generations of Western explorers doesn’t hurt. As shrinking sea ice opens new routes through the storied Northwest Passage, more and more ships are passing through. Shipping freights are taking advantage of the new possible alternative to the Panama Canal for pan-oceanic travel– but in 2016, the first cruise ship passed through the Northwest Passage on a 28-day cruise through the Arctic.
The Northwest Passage has been the subject of years of conjecture and speculation for European travelers–there is even some evidence that Vikings traveled to the Arctic and traded with indigenous peoples before the Little Ice Age. Early attempts to discover a true Northwest Passage were spearheaded the English; Henry VII sent John Cabot on a search for a direct route to Asia that could be used for more open trading in 1497. Several later explorers followed suit: Estaban Gomez in 1524, Martin Frobisher in 1576, Humphrey Gilbert in 1583, and on and on into the next two centuries.
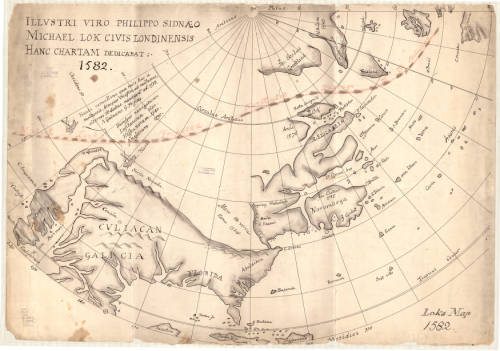
Explorers were also interested in finding alternative entry routes into the Passage– if they couldn’t traverse the Northwest Passage in its entirety, then maybe they could find another way onto the path. In 1539, Francisco De Ulloa embarked on an expedition to sail around the Baja California Peninsula– you might remember this from my July post about the island of California. Besides confirming the fact that California is indeed an island (just kidding), Ulloa also believed that the strait between California and the mainland would lead to an accessible Northwest Passage.
1776 Illustrative Map of the a proposed Northwest Passage through the Hudson Bay. Click the link to see this map in our digital collections! 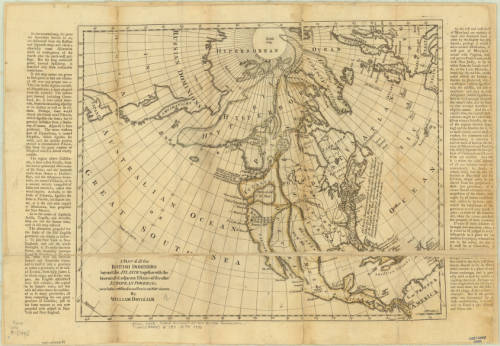
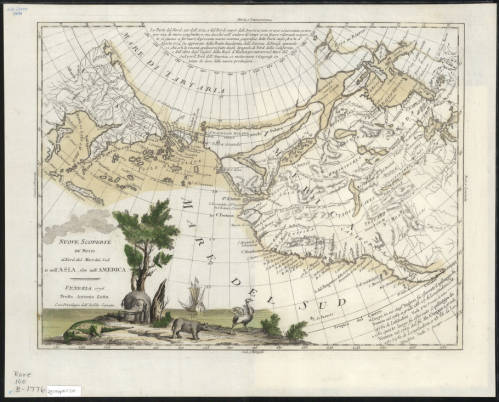
1770 Map of the Arctic, including a possible Northwest Passage. Click the link to see this map in our digital collections!
Many of these expeditions ended in tragedy– the truth was, at the time, there was no reliable pathway through the ice for ships to take. Routes that might be clear in one season would be completely frozen in another. Ships would often become stuck in the ice and forced to winter over where they were or abandon ship. In the 19th century, another rush of Arctic exploration swept Europe and the United States. In an earlier post, I go into some detail about the lost Franklin expedition and the scramble to discover their fate. This was one tragic ending of many expeditions– even Elisha Kent Kane’s rescue expedition in search of Franklin ended in a narrow escape from the deadly winter after which Kane’s health never recovered. Many thought that a purely ship-based expedition would never be possible; John Rae, the man who discovered the true fate of Franklin and his men, made many overland expeditions exploring the continent by using techniques already honed by native peoples who had managed to live there since, well, before the Vikings came to trade with them.
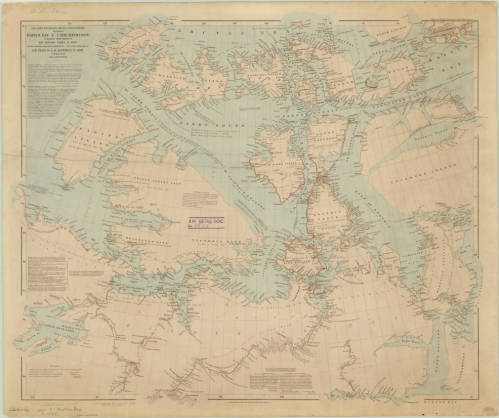
1860 Map of the Arctic Region. Click the link to see this map in our digital collection!
The Northwest Passage would prove impenetrable by ship until 1906, when Roald Amundsen and his six-person crew made a three-year journey through the icy waters in a tiny herring boat. His route through the Rae Strait was full of fairly young ice that was navigable and breakable, but the waters were shallow and only a small boat like the Gjøa could have made the trip.
As time passed and our climate has changed, the sea ice that prevented so many travelers from passing through the Northwest Passage has been shrinking. The Earth’s poles are more susceptible to the effects of climate change, and so the Arctic is warming at a faster rate than the rest of the world. The sea ice normally freezes and melts throughout the year, but the maximum coverage of the ice in winter has been shrinking at an alarming rate. This has some pretty huge implications for the state of our world, but has also led to an uptick in arctic tourism.
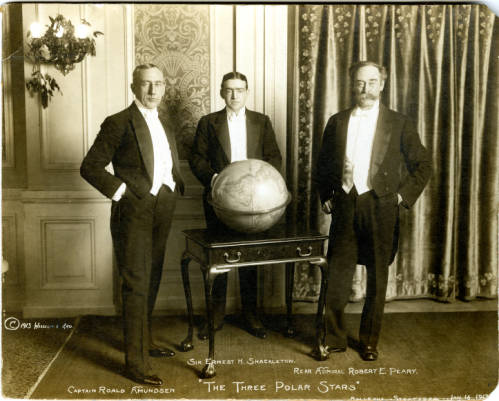
“The Three Polar Stars”: Photo of Amundsen, Shackleton, and Peary. Click the link to see this photo in our digital collection! 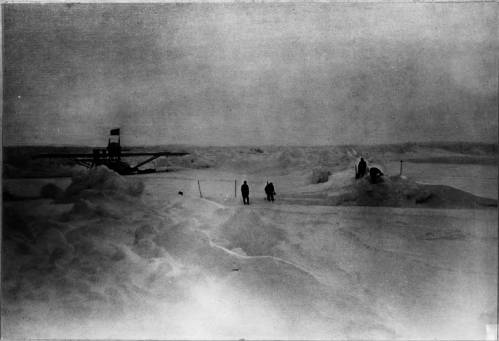
Amundsen’s 1925 Expedition with Ellsworth. Click the link to see this photo in our digital collections!
Because of the melting sea ice, larger boats can pass through the Northwest Passage. During the most recent Arthur Holzeimer Lecture at the AGSL, speaker Lauren Beck commented that, for the first time in history, the Northwest Passage of European imagination has become reality. Only because of the quickly degrading sea ice is the Northwest Passage actually a traversable ship passage.
Amundsen’s successful trip through the Northwest Passage did not turn it into an icy thoroughfare– the ice was still too much of a problem for large cargo ships and the water often dangerously shallow. In 2012, two astonishing events happened: arctic sea ice hit record lows, and ship passage through the Northwest Passage hit record highs. The Panama-Canal was still the better, more consistent choice for trans-ocean shipments, but the new open waterways inspired a different kind of ship-traffic.
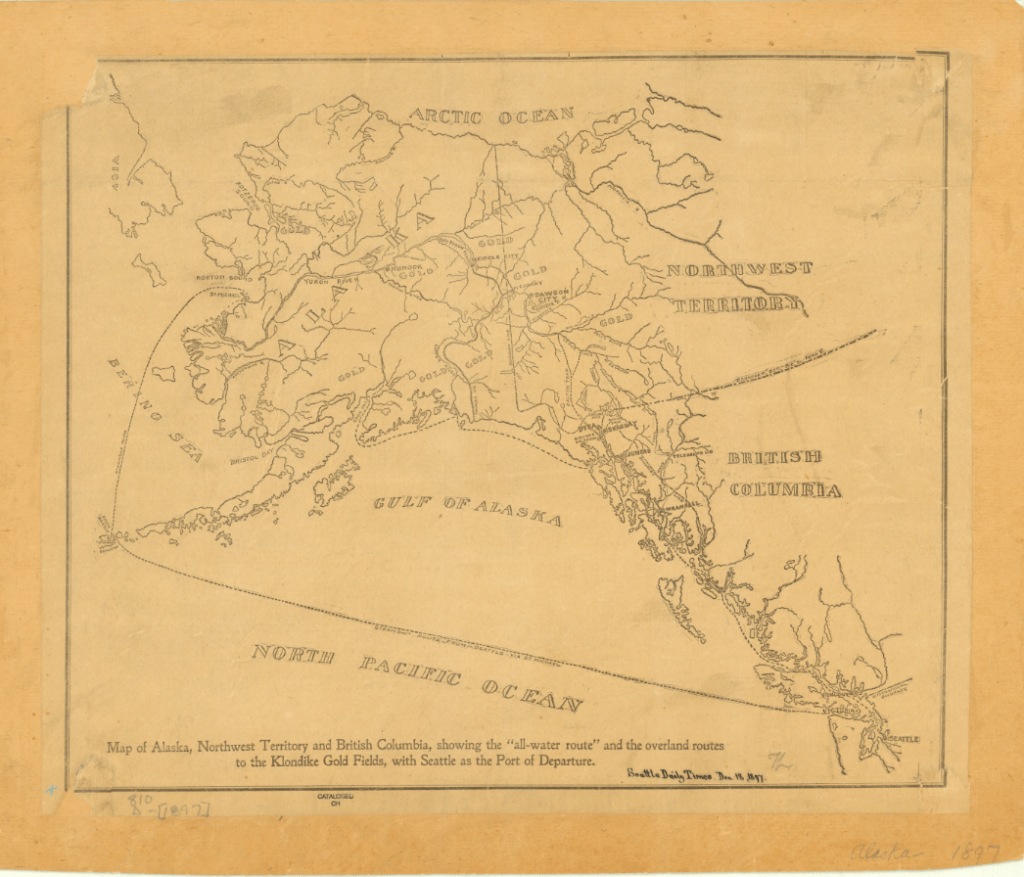
1897 Map of Alaska, Northwest Territory and British Columbia. Click the link to see this in our digital collections!
In 2016, the Crystal Serenity made an unprecedented voyage through the Northwest Passage; though not the first, it was the largest cruise ship to ever pass through the Northwest Passage. The cruise ship had to be escorted by a Polar-Grade ship that could break the ice for the cruise ship to pass though– or perform a rescue. While Crystal Cruises proudly took the Serenity through the Northwest Passage on multiple voyages for “true explore[s]” and is expecting the delivery of a Polar-Grade ship for more cruises, there is some concern about what tourism in the Arctic really means.
For one thing, the communities living there don’t have the infrastructure to deal with the influx of people and garbage. Townships are overwhelmed even by limited groups of tourists visiting. And the effect that human interference has on local flora and fauna– never mind the impending catastrophic oil or fuel spill that seems inevitable with increased traffic– can have deadly consequences for local indigenous communities.
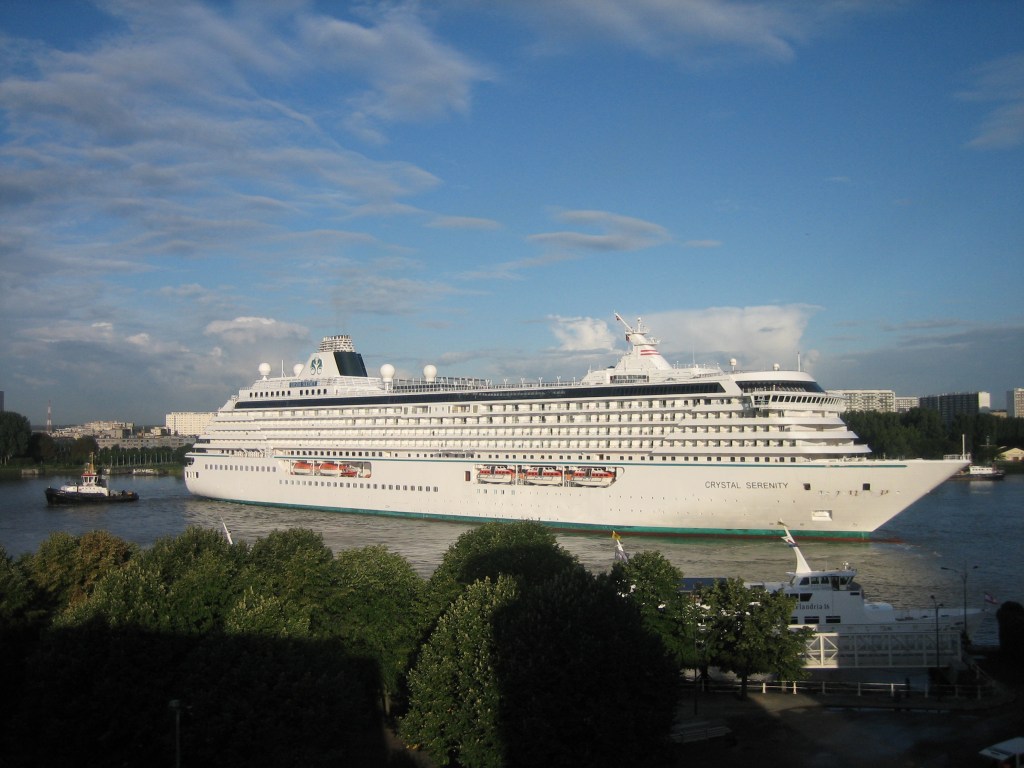
Photo of the Crystal Serenity in Antwerp
For many people, Arctic tourism is a “last-chance” to see an environment that might be on the brink of destruction. And while it is true that experiencing the Arctic has inspired many to defend it from climate destruction, the increased number of ships creates an increased risk of disaster for the environment, the people who live there, and even the tourists themselves. But ignoring the real possibility of climate disaster (or a shipwreck stranding hundreds of tourists on the Arctic Ocean), Arctic tourism also has a troubling philosophical component. Last-chance tourism forces us to think about the destruction of our natural world and how we want to face it. Do we want to put it at potential risk for the chance that tourists become potential activists? Or do we protect it from commercial interference as long as possible?
The answers to these questions are unclear, but as the Arctic tourism industry grows, the search for answers becomes more urgent.
Shelf Read Week
By Lauren Maddox
Thank you all for your patience during our brief hiatus last month! The AGSL has been preparing for the start of the new school year, which included a collection-wide shelf read. The shelf read will actually be an on-going project; each staff member will spend an hour a week continuing to read their section. But last week we came together as a staff to try and tackle the bulk of the work before students came back to campus for the Fall semester.
Most of my time at the AGSL this summer has been spent at my desk. Before I started writing for the AGSL, I had pretty much no experience working in libraries. Well, I was technically a library assistant at my high school, but that just meant I spent every morning reading in the library. So, I was pretty excited to get on board with the rest of the staff and do some real down-and-dirty library work.
Conclusions: I escaped with 0 paper cuts and the knowledge that it’s very hard for me to count past 64. But I thought that this would be a great opportunity for our readers to get an inside look at some of the behind the scenes work our staff does to make sure our library is as accessible and useful to our patrons as possible!
I was assigned sections 050-b and 200-b through c, which included the entire Carta Topagraphia. This was the point at which I realized I couldn’t count past 64, by the way– almost every map folder in this collection had close to 100 maps in it.
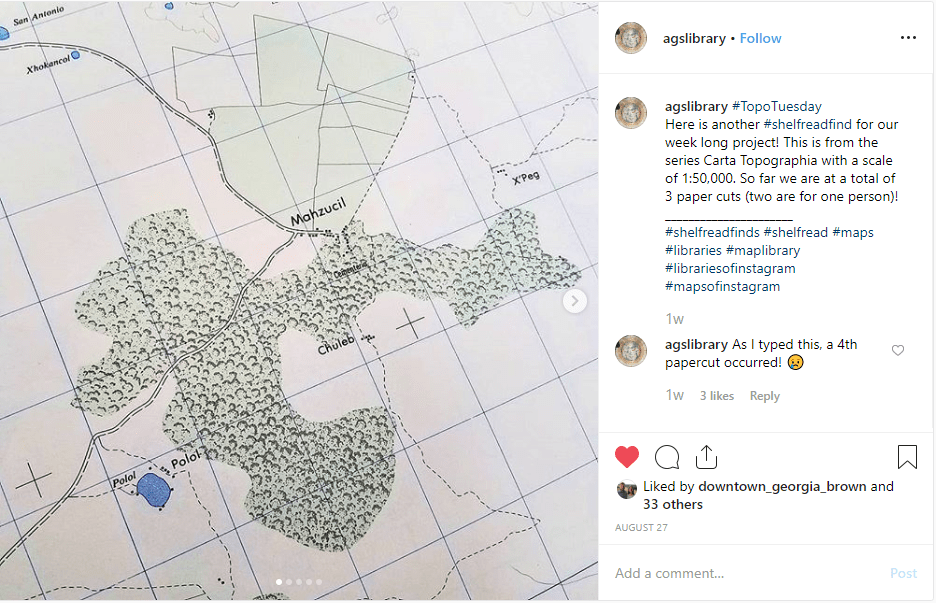
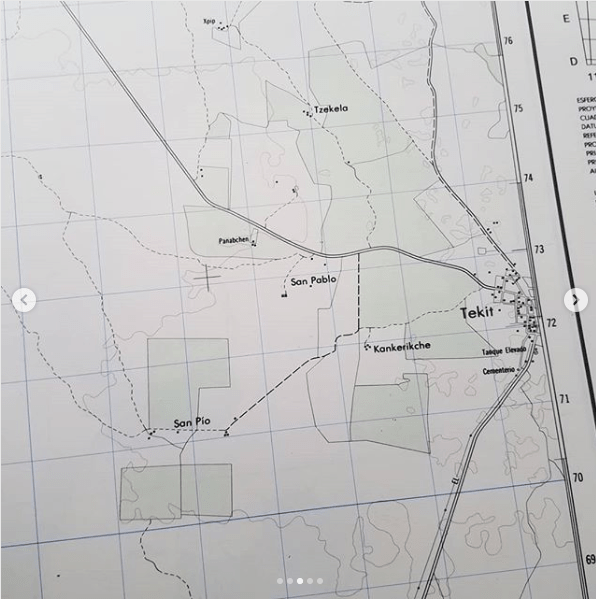
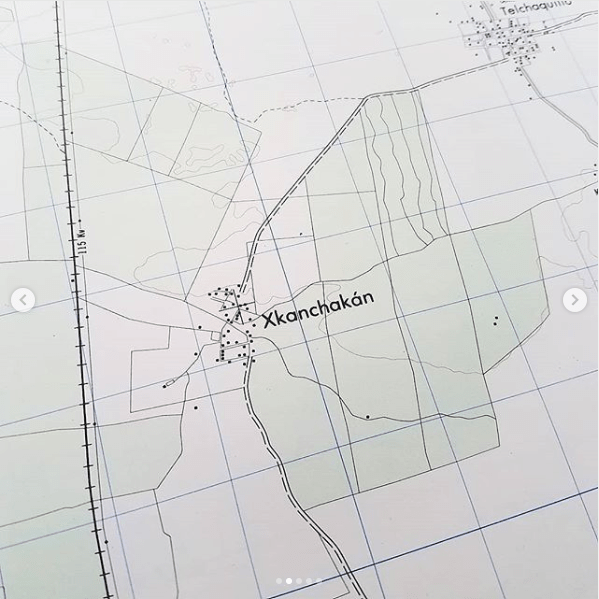
For this shelf-read, there were a few specific tasks we wanted to take care of specifically. First, we counted the maps in each folder; those individual counts were combined into a cumulative total. The shelf-read put into perspective just how many items are in the AGSL’s collections– I counted a couple thousand all by myself! Which was not the highest score. Our cumulative total of maps counted that week was 46, 709. And we’ve only just begun! Then, it was important to make sure that the maps that were in each folder were supposed to be there and in the right order. And we also worked on relabeling folders for ease-of-access for the future. And we stayed on the lookout for interesting maps that hadn’t been scanned yet to add to our digital collection or maps that hadn’t been cataloged officially. To keep spirits bright (because, no matter how necessary, counting map sheets is never going to be anyone’s favorite pastime) we also had a game of Shelf-Read Bingo going all week. I came in second place.
If, when you visit us during the semester, you notice that someone is shelf-reading, know that you’re witnessing a large-scale, on-going project that our whole staff is working on! And maybe let them finish counting– or else they might get stuck at 64 and have to start over.
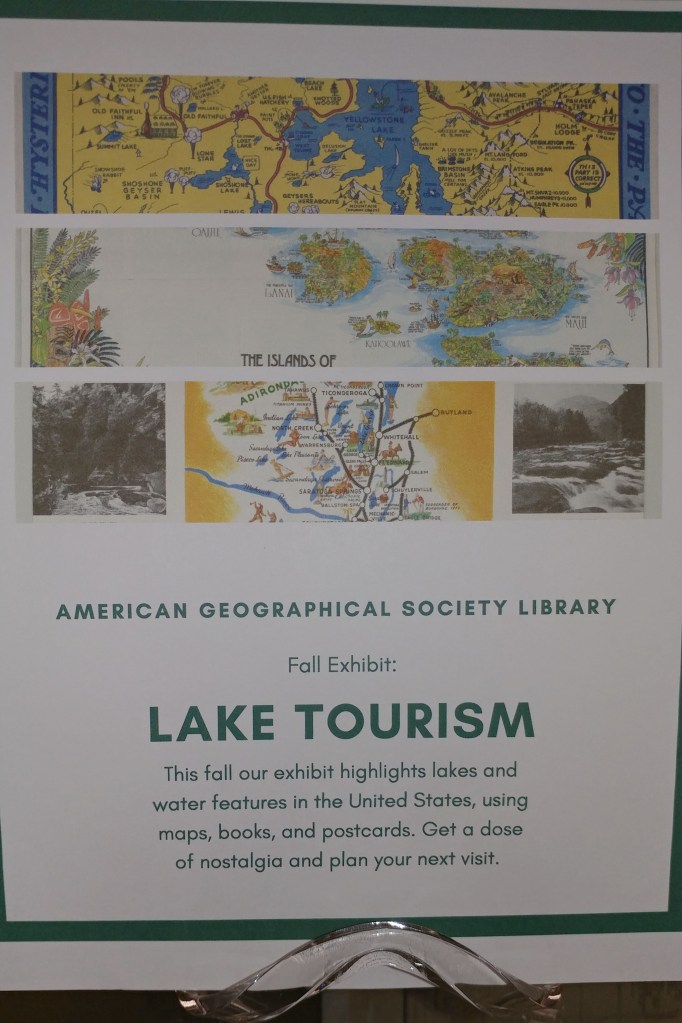
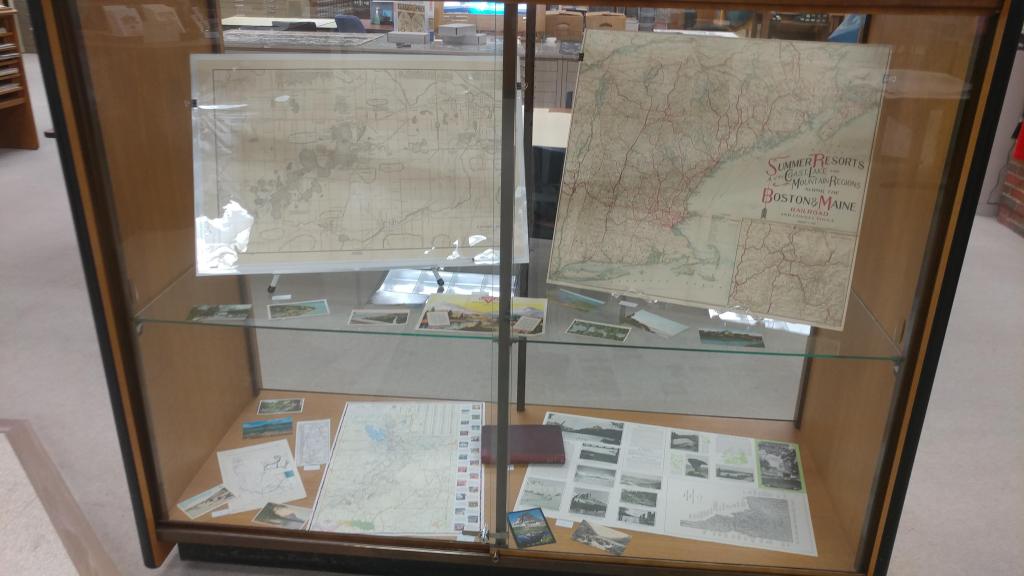
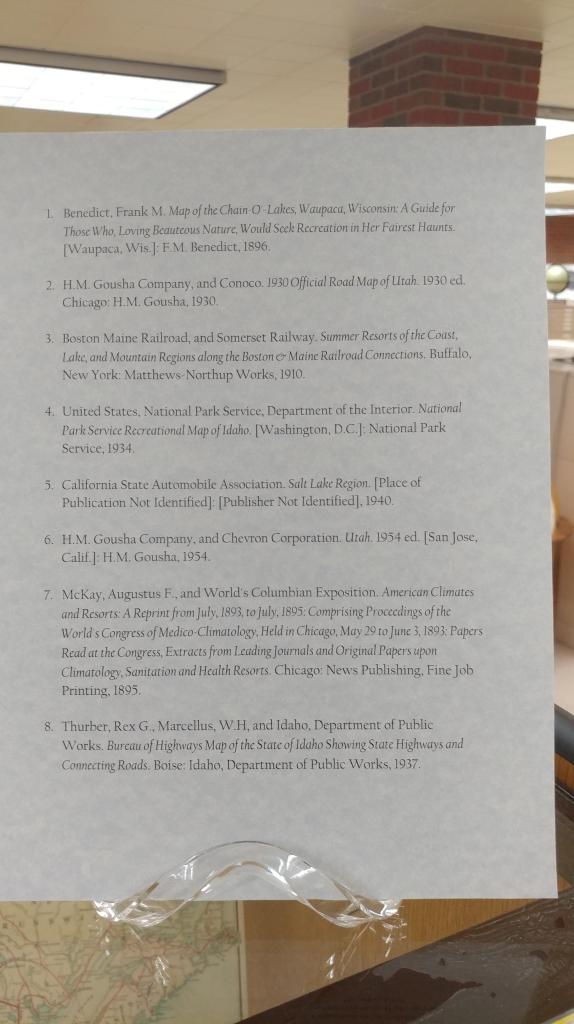
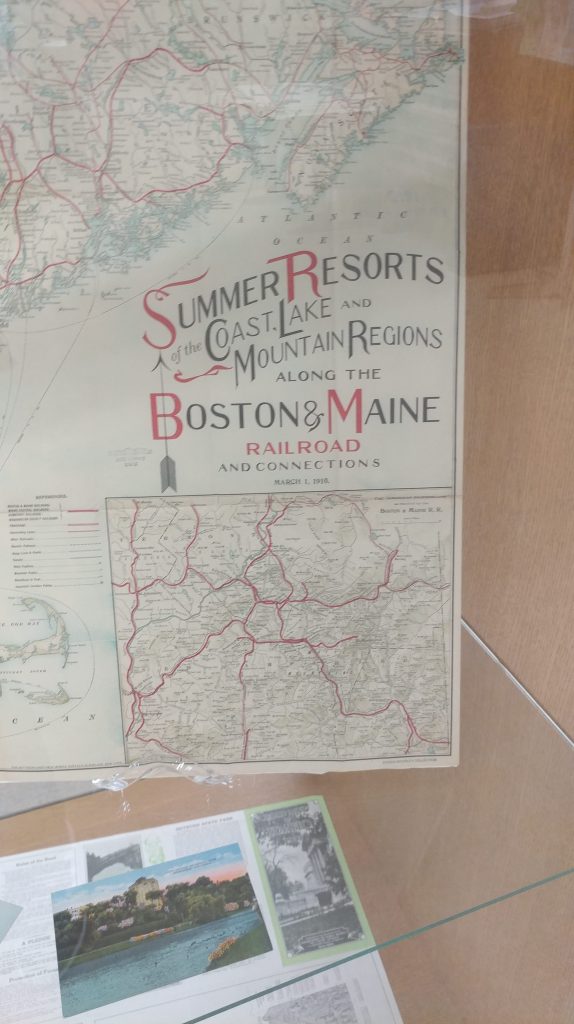
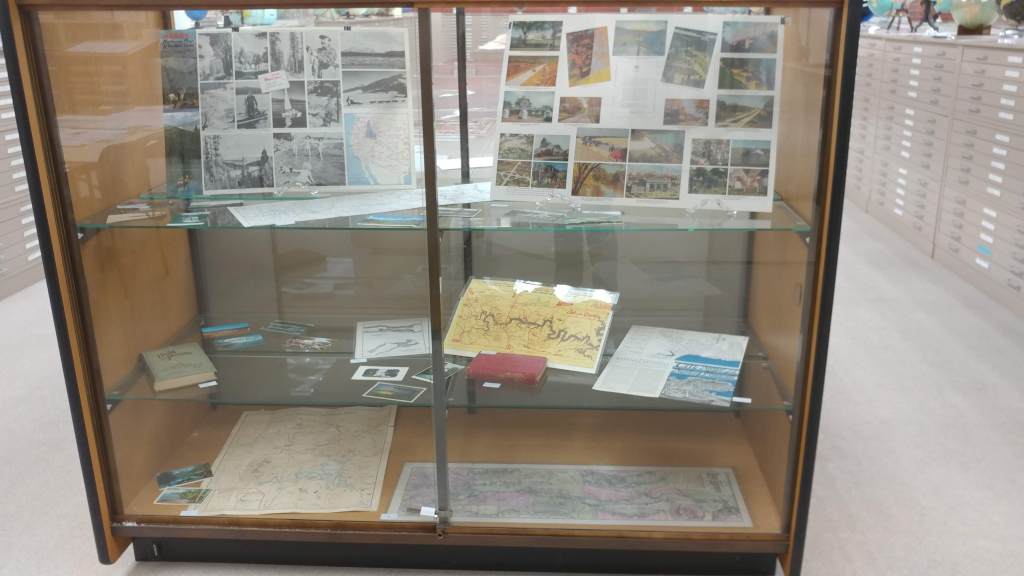
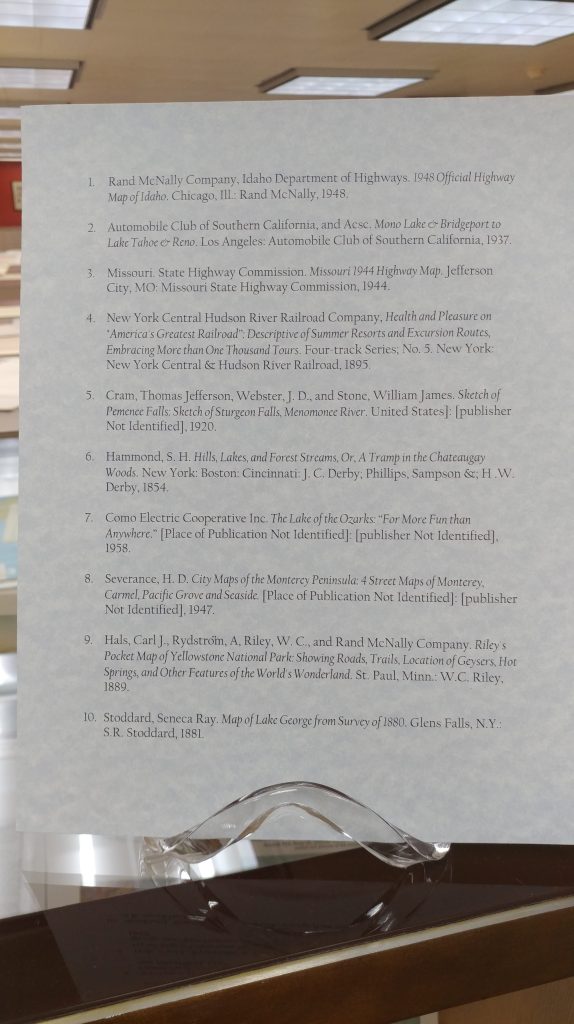
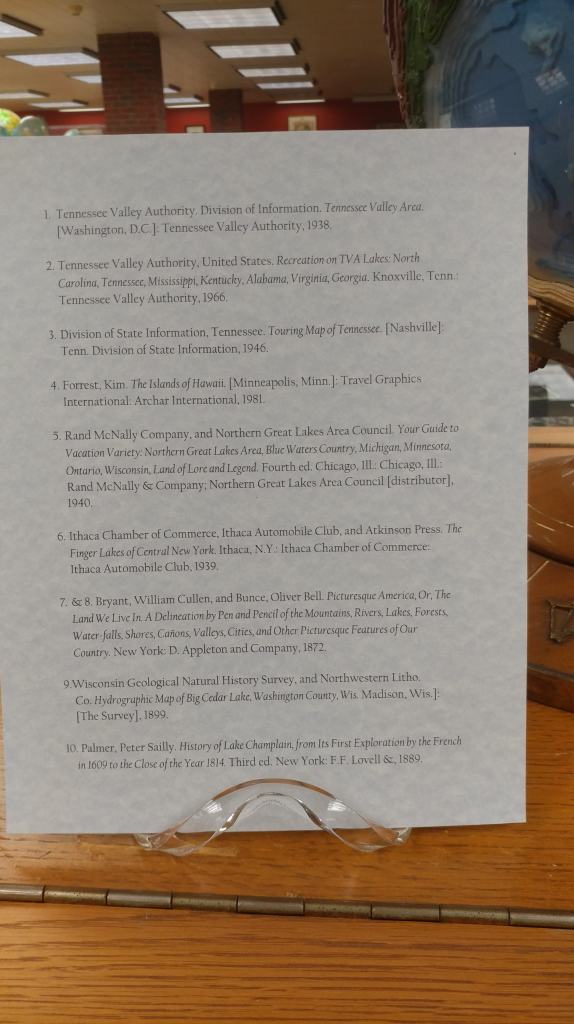
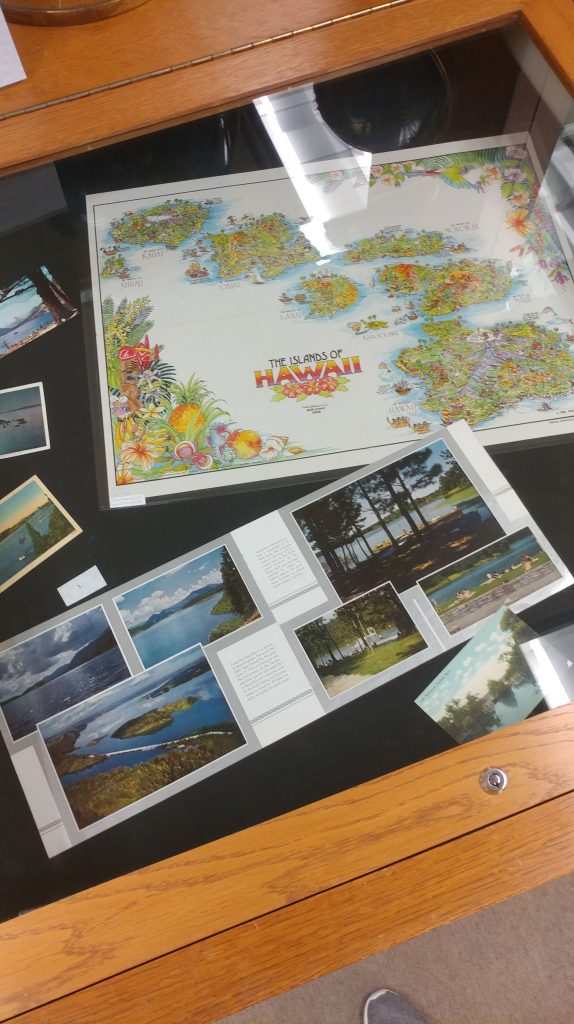
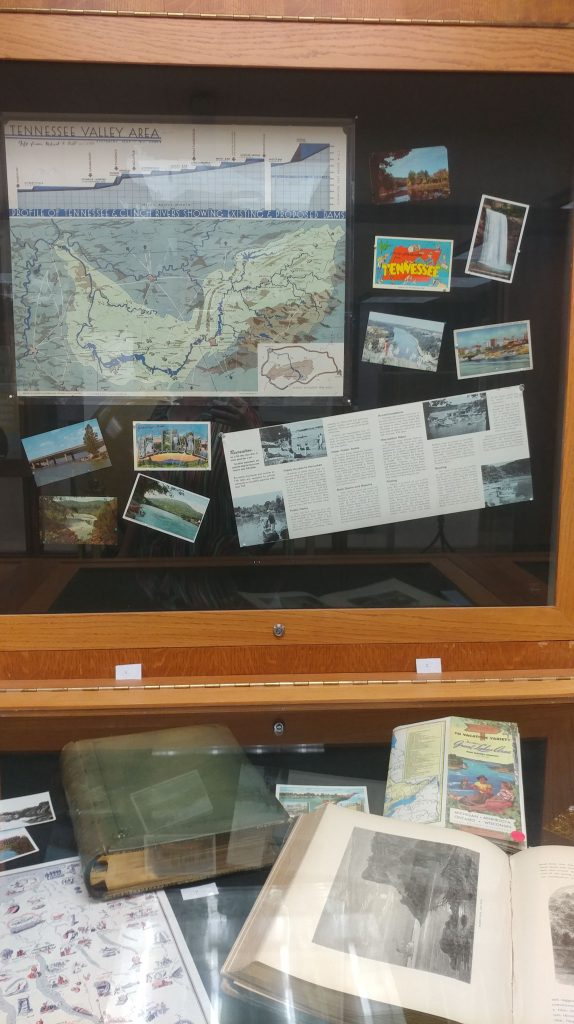
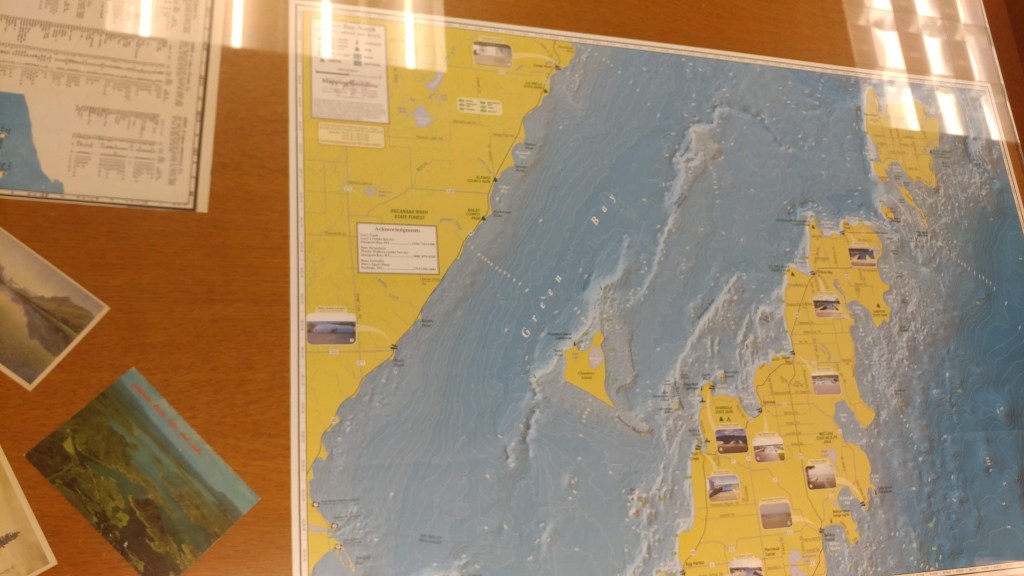
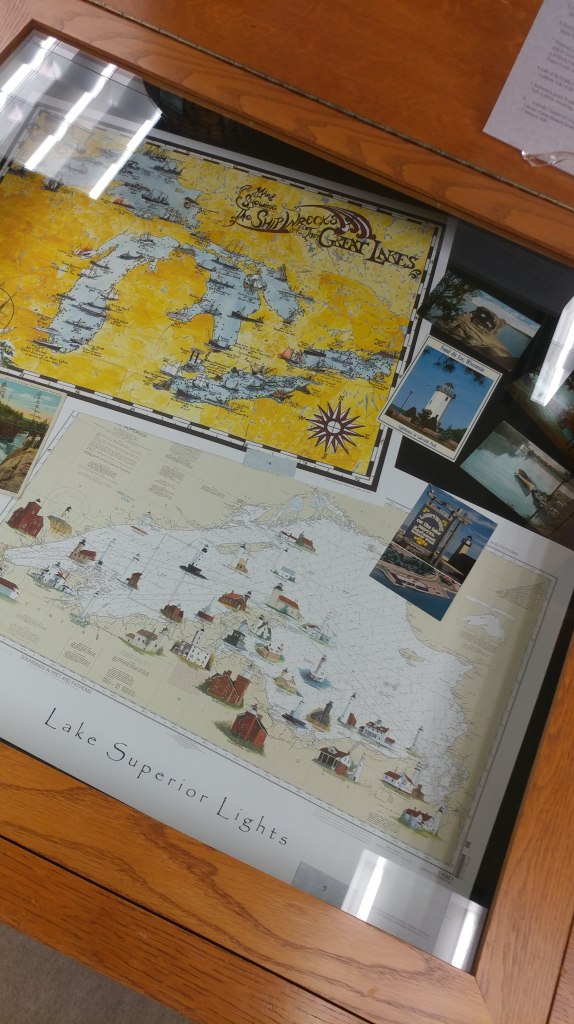
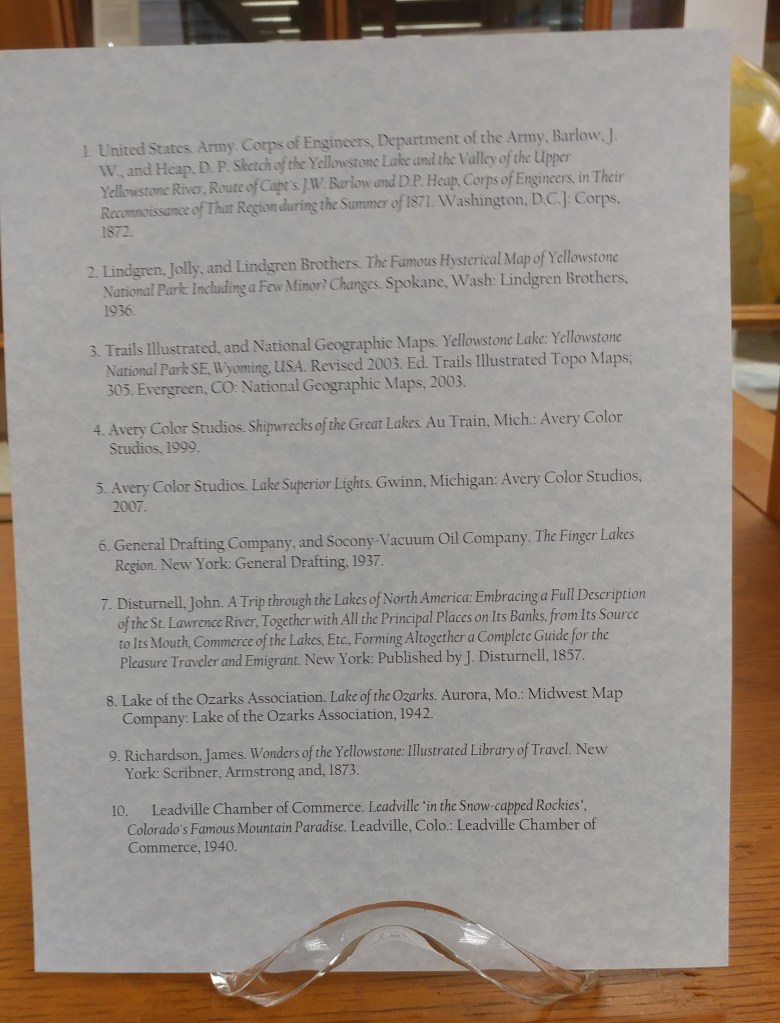
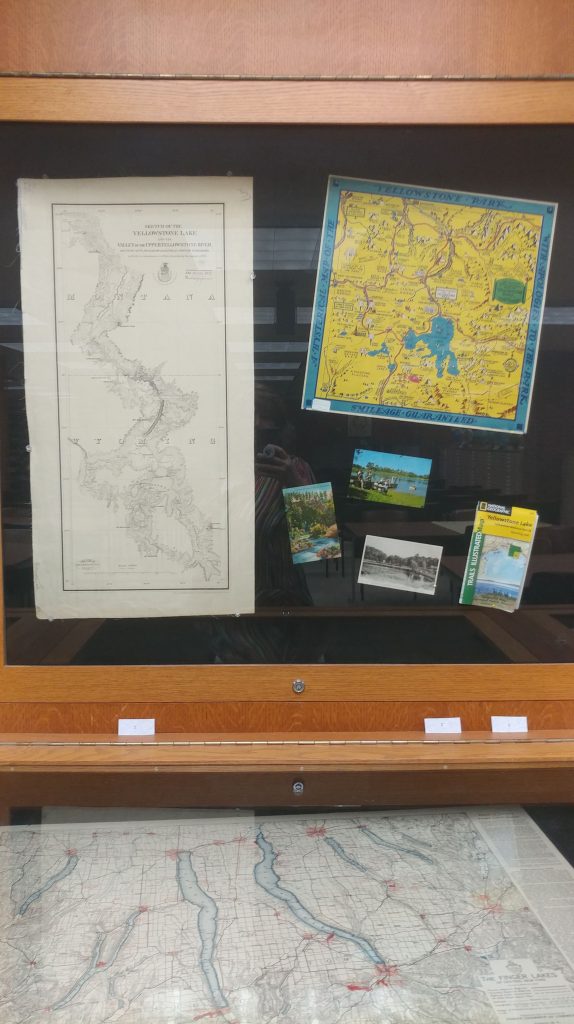
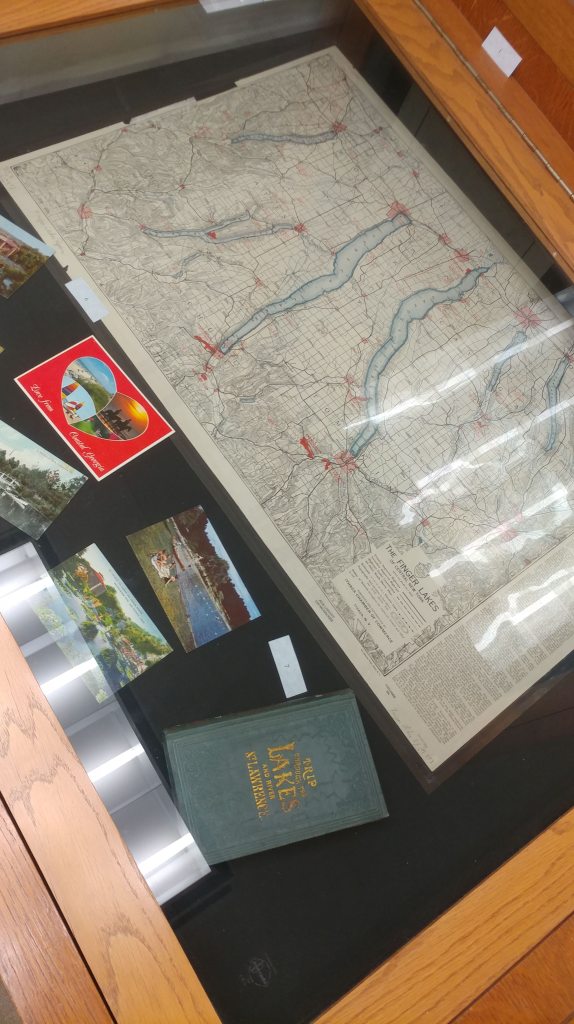
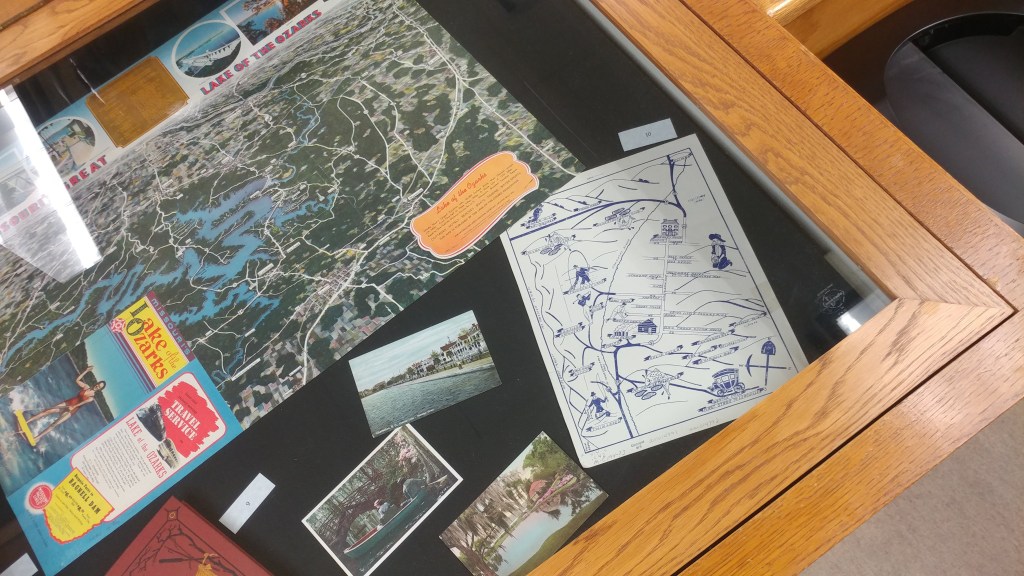
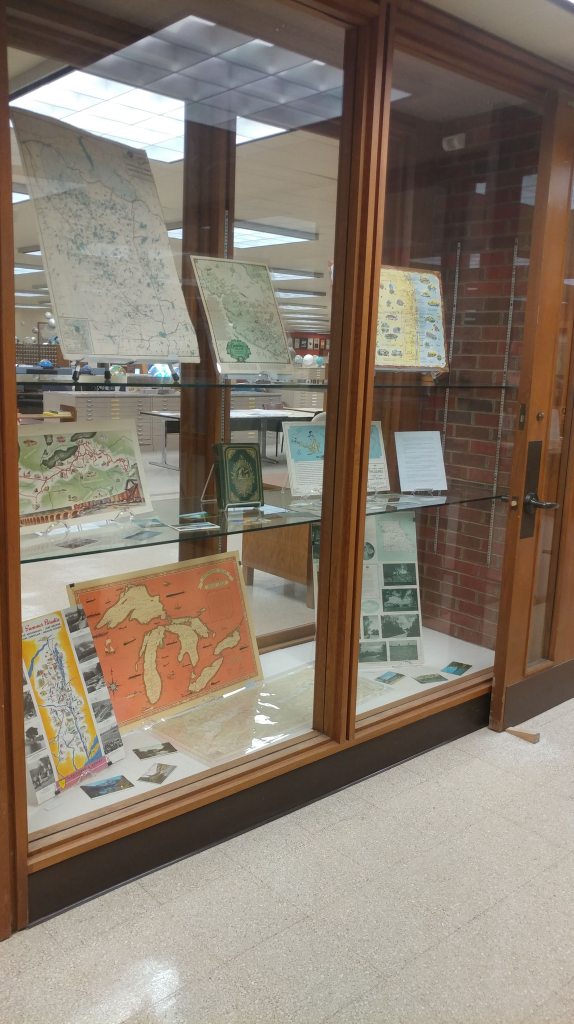
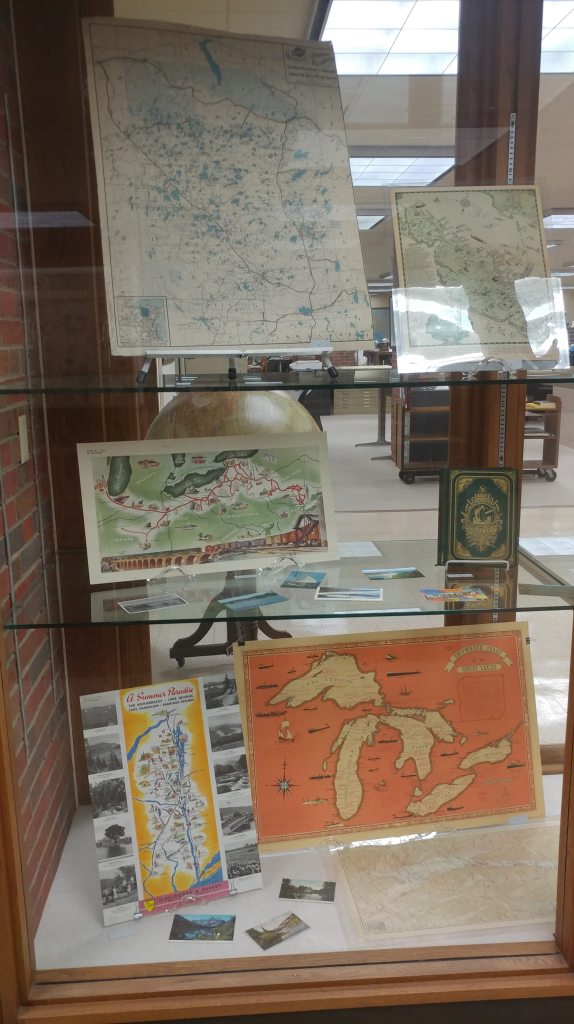
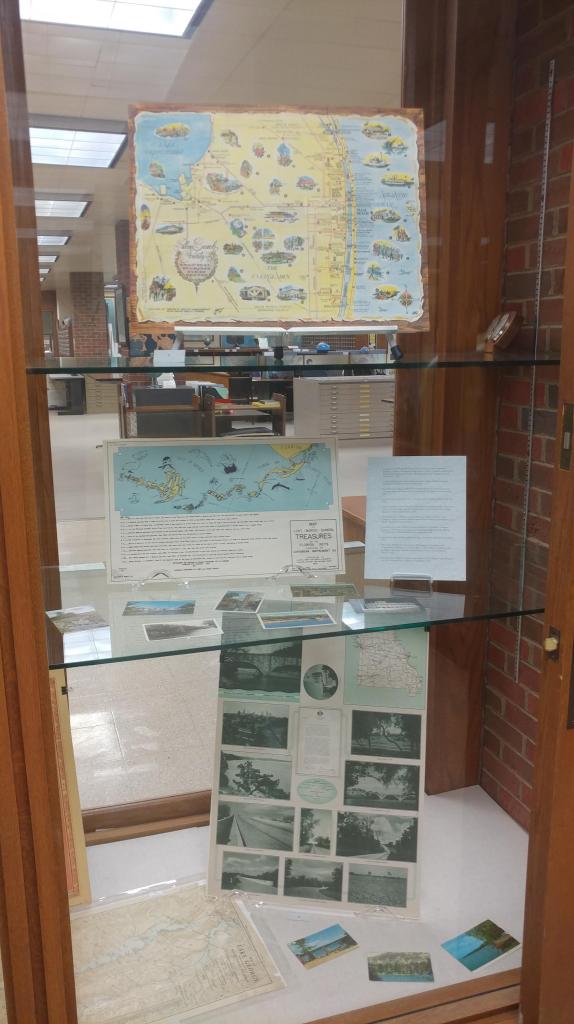
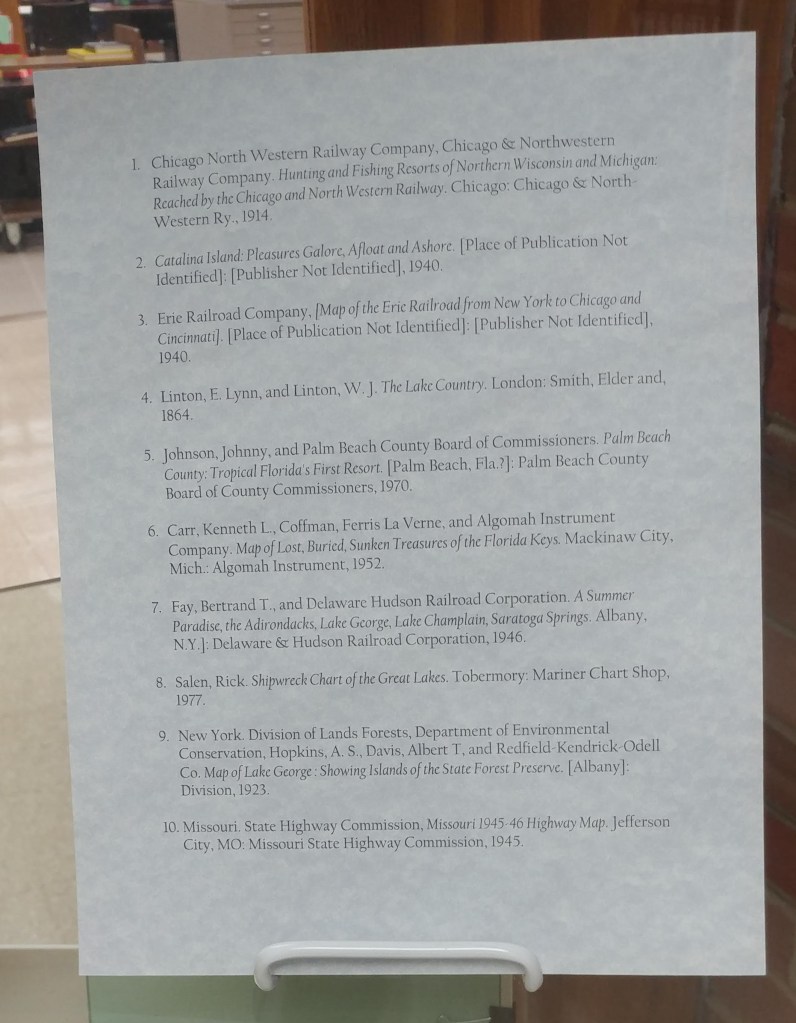
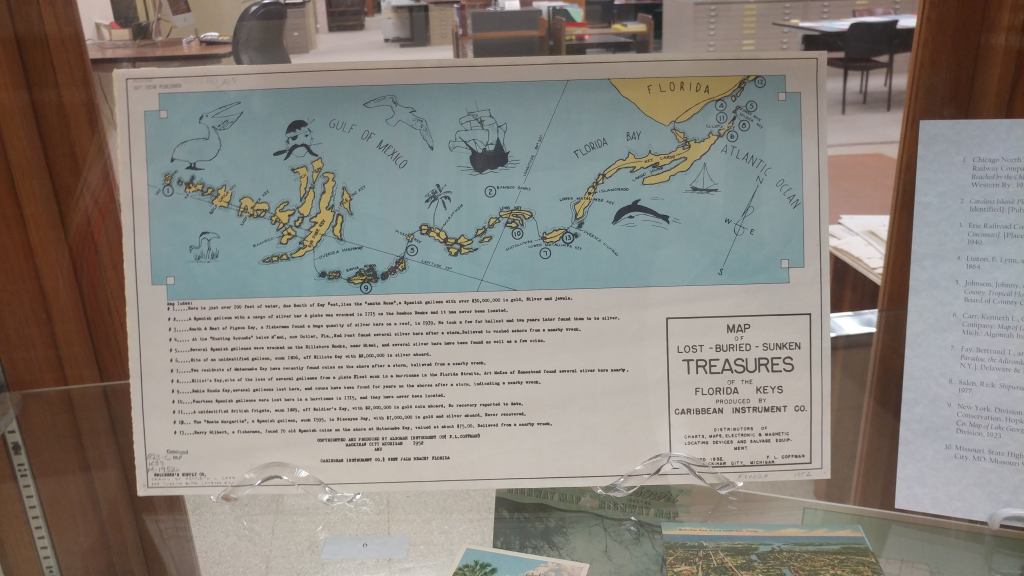
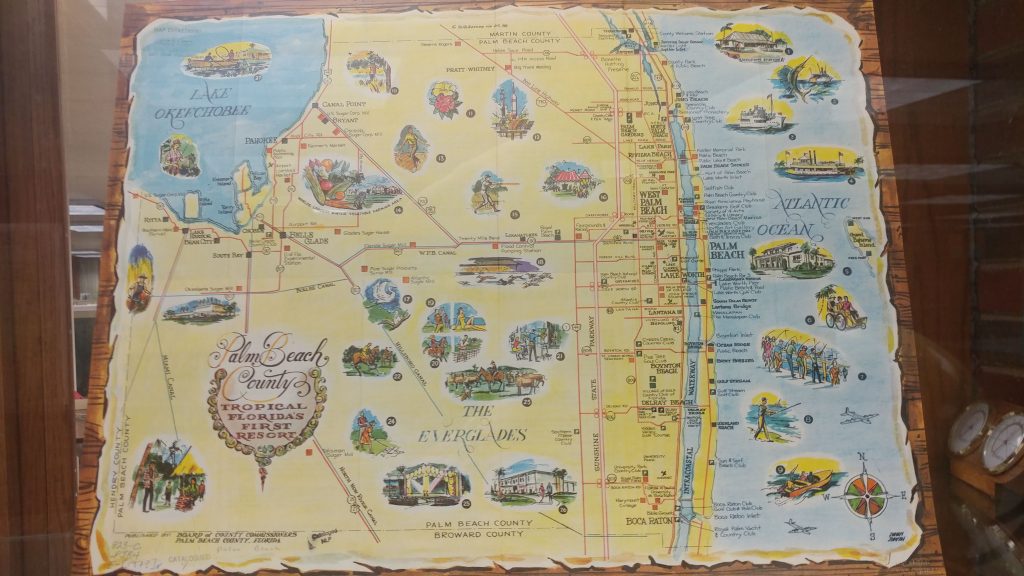
Lake Tourism Exhibit
by Angie Cope
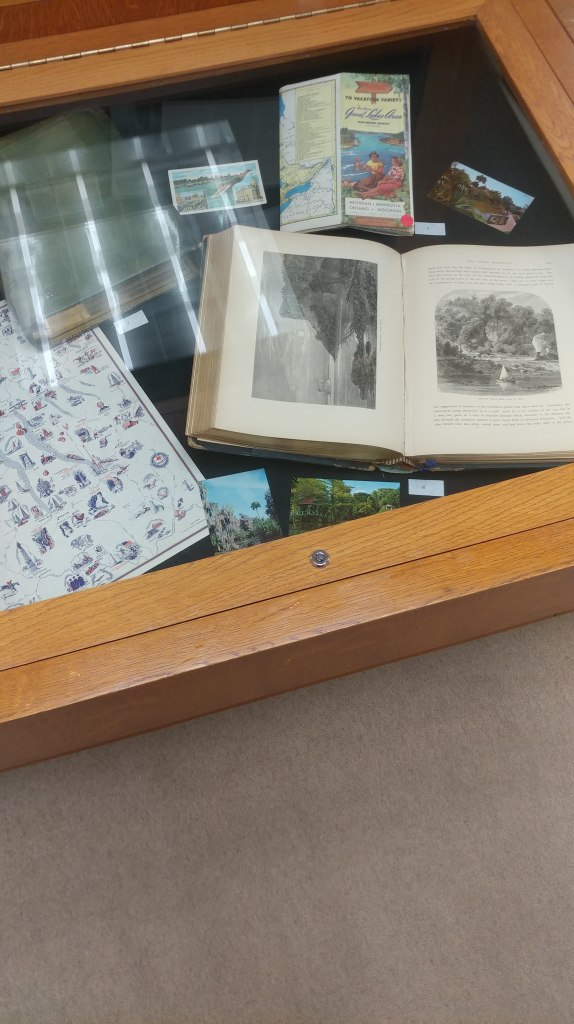
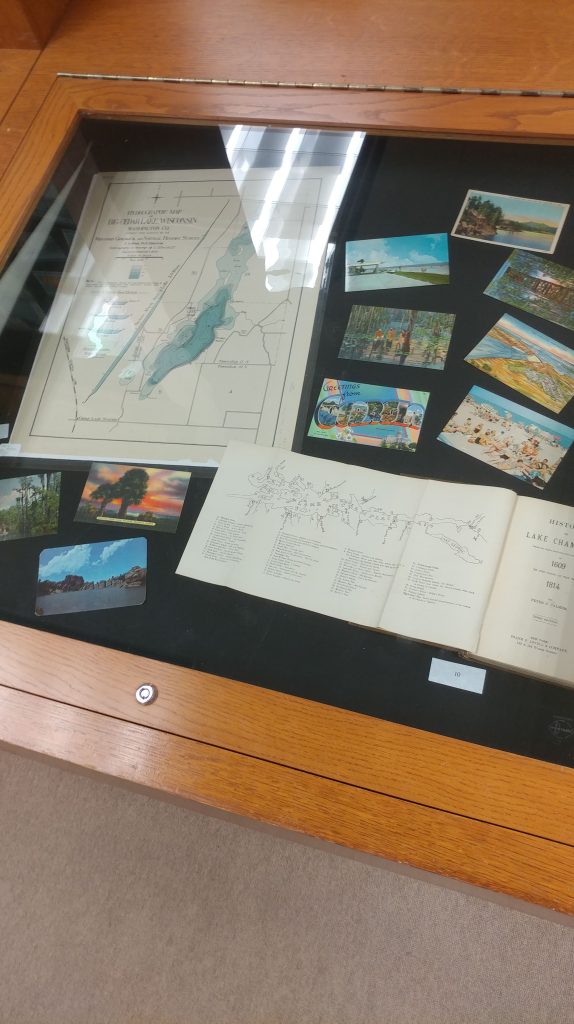
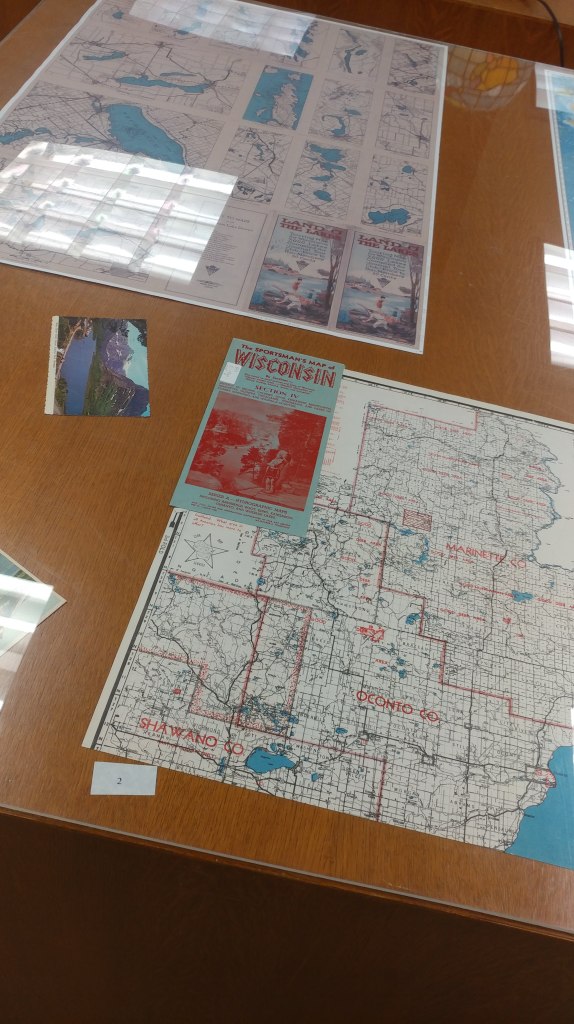
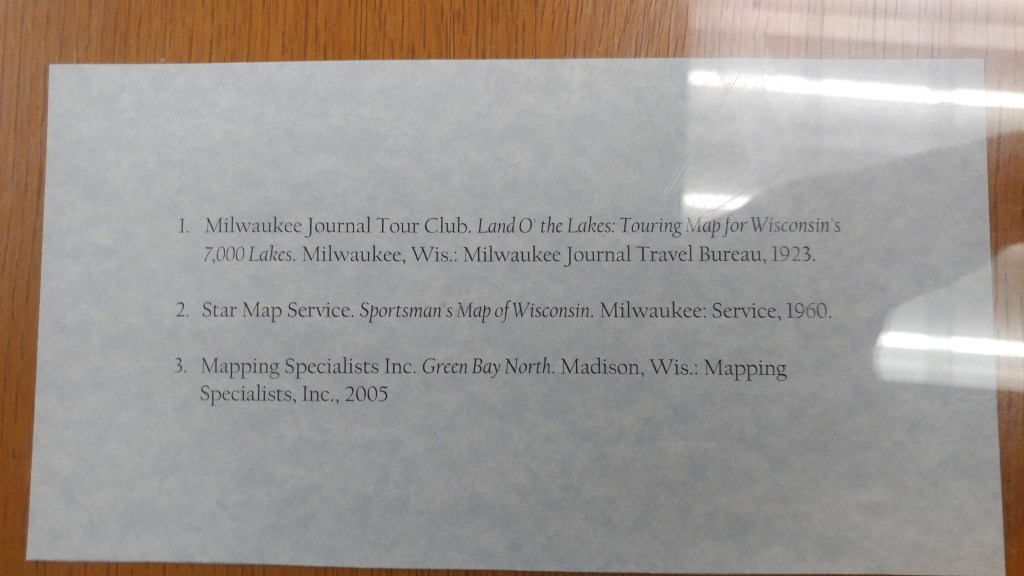
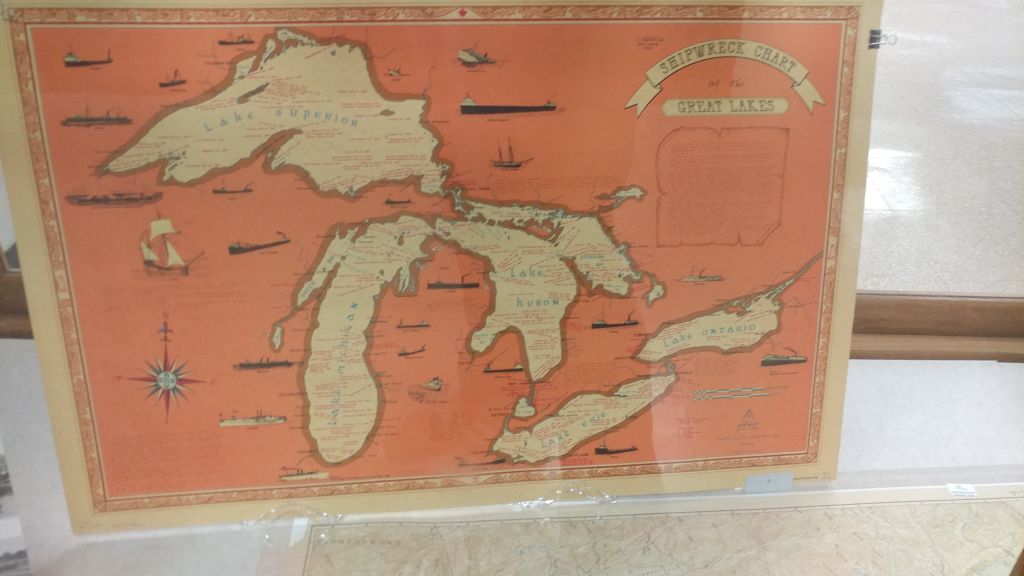
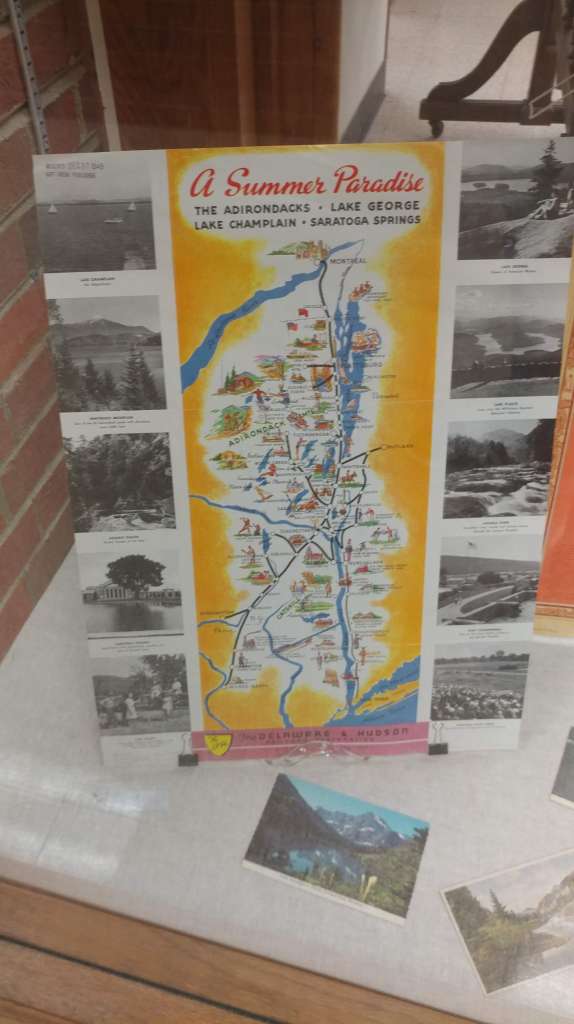
Here is a closer look at the Fall exhibit curated by Georgia Brown, Graduate Student Intern at the AGS Library. The fall exhibit highlights lakes and water features in the United States using maps, books and postcards.
Imperial Russian Black Sea Atlas at the AGSL Part II
By Josephine Miller
Black Sea Atlas
The atlas became a significant work. It would be used by the Russian military for the next 30 years.[1] Manganari’s nautical charts were used as a base for the later editions published by the Imperial Navy. Even the Soviets used Manganari’s charts as a base in the 1920s, about eighty years after the original atlas was published. These later editions are held by the AGS Library. In the AGS Library’s possession are Black Sea and Azov nautical charts that date from the 1880s to the 1920s. Illustrations and corrections were added to later editions. These illustrations include lighthouses, large buildings, sea marks, and day marks to facilitate navigation. Newer measurements of compass declination were also added. However, much of the original Manganari charts remained in the later editions. His drawing of the coastlines, topography, and bathymetry remained as a base for future editions into the early Soviet era. The soil reports given from his nautical charts remained as well. Additionally, the map scales were kept in later editions.
As for the coastlines of the nautical charts, they were drawn according to astronomical and trigonometric calculations. This can be seen virtually all of the nautical charts of the Black Sea Atlas:

“Shore is determined by trigonometric means and many astronomical observations.” From Карта Части Сѣвернаго Берега Черного Моря отъ Одессы до Мыса Херсонеса (A Map of Northern Black Sea Coast, Odessa to Cape Chersonesos). Click the link to see the entire map!
Navigational routes, drawn as sea lanes, are essential to nautical charts. To aide navigation, landmarks and seamarks are given. Manganari plotted different kinds of lines to indicate valuable information for navigation. Each chart in the atlas has almost identical legends in regards to navigation. However, there is slight variations between charts due to mountains or cultural landmarks. These cultural landmarks are usually religious, such as churches and mosques. Here is the legend from the 1891 edition of the Northern Black Sea Coast.
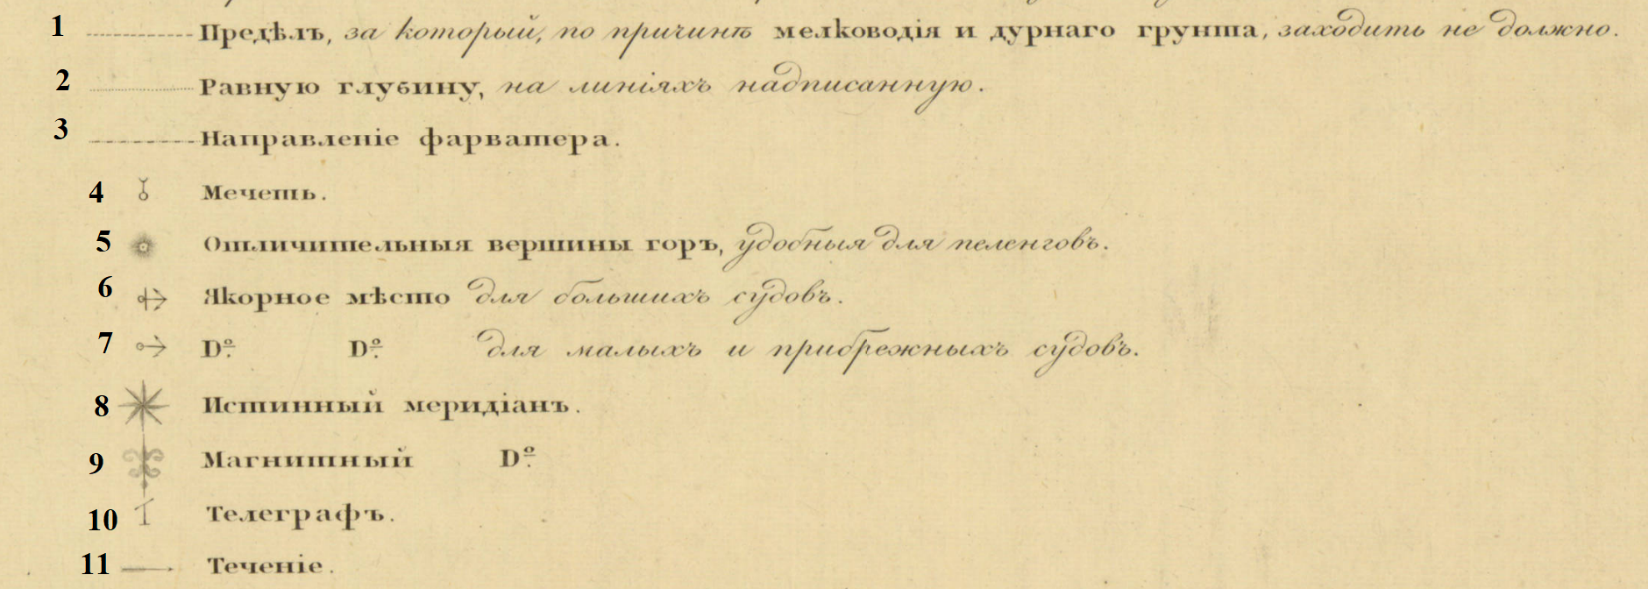
1. The limit for which, due to shallow water and bad soil, should not enter. 2. Equal depths on the plotted line. 3. Direction of fairway. 4. Mosque. 5. Distinctive mountain peaks, convenient for bearing. 6. Anchor place for large ships. 7. Anchor place for small and coastal ships. 8. True Meridian. 9. Magnetic Meridian. 10. Telegraph 11. Tide or Current.
One area of British influence in Russian cartography is measurement. A larger than life ruler, the impact of Peter the Great carried long after his death. His reign is reflected in the field of Russian cartography. Inspired by his tour of the West, he established in the Imperial Navy in 1696. Peter’s command to westernize Russian government brought Western cartography to Russia, military largely in mind. One major reform was to implement British measurements for military use. Consequently, almost two centuries later, the Russian Navy used the British Imperial measurements in its nautical charts. This can be seen on the AGSL’s charts. The Imperial measurements were used for distance and depth.
On this 1891 edition nautical chart of the northern Black Sea coast, the map scale uses British measurements:
On this 1891 edition nautical chart of the northern Black Sea coast, the map scale uses British measurements:
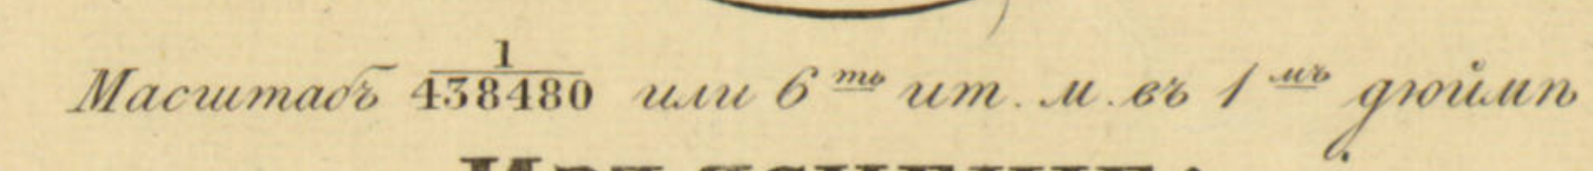
Map Scale of Карта Части Сѣвернаго Берега Черного Моря отъ Одессы до Мыса Херсонеса [Northern Black Sea Coast, Odessa to Cape Chersonesos].

Another example of British measurments is found on the same chart, depth.
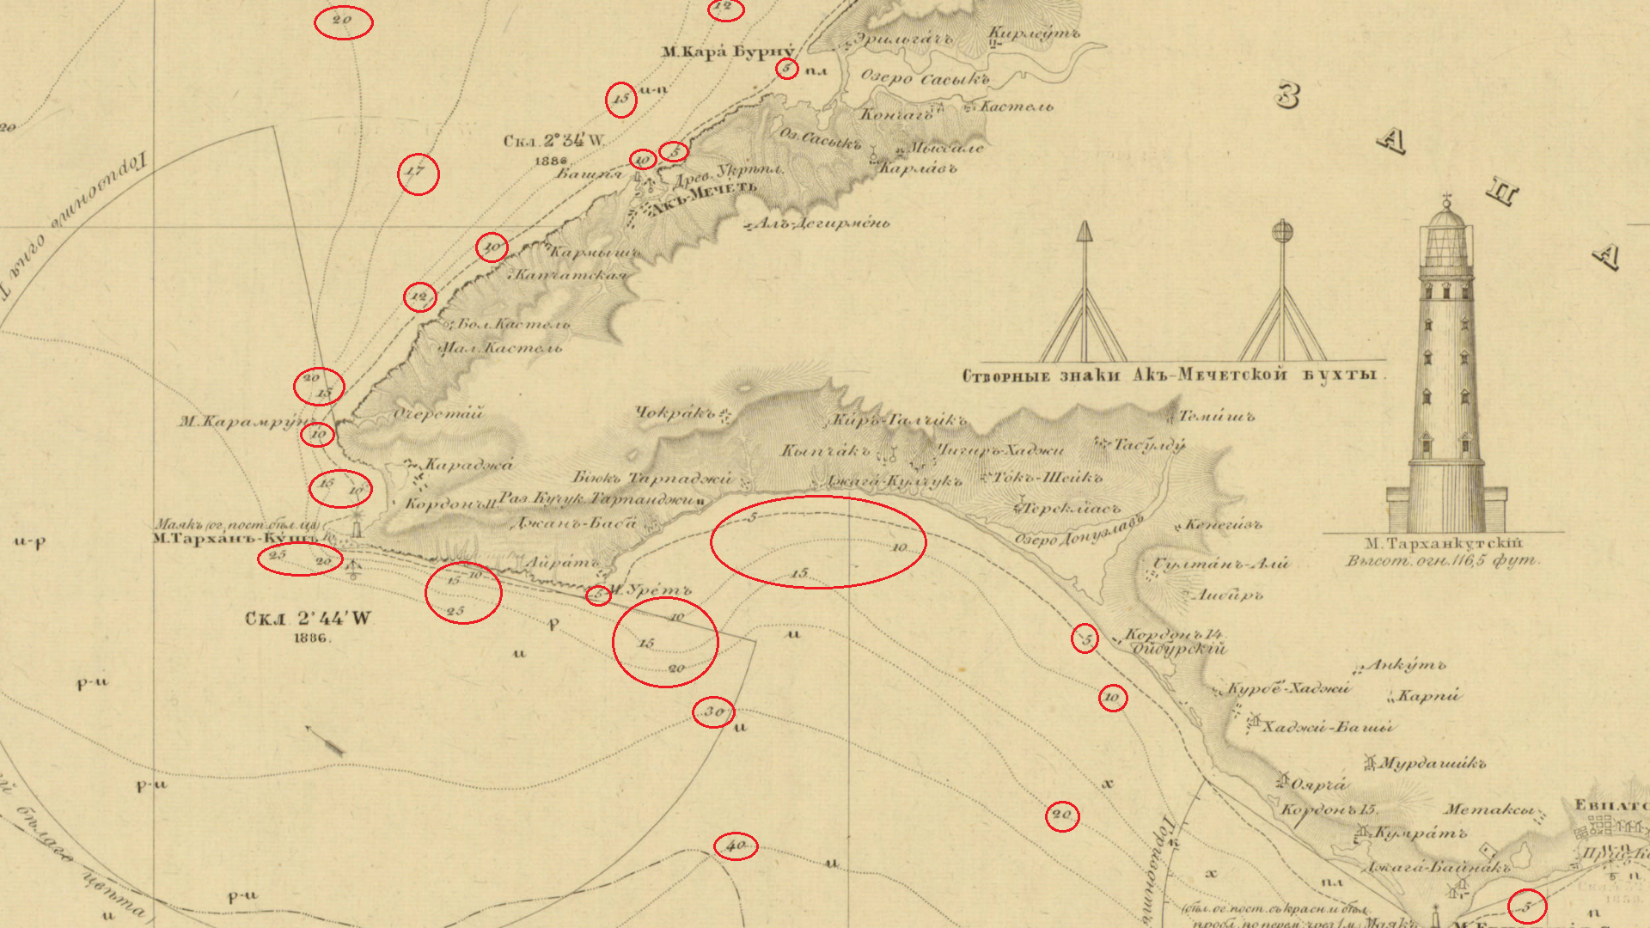
“Depth of sea height measured in six-foot English fathoms – rivers and estuaries in feet.”
Circled below are the depth marks.
From Карта Части Сѣвернаго Берега Черного Моря отъ Одессы до Мыса Херсонеса (Northern Black Sea Coast, Odessa to Cape Chersonesos). Click the link to see this map in our Digital Collections!
In addition to depth, Managanari recorded the soils of the sea floor.
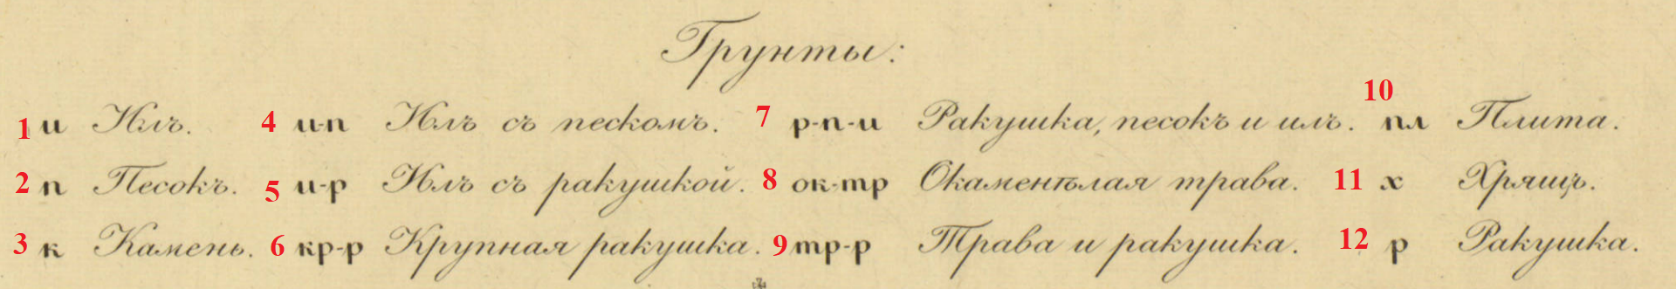
Карта Части Сѣвернаго Берега Черного Моря отъ Одессы до Мыса Херсонеса (Northern Black Sea Coast, Odessa to Cape Chersonesos). Click the link to see the whole map in our Digital Collections!
- Silt
- Sand
- Rock
- Silt with sand
- Silt with shells
- Large Shell
- Shell, sand in silt
- Petrified weeds
- Weeds and shells
- Plate
- Cartilage or Gristle
- Shells
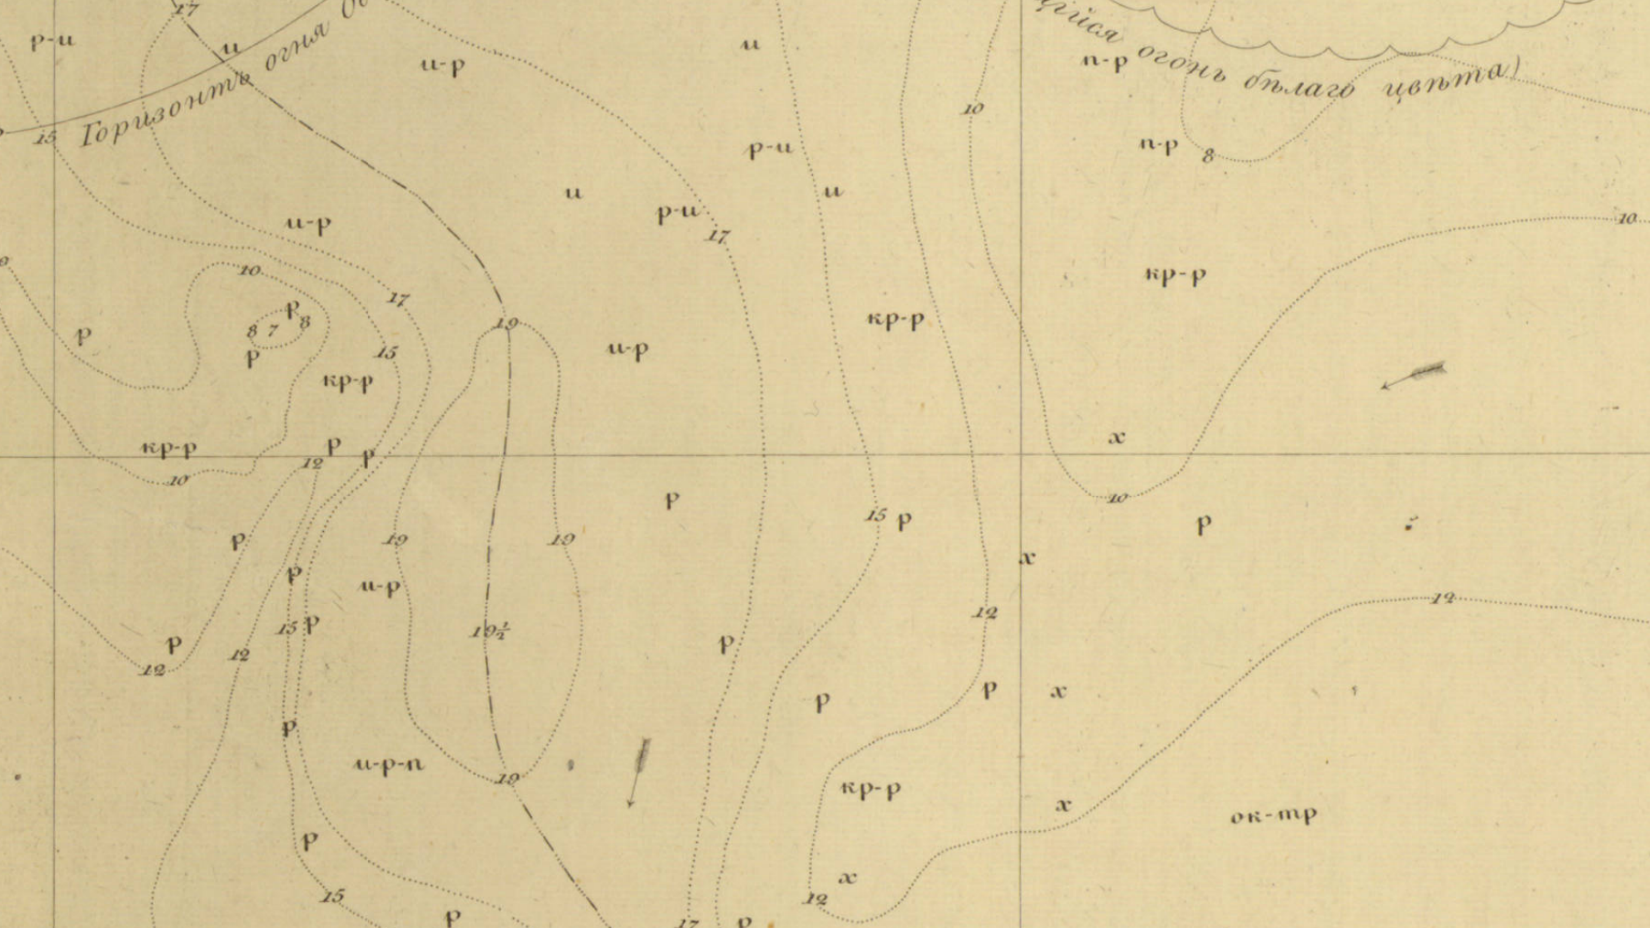
Sea floor on the chart. The letters represent soils as indicated by the legend.
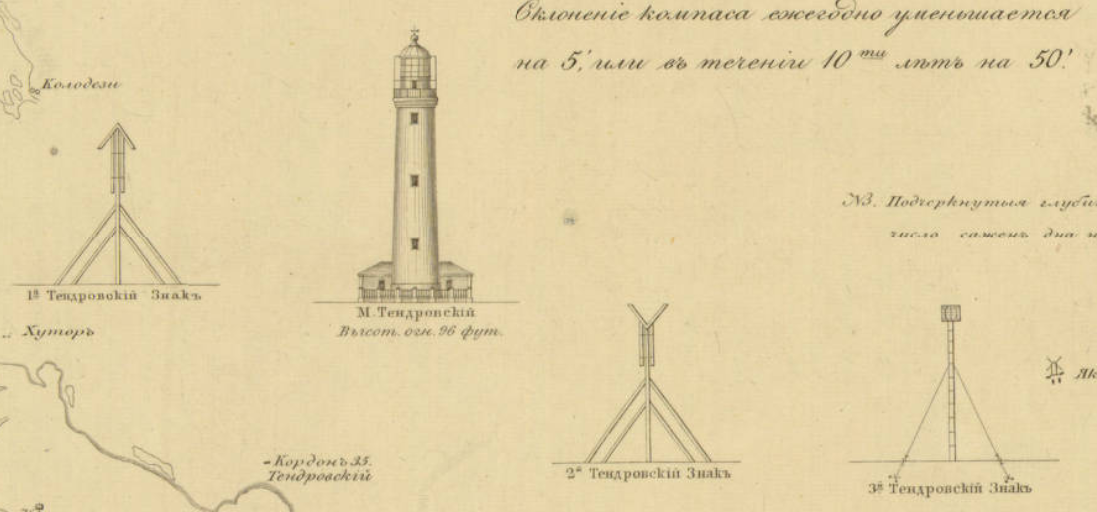
Later editions published after the Treaty of London (1870) include lighthouses and seamarks. Here is the Lighthouse of Tendra Bay on the Southwestern coast of Ukraine. It is noted as 96 feet. Beside it are seamarks. These landmarks aide navigation.
A significant factor to navigation is the prime meridian. In the early 19th century, the Russian militray did not use Greenwich as the prime meridian for its cartography. Instead, Manganari used the Pulkovo Meridian as the prime meridian, which was the practice in Russia at the time. The Pulkovo meridian is located at the Pulkovo Observatory in Saint Petersburg. In the spirit of the reforms in Alexander’s II reign, the later editions adopted Greenwich.

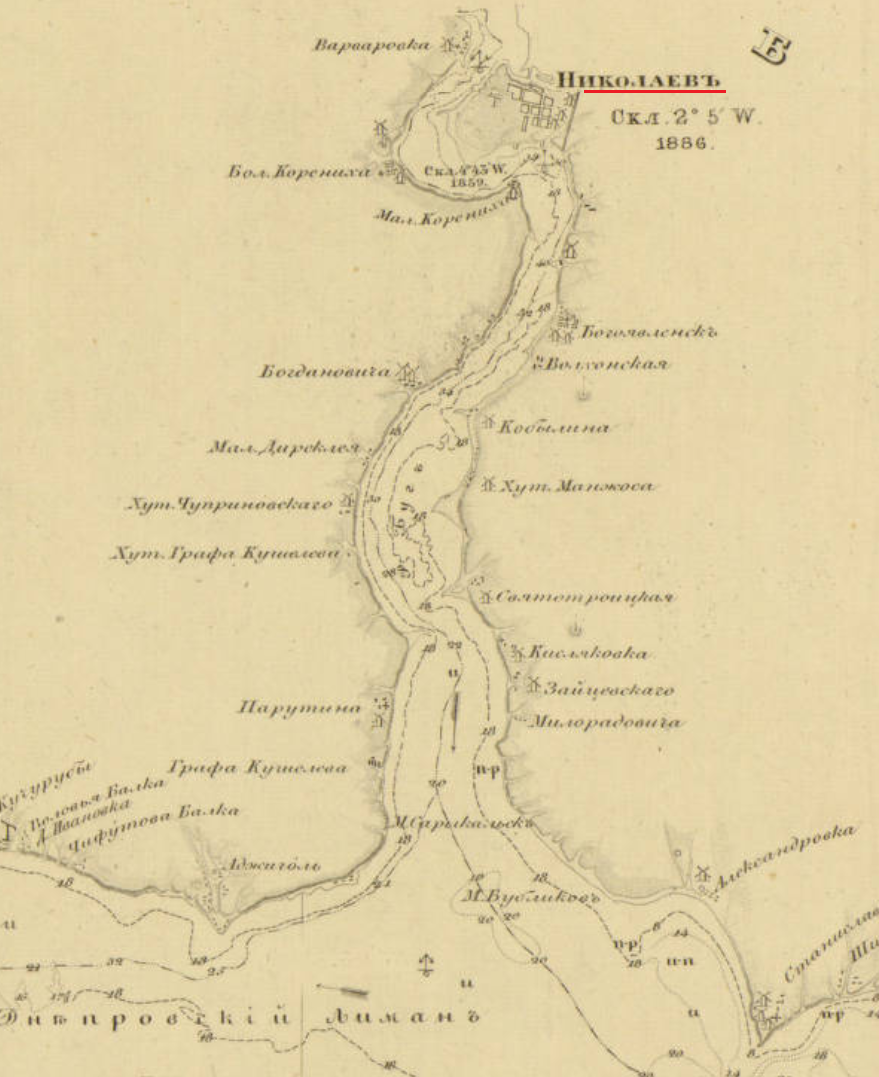
Nikolayev was a base of the Black Sea Fleet. It was also the location of the Depot of the Hydrographic Department of the Black Sea Fleet for the Imperial Navy. In1803, the depot was founded at the request of the Marquis de Traverse, Commander-in-Chief of the Black Sea Fleet at the time. It was established for the engineering needs of the fleet. There, the nautical charts of the Black Sea Atlas were drawn and compiled before engraving. Later editions of the charts were published in Nikolayev. [2]
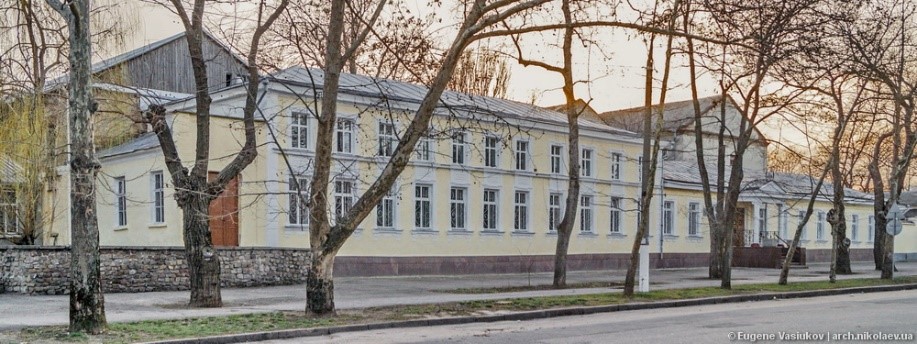
Map Depot of the Hydrographic Department, Black Sea Fleet, Imperial Russian Navy, Nikolyaev. Click the link to learn more!
Later editions borrow from Vice-Admiral Thomas Abel Brimage Spratt (1811-1888). Spratt had an extensive career in the British Navy as an officer, hydrographer, and geologist. He produced a repertoire of nautical charts for the British Admiralty. He was a fellow of the Royal Geographical Society of London, the Zoological Society of London, the Society of Antiquaries of London, the Royal Society of London. The Crimean War provided Britain with the opportunity to survey the Black Sea. The then Captain Spratt completed nautical surveys of the Black Sea during the war. In May of 1851, Captain Spratt was given command of the paddle steamer HMS Spitfire to survey the island of Crete. This was the ship he used in the 1850s for his surveying of the Black Sea as it is noted on the nautical charts of the later editions.
The conditions of the Treaty of Paris (1856) is a primary reason why the Russian Navy would use Spratt’s maps in their own nautical charts of the Black Sea. Given that the Russian Navy could not have fleet in the Black Sea after the Crimean War, the navy could not perform its own surveying in the Black Sea. This situation lasted until the abrogation of the Black Sea clause by the Treaty of London in 1870. For the latter half of the 1850s and through the 1860s, Russia was without a fleet in the Black Sea to do the surveying required for nautical charts. Thus, the Russian navy had to find other sources for the information that they could not gather themselves in the time period. One source would be the Spratt’s surveys. By 1870, when Russia could rebuild the Black Sea Fleet, the most recent Russian survey of the Black Sea was Manganari’s atlas. However, the atlas had been published in 1841-1842 with surveys from the 1820s and 1830s. Spratt’s work was more recent dating to the 1850s. For that reason, Spratt’s work was included in the later editions of the 1880s and 1890s.
The legacy of Captain Manganari carried through one century into the next. His charts for the Black Sea Atlas that he surveyed in the 1880s would be used as a basemap for later editions. Even the Soviets used Managanari’s charts in the 1920s, almost century after Manganari published the Black Sea Atlas. The Black Sea has historically been signifcant for trade and militrary power. It has always has been a politcally contentious region, and remains so to this day. For this reason, the nautical charts of the Black Sea Atlas reflect the political situtiation and its military conflicts in the 19th century.
[1] Ibid.
[2] Васюков, Евгений ; Архитектура Николаева. Депо карт. [Vasi͡ukov, Evgeniĭ ; Nikolayev Architecture. Map Depot.] http://archmykolaiv.com/depo-kart/.
