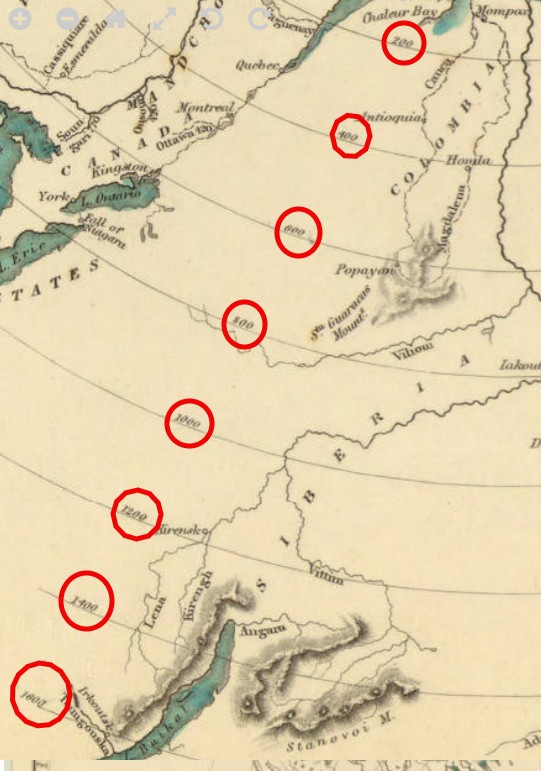
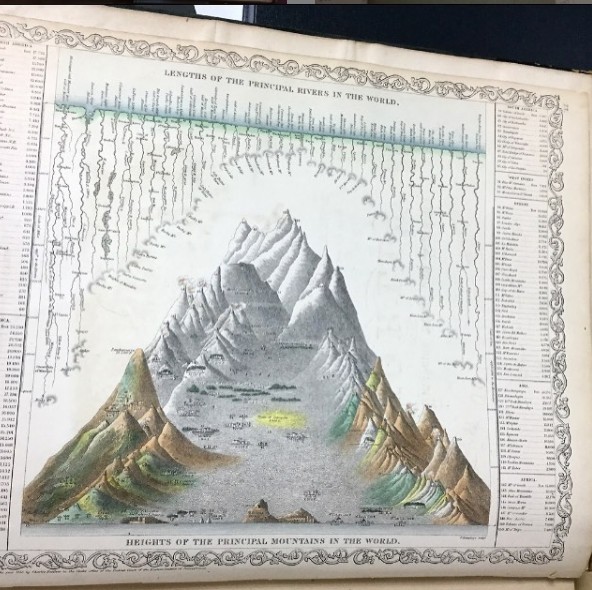
Comparative river chart by the Society for the Diffusion of Useful Knowledge
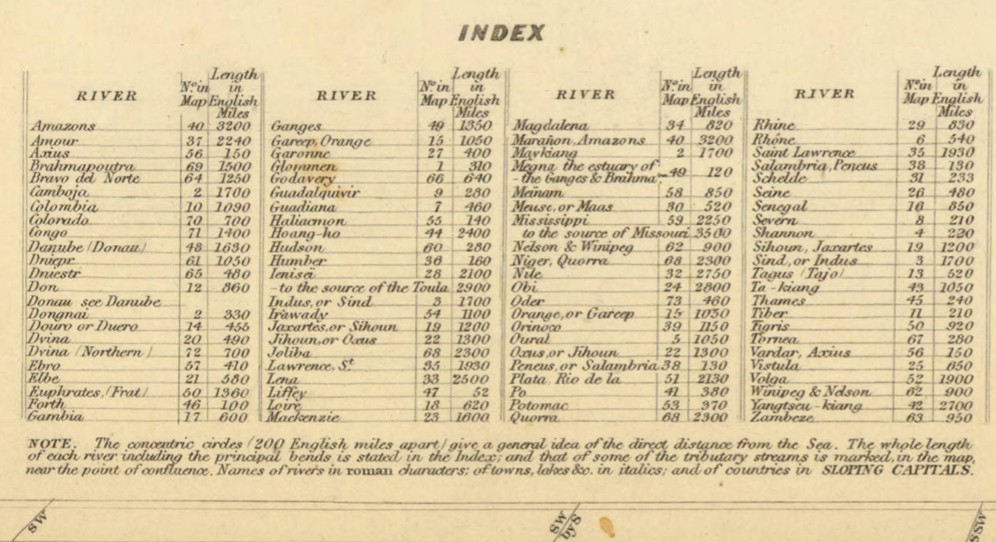
This chart shows the general lengths of 92 of the great rivers of the world.
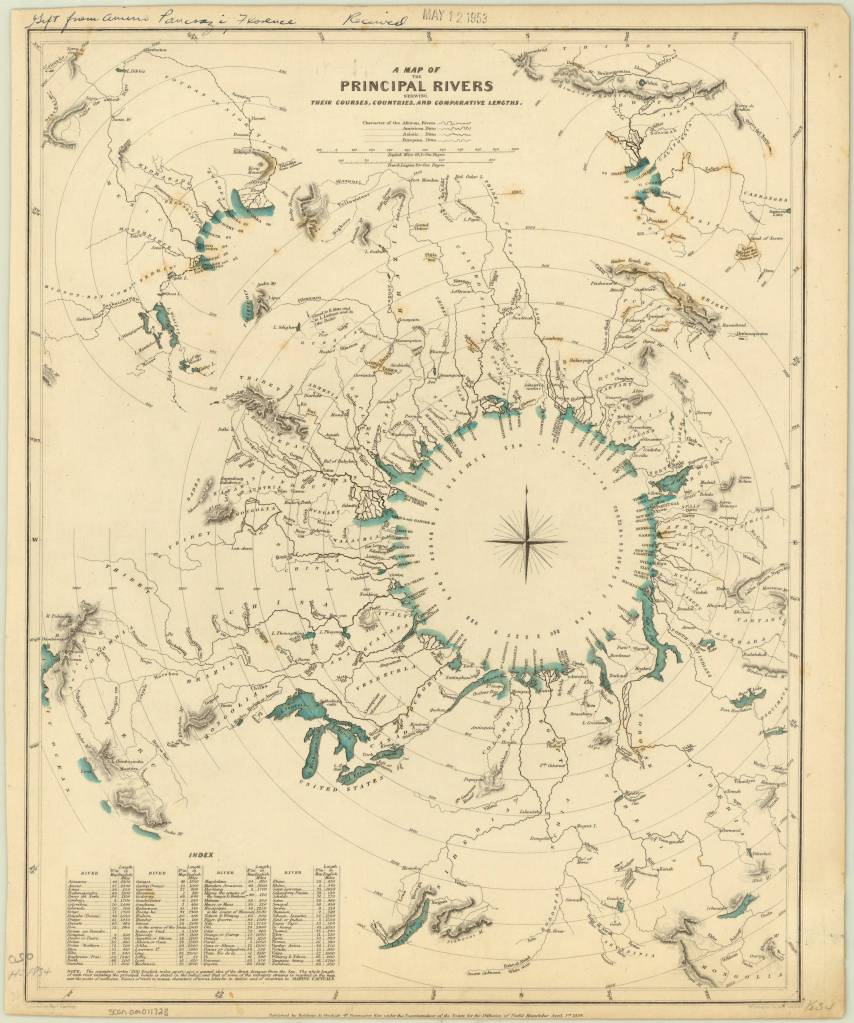
A map of the principal rivers shewing their courses, countries, and comparative lengths / published by Baldwin & Cradock, under the superintendence of the Society for the Diffusion of Useful Knowledge ; engraved by Thos. Starling, 1834. https://collections.lib.uwm.edu/…/agdm/id/5294/rec/1
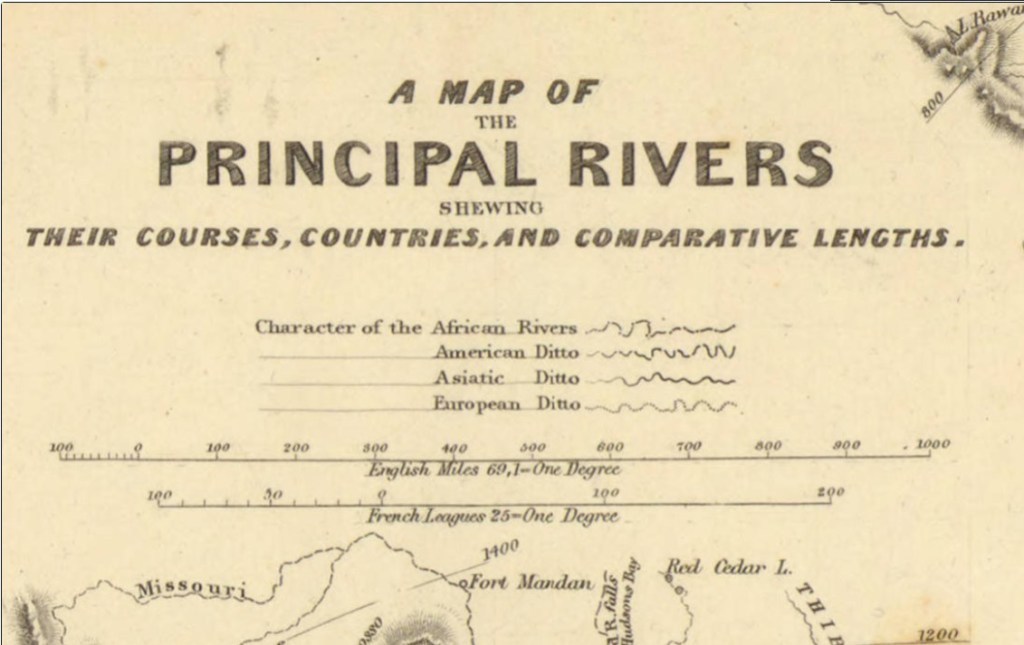
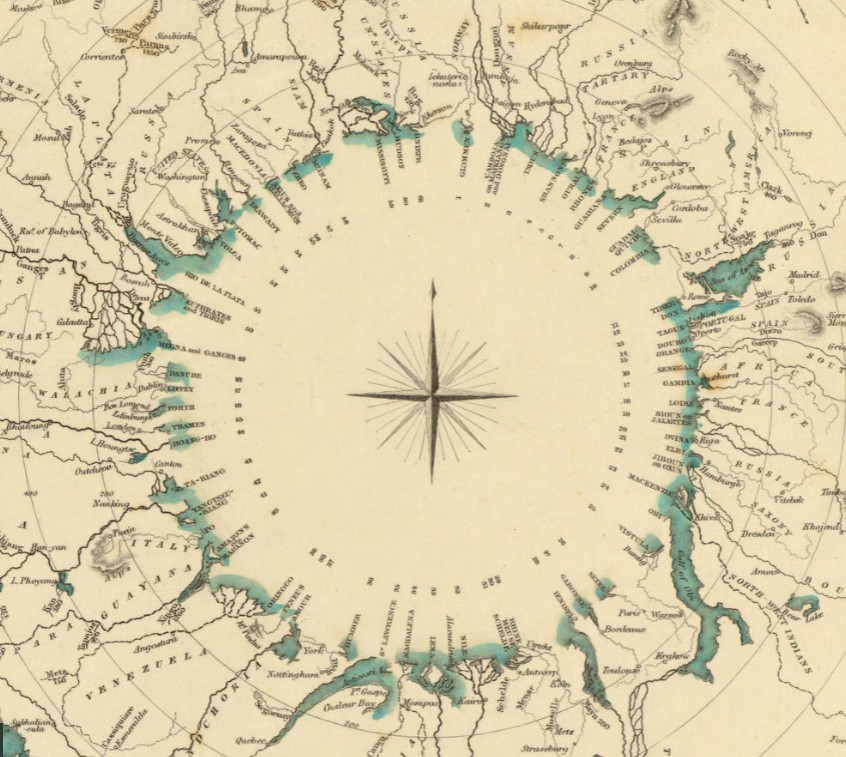
Concentric circles depict approximate distances, with exact lengths given in the index in the lower left.
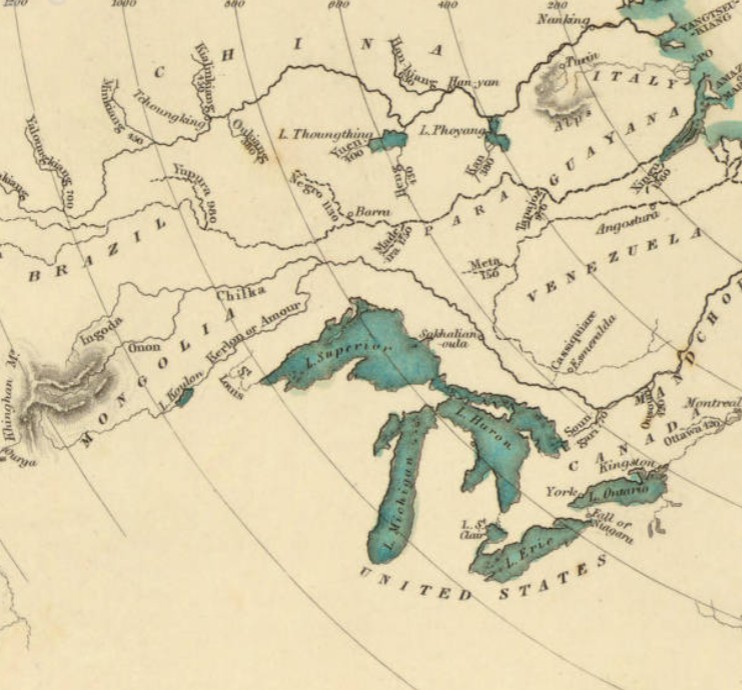
Shading and hachures are used to shows selected mountains and volcanoes. There are actually 3 diagrams within this chart – 2 smaller diagrams are hidden in the top 2 corners.
A lovely compass rose graces the center of the chart.
The Society for the Diffusion of Useful Knowledge (SDUK) was a London-based organization dedicated to the dissemination of self-education materials for individuals without access to formal education. SDUK was founded in 1826 at the urging of Lord Brougham, who became Lord High Chancellor of Great Britain. The Society also published the Library of Useful Knowledge, which was a series of accessible scientific books published biweekly. The SDUK aimed to provide working-class people with access to knowledge at an affordable price.
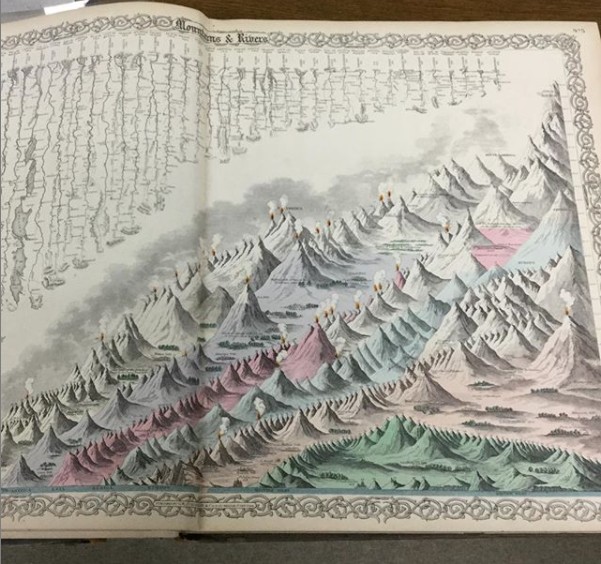
The style of comparative chart shown here never became popular in geographic education. Instead, charts showing comparative mountains and rivers were used in geography texts.
A wonderful book was published in 2019 on just this topic.
An atlas of geographical wonders : from mountaintops to riverbeds : a selection of comparative maps and tableaux / Jean-Christophe Bailly, Jean-Marc Besse, Philippe Grand, Gilles Palsky. New York : Princeton Architectural Press, 2019.
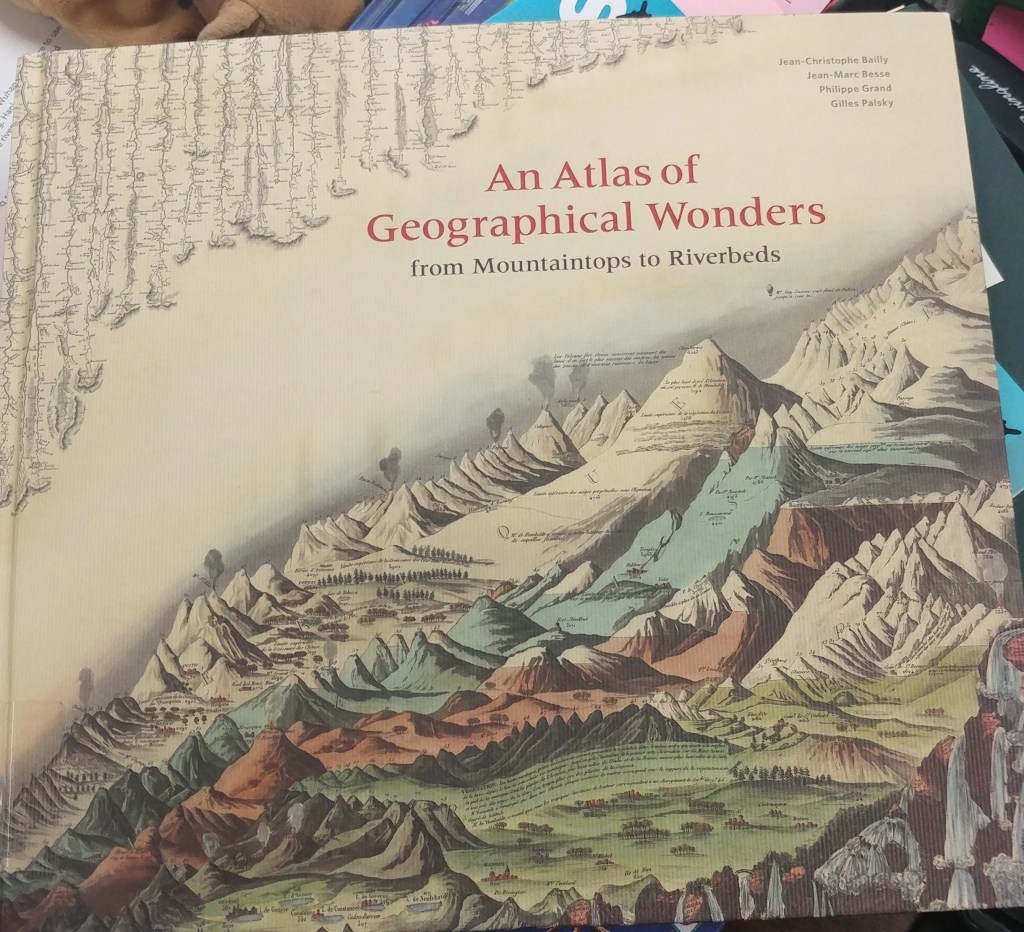
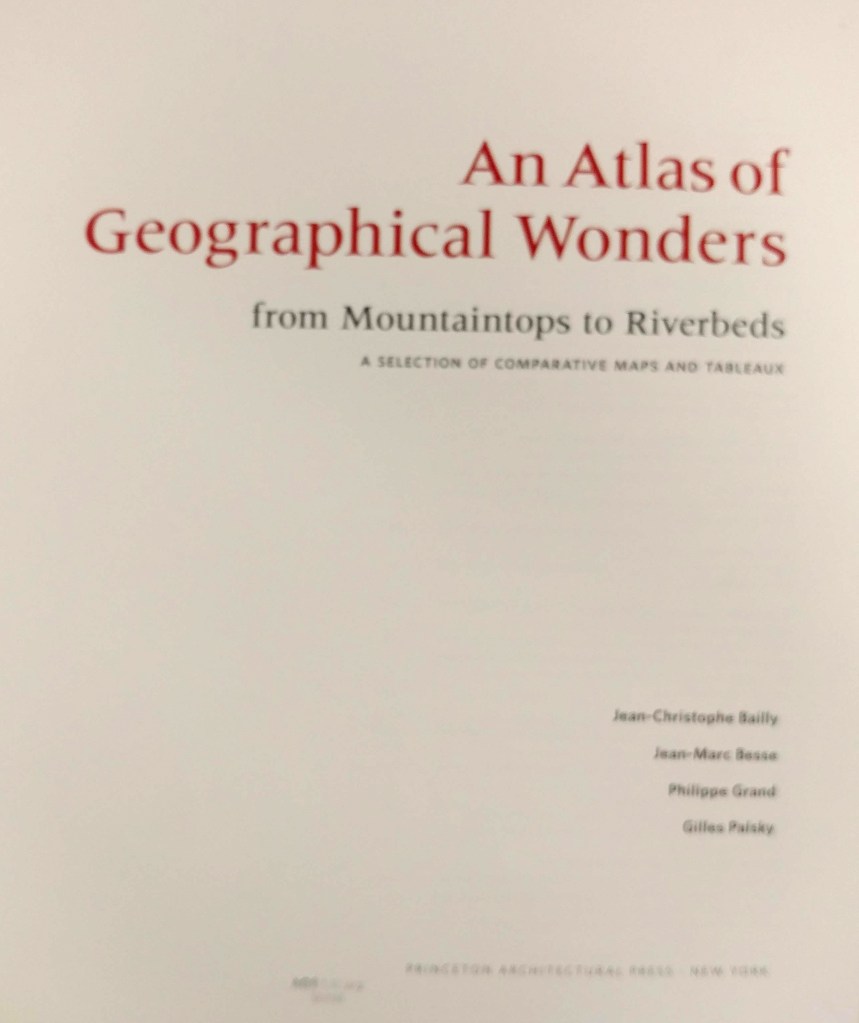
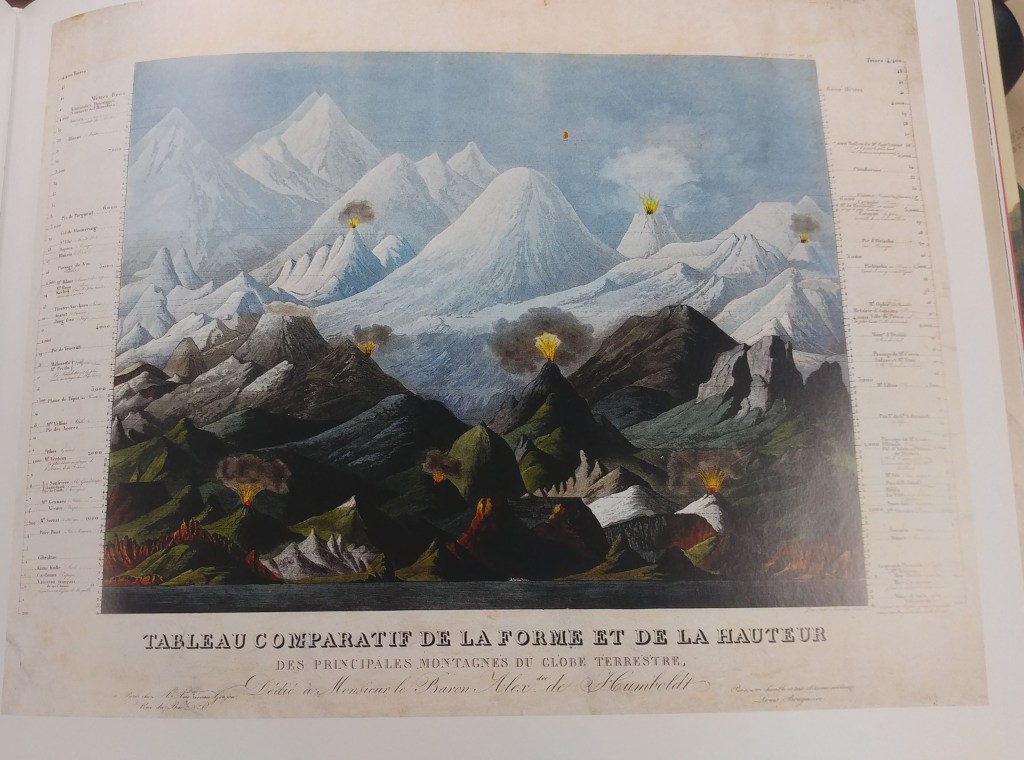
This is the first book to catalog comparative maps and tableaux that visualize the heights and lengths of the world’s mountains and rivers. Produced predominantly in the nineteenth century, these beautifully rendered maps emerged out of the tide of exploration and scientific developments in measuring techniques. Beginning with the work of explorer Alexander von Humboldt, these historic drawings reveal a world of artistic and imaginative difference. Many of them give way—and with visible joy—to the power of fantasy in a mesmerizing array of realistic and imaginary forms.
Planiglobii terrestris world map from 1716
by Angie Cope
Planiglobii terrestris cum utroq hemisphaerio caelesti generalis repraesentatio : quam ex novissimis probatissimisque recentium geographorum scriptis concinnatam, multisq[ue] phaenomenis illustratam / publice proponit Io. Bapt. Homann …
1716
Call number: Rare 050 A-[1716]
https://collections.lib.uwm.edu/digital/collection/agdm/id/1156
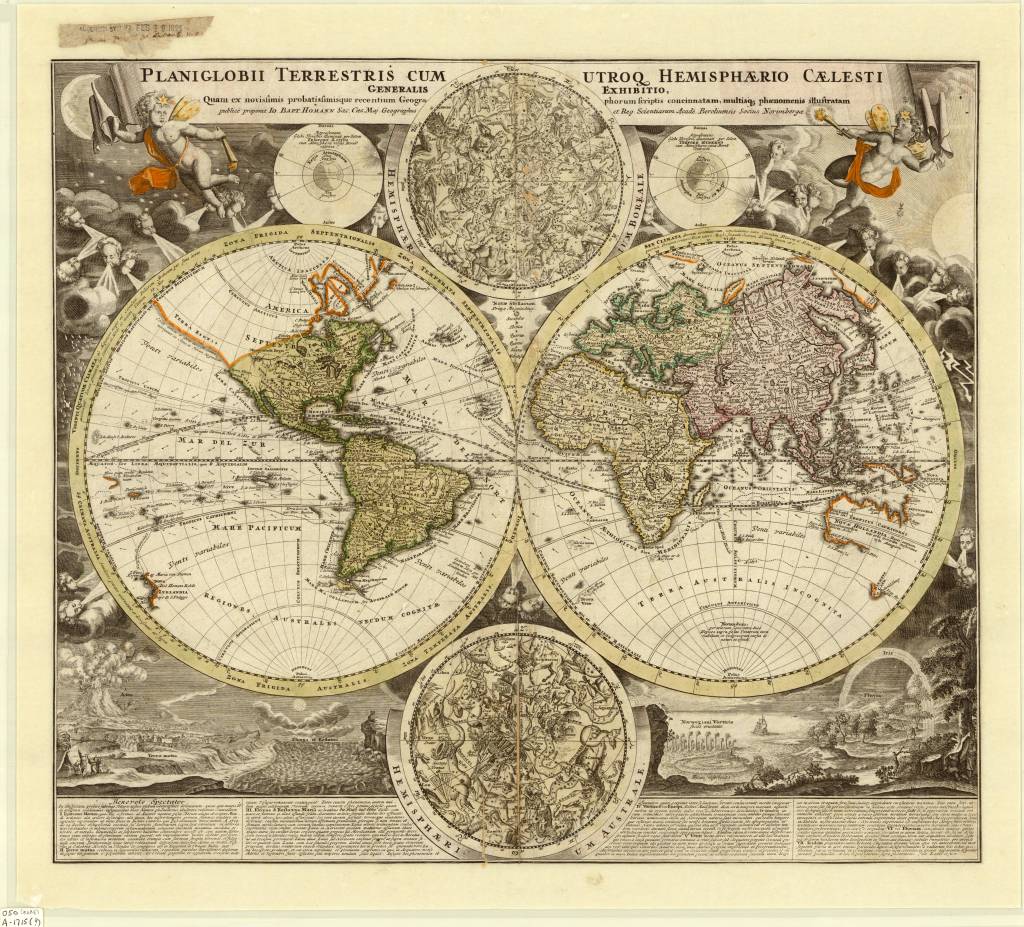
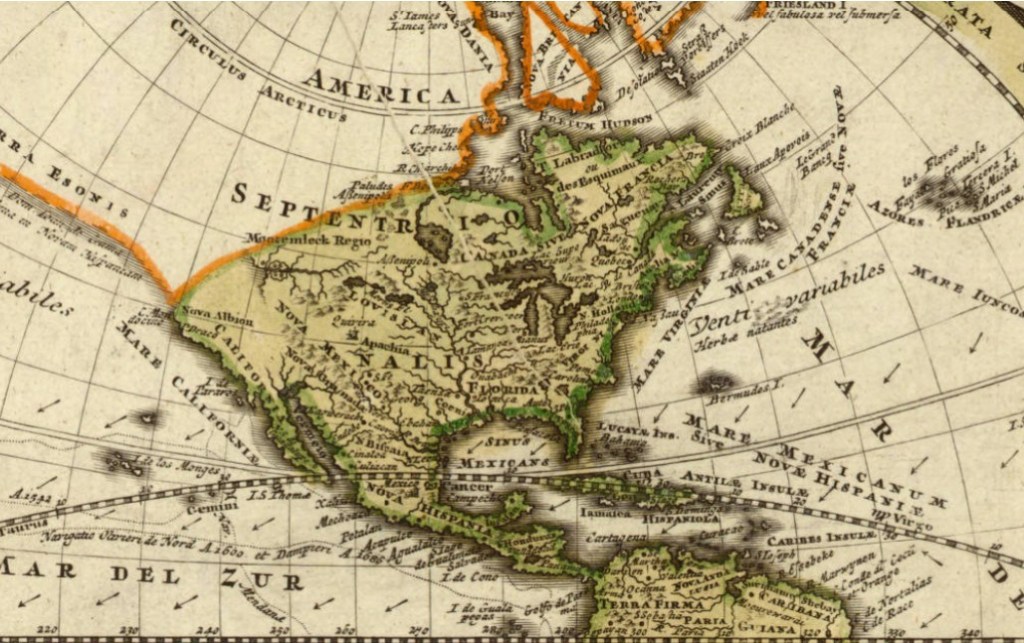
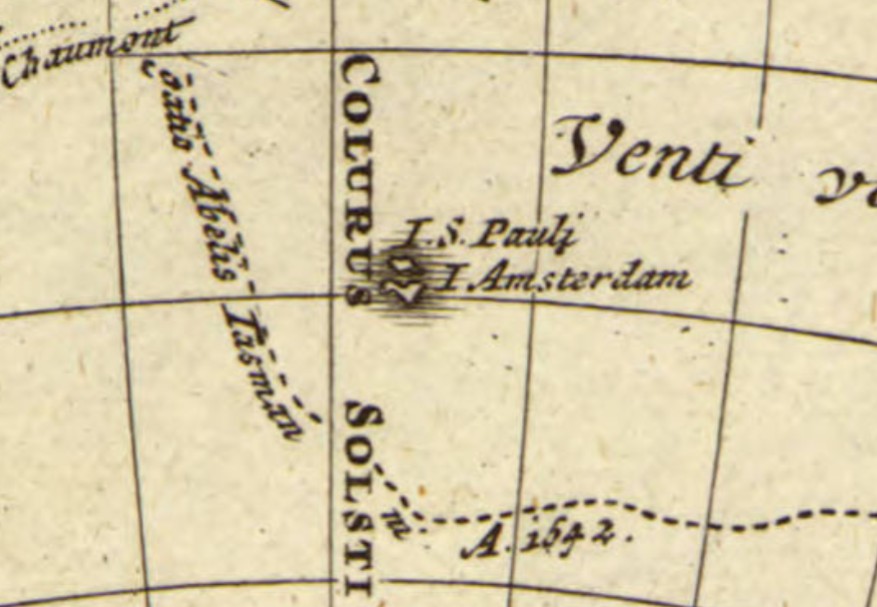
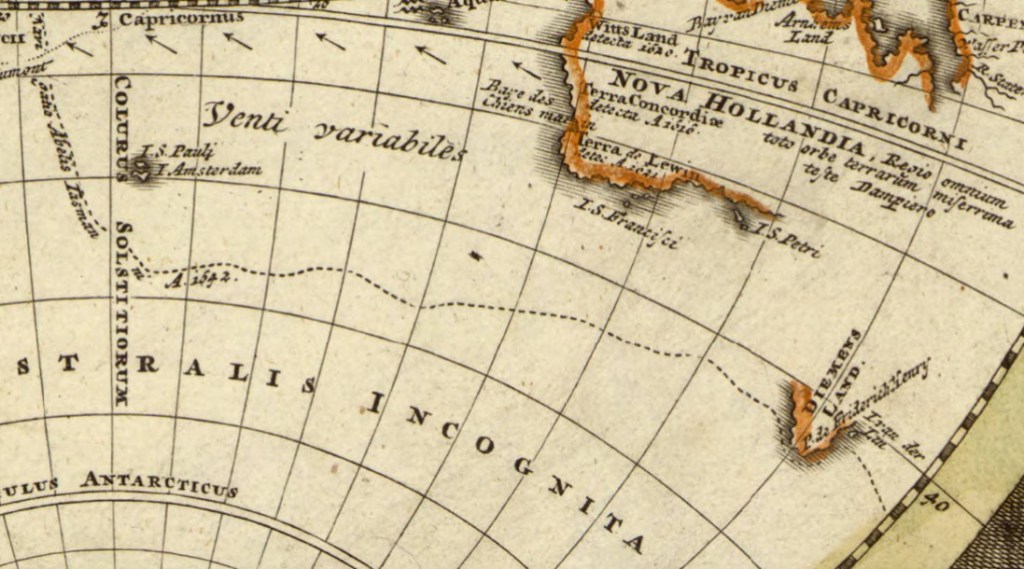
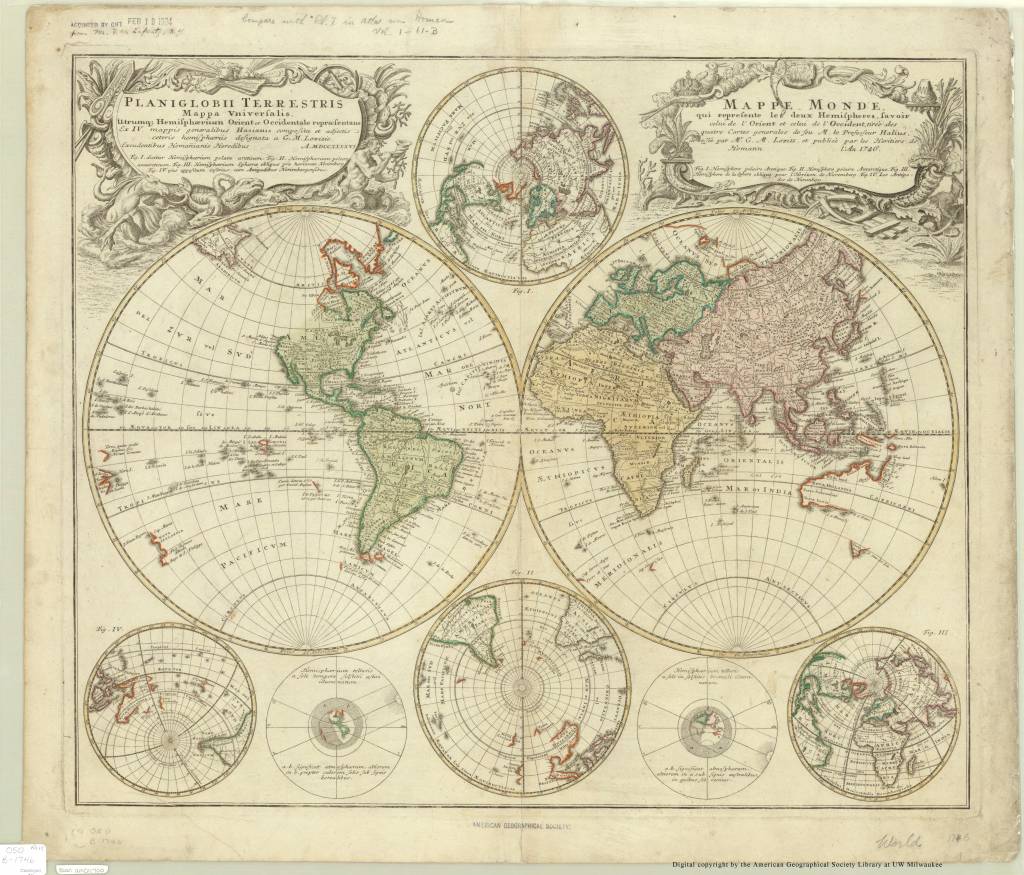
Here is a 1716 map by Johann Baptist Homann from a period in history when geographic knowledge was often unknown. The Australia, New Guinea and New Zealand coastlines are all incomplete, though they include some place names, notes of the early discoverers and tracks of Magellan’s (1522) and Tasman’s (1642) voyages.
Cartographic inaccuracies can be seen on this map such as the east-west trend of the northwest coast of North America, the distorted treatment of Japan, and the absence of an Antarctic continent. However, California does appear as a peninsula.
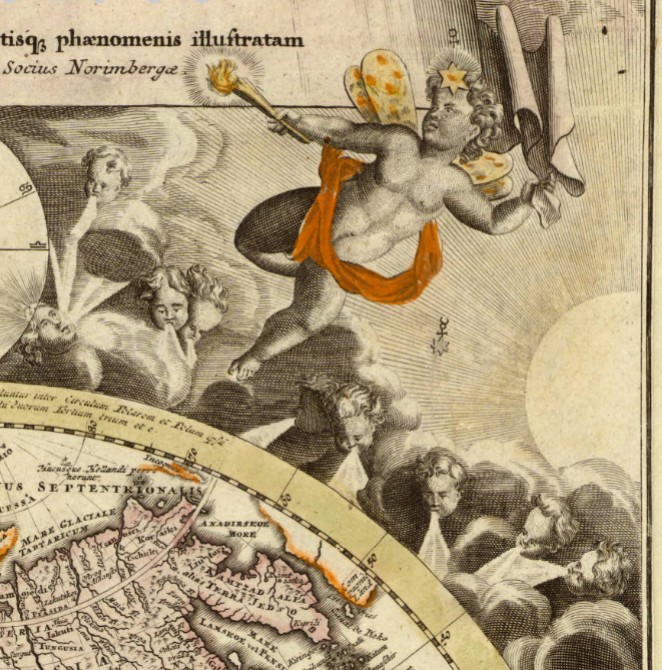
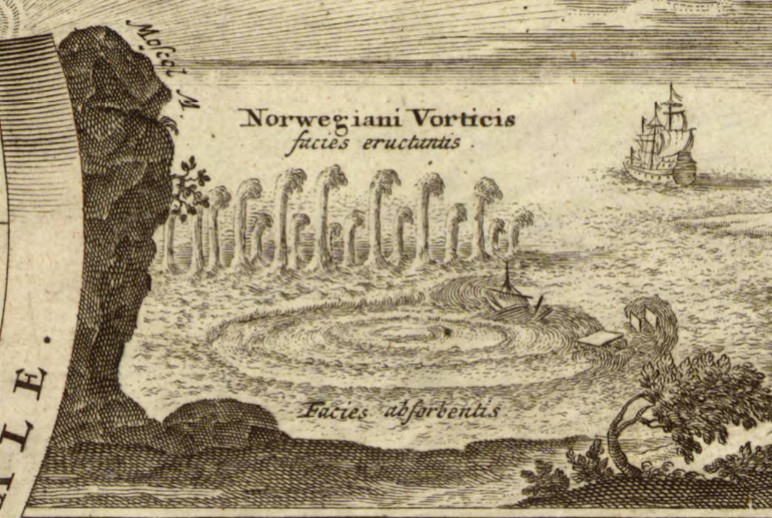
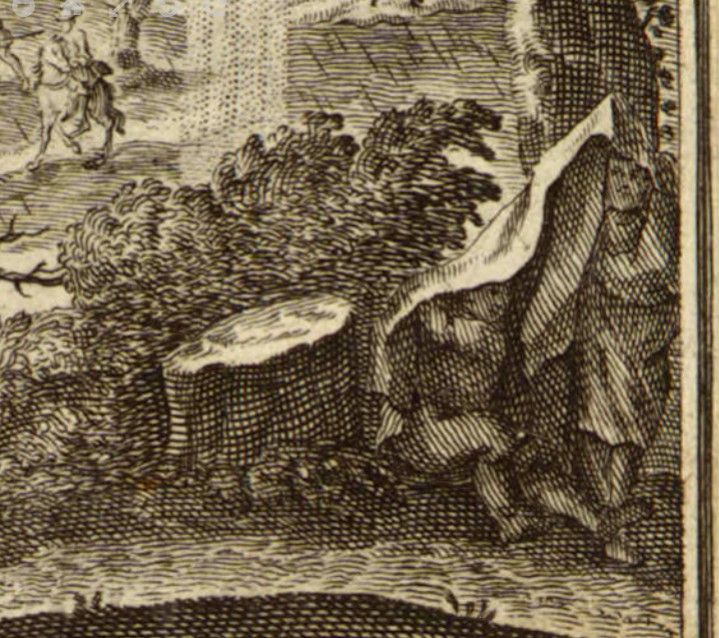
In spite of the inaccuracies, the map is appealing through the detailed use of decorative vignettes: two celestial hemispheres, an eruption of Mt. Etna, an earthquake, the tides, a whirlpool off the Norwegian coast, and diagrams explaining the seasons add interest. Numerous cherubs and windheads, representations of the stars, sun and moon and other decorative features also give the map added visual appeal.
Planiglobii Terrestris was produced by Johann Homann (1663-1724) and first appeared in his Neuer Atlas (1707). Homann was a leading figure in the scientific community of Nuremburg and the preeminent German cartographic publisher of his time.
This map came to the AGS of NY in 1924 as a gift from Mr. F.W. Lafrentz who also donated a 1746 Planiglobii Terrestris.
https://collections.lib.uwm.edu/digital/collection/agdm/id/1215/rec/1
Teaching European Colonialism
by Georgia Brown
This summer the AGSL K-12 Fellowship went virtual! Our Public Services Librarian worked with four awesome teachers in the Milwaukee area as they developed curriculum for their upcoming school years. To see the projects and lesson plans, check out the AGSL’s Resources for Educators.
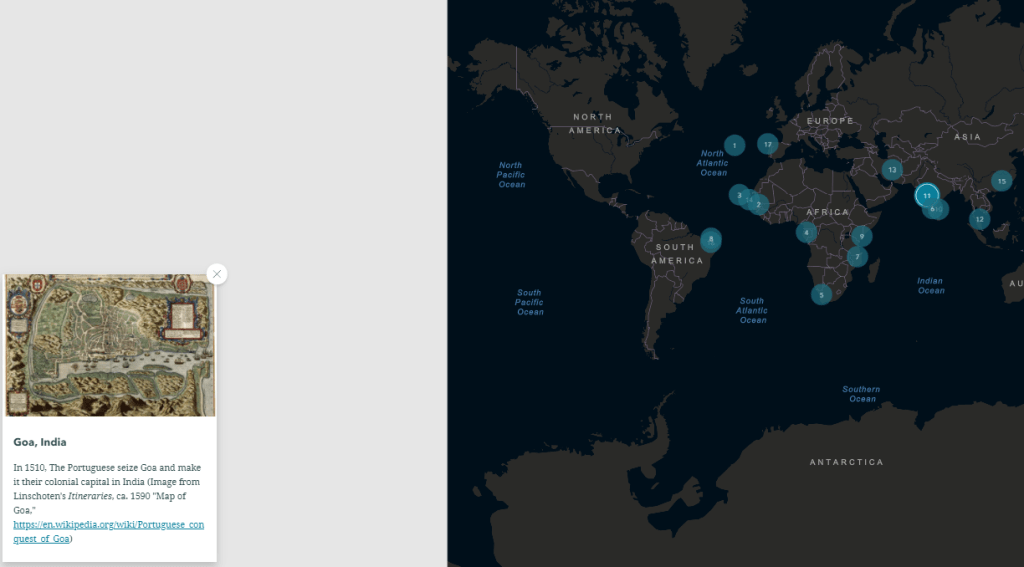
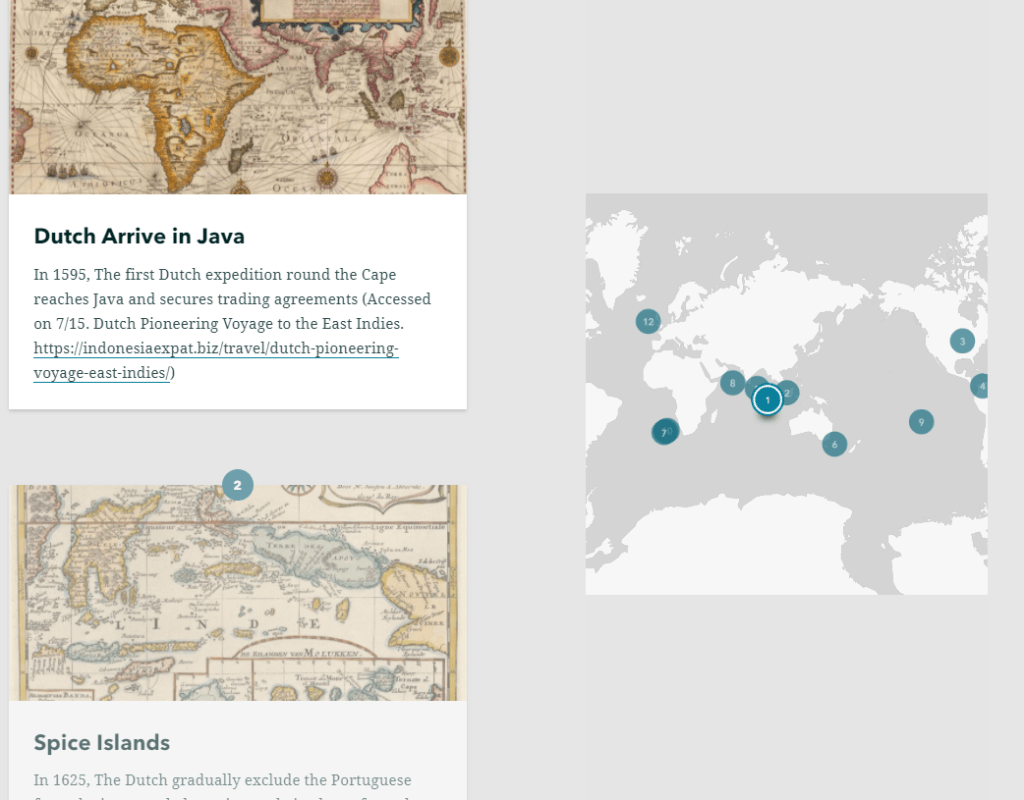
My name is Lukas Wierer, and I am a culturally responsive teacher leader in the Milwaukee Public Schools. I currently teach Ethnic Studies, Restorative Practices and Justice and You at Barack Obama School of Career and Technical Education. Obama is a K-12, but I teach in the high school, which is about 400 students, of which 98% are Black. The unit that I created will be used in my two sections of Ethnic Studies and was focused on European colonialism, specifically the impact that European colonization has had on formerly colonized nations. Throughout this unit, AGSL materials were used primarily as a way to show understanding. For example, I created an ArcGIS StoryMap (European Colonialism) that tracked colonial timelines for six European countries: Portugal, Spain, Great Britain, the Dutch (Netherlands), France, and Germany. Students were asked to examine the timelines, watch accompanying video clips, then, using the AGSL maps, they were asked to connect that content with the given map. I did identify a couple of images of statues/monuments that honor explorers whose “discoveries” were responsible for the resulting colonization of indigenous peoples. I also found a student article from the Black student newspaper, Invictus, entitled “Distortions of Colonization” which will be a good way to show a different perspective on colonialism, specifically the connection to exploitation that has emerged out of global capitalism.
In terms of how I view this unit helping my students, it is part of a sequence. We begin the year by learning about Africa before European arrival, specifically how advanced Africa was economically and politically. This unit will follow immediately and give students a better understanding of how Africa came to be exploited not only for its human resources (through the slave trade), but also for its land and the natural resources that would enrich the colonizers. With these two units as a foundation, we will be able to further examine the role that colonization and global capitalism played in the formation of racist ideas that stick with us today. Although the transition to a virtual classroom will present challenges, I have taught Telepresence for the last two years, so I am not totally unfamiliar with some strategies, but I imagine for this unit, we will spend a lot of our class time really diving deep into the AGSL maps. Because map skills are not typically real strong with my students, this is an area that I will want to explore as a group. The StoryMap and videos should be a little more straightforward for my students. I look forward to using this unit with my students and continuing to blog about how it went.
The Untaught History of Afro-Latinos
This summer the AGSL K-12 Fellowship went virtual! Our Public Services Librarian worked with four awesome teachers in the Milwaukee area as they developed curriculum for their upcoming school years. To see the projects and lesson plans, check out the AGSL’s Resources for Educators.
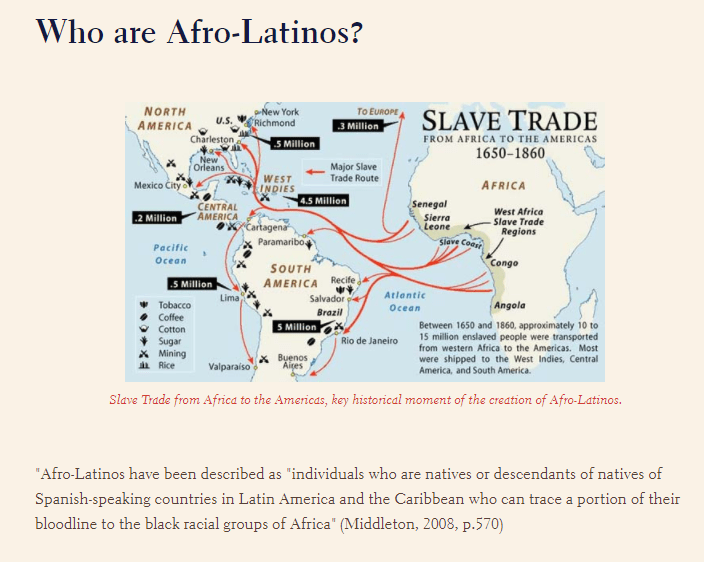
Hello! My name is Arleth Villagran and I am a Spanish teacher for MPS at Pulaski High School in the south side of Milwaukee, Wisconsin. I started my fellowship in June and have been working on my project ever since, my finished project for the AGSL Fellowship is a StoryMap on Afro-Latinos. I incorporated the resources that AGSL provided to me by researching the database on information about Afro-Latinos, I was able to find a wide variety of information in the database. Anything that I had trouble finding, I was able to contact Georgia Brown (AGSL Librarian) and she was able to provide me with resources that I couldn’t find. Afro-Latinos is a topic that rarely gets covered in Spanish classes in the United States and it is a topic of high importance if you are trying to understand the history of Latin America.
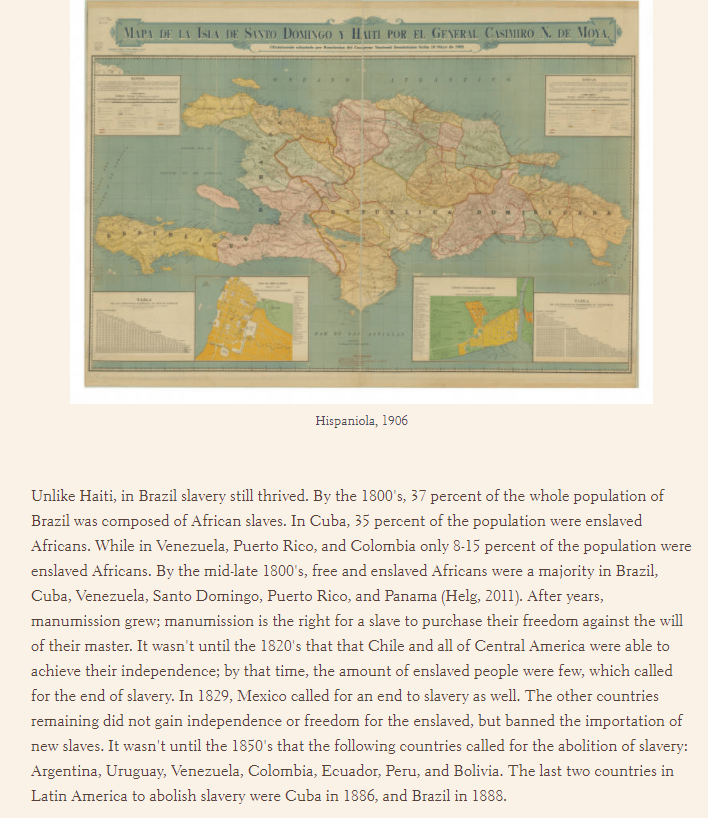
My finished project will help my students understand and be aware of the untold stories and history of Afro-Latinos. Often we think of enslaved Africans and we think of the United States, when in reality more enslaved people were taken to Latin America than the United States. I think it is important for my students to understand this and to be able to know history that often does not get taught in World History classes. Since we are virtual for at least the beginning of this school year, I think that a StoryMap would work well with us being online. StoryMaps allows you to easily navigate information so that it is easy for students to browse even if there isn’t a teacher physically there to help. I will also expect for students to practice their close reading skills and answer text-dependent questions as they read along. It would be really interesting to see students completing a StoryMap! With the Afro-Latino unit, I try to show at least glimpses of the documentary “Afro-Latinos the untaught story” since it is important for students to see that the stories can be directly connected to people. This fellowship was truly a challenge for me, I chose to use StoryMaps as my final project because I had never heard of it before and it truly taught me a lot. As educators, I think it is important for us to expand our knowledge and be able to use different resources available to us. By learning how to use StoryMaps, I can now teach my students how to use it too!
“The History of Sign Languages in North America” and the “The Origins of ASL” StoryMaps
This summer the AGSL K-12 Fellowship went virtual! Our Public Services Librarian worked with four awesome teachers in the Milwaukee area as they developed curriculum for their upcoming school years. To see the projects and lesson plans, check out the AGSL’s Resources for Educators.
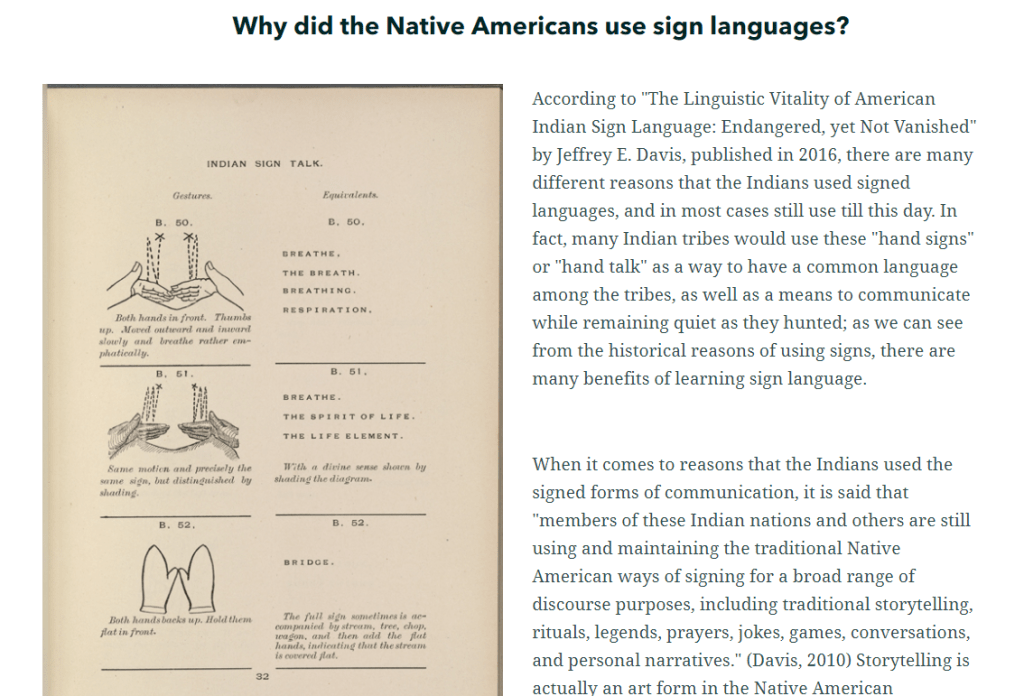
Hello! My name is Aspen Kuk. I am a Child of a Deaf Adult (CODA); my mother and aunt are both Deaf. Therefore, I grew up signing my whole life; in fact, Signing Exact English (SEE) was my first form of communication before I learned to speak English. SEE is a sign language dialect in America that many are not familiar with, or do not realize that it is different from the grammatical structure, as well as the sign structures of American Sign Language (ASL). I am also a High School World Language Teacher, and I am sure you’ve guessed already that I teach American Sign Language. I have always been fascinated by sign languages and had an urge to find the origins of where sign languages in North America and other parts of the World came from, hence where the creation of this StoryMap came from. This is my research connected to the search for “The History of Sign Languages in North America” and the “The Origins of ASL”.
The AGSL materials that I ended up using range from Books, Historical Documents, Photography, Artwork, Maps to Articles discussing the historical facts that connect to the history of sign languages. Both of these StoryMaps will be incorporated into my lessons as I teach ASL 1 & 2. My final goal is for student to not only read the StoryMaps, but annotate as they read and answer text dependent questions connected to the material. I teach at an IB High School, and our focal point for teaching across all content areas is close reading, which ties in perfectly with my introductions of StoryMaps. I plan to demonstrate myself annotating the first portion of both StoryMaps, then have the students complete annotating and reading the rest of the StoryMaps on their own, and lastly answer the text dependent questions; all of these steps will be done online virtually so students can work at their own pace, while still meeting the deadline within a week. This fellowship, not only taught me how to create a StoryMap, but also how to use a StoryMap within the classroom setting, tie the information to my class content, and also challenge my students to use a different close reading structure.
Who I Am, Where I’m From
This summer the AGSL K-12 Fellowship went virtual! Our Public Services Librarian worked with four awesome teachers in the Milwaukee area as they developed curriculum for their upcoming school years. To see the projects and lesson plans, check out the AGSL’s Resources for Educators.
My name is Erin Sivek, and I am an English Language Arts (ELA), Social Studies, and English as a Second Language (ESL) teacher at the International Newcomer Center (INC) in Milwaukee Public Schools. The INC is a specialized program for middle school newcomer refugee English Learners; currently, I serve students from Central and Eastern Africa, Southeast Asia, and the Middle East. Depending on how many refugees are resettled in the US (and specifically Milwaukee) each year, my student population changes in both number and in cultural background.
The curriculum I created through the AGSL grant is titled “Who I Am, Where I’m From,” and focuses on students’ home countries, and how these places have changed over time. Because the majority of my students have spent their childhood in refugee camps or resettled in countries of asylum, they often desire learning about where they’re originally from.
In this unit, students will analyze maps of their homelands from the AGSL Digital Collections dated as recently as 2018 to as far back as 1721. Specifically, students will use three pre-selected maps that include their home countries’ region. After identifying and writing about their homeland, they will study how its name and borders have changed through the time period of these maps. Students will then perform research using online databases to learn how and why these changes occurred. During this unit, students will also acquire new academic vocabulary while gaining insight into how people in power have changed our world.
My students have been learning in a virtual setting since April, and are becoming more skilled in using the tools of this environment. I will teach this curriculum through whole and small group video classes, while also supporting students through live documents, discussion boards, and interactive videos. In culmination, students will create a final assessment piece to demonstrate understanding of their new knowledge using a digital platform. Students will meet various standards in ELA and Social Studies surrounding History, Geography, Inquiry, and Research; such as evaluating people’s relationship to places, connecting past and present, and using geographic tools to analyze the world.
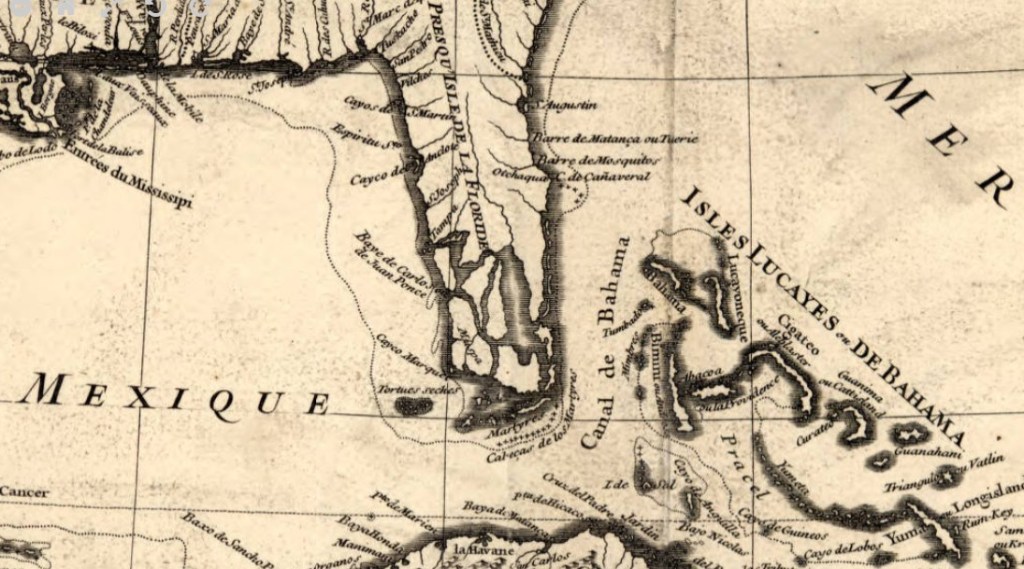
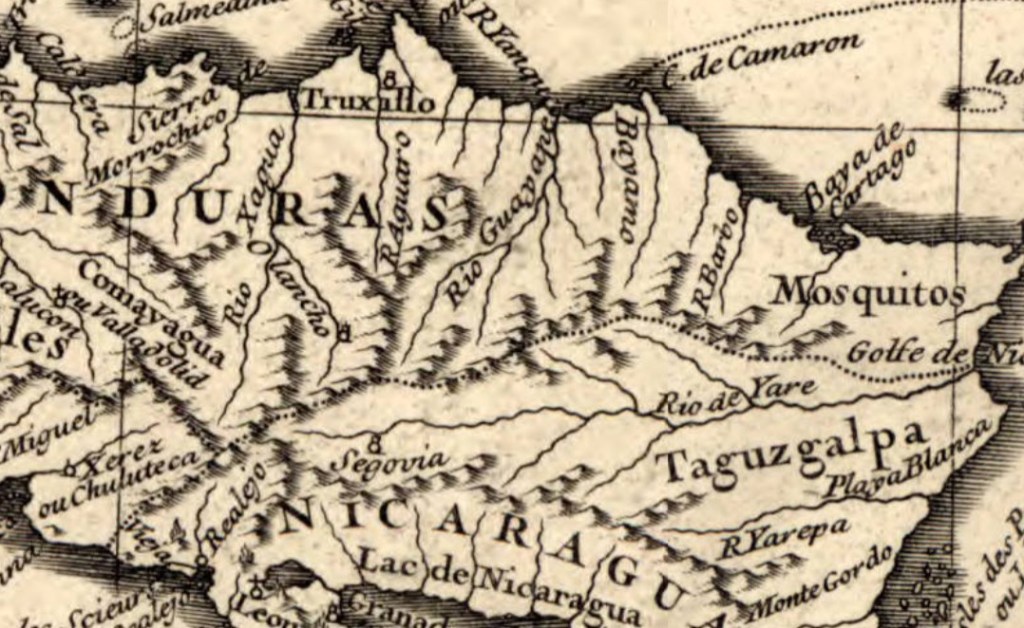
Map of the Caribbean by Jean-Baptiste Bourgulgnon d’Anville, 1731
By Angie Cope
This 1731 map of the Caribbean was originally created to be part of one of the first histories of the Caribbean entitled: Histoire de L’Isle Espagnole ou de S. Domingue by Father Pierre François Xavier de Charlevoix. The map was reproduced and corrected a number of times and this copy reflects the second state of the first edition of the map. French geographer Jean-Baptiste Bourgulgnon d’Anville (1697-1782), the creator of this map, is cited as greatly developing the technical proficiency of mapmaking during his lifetime.
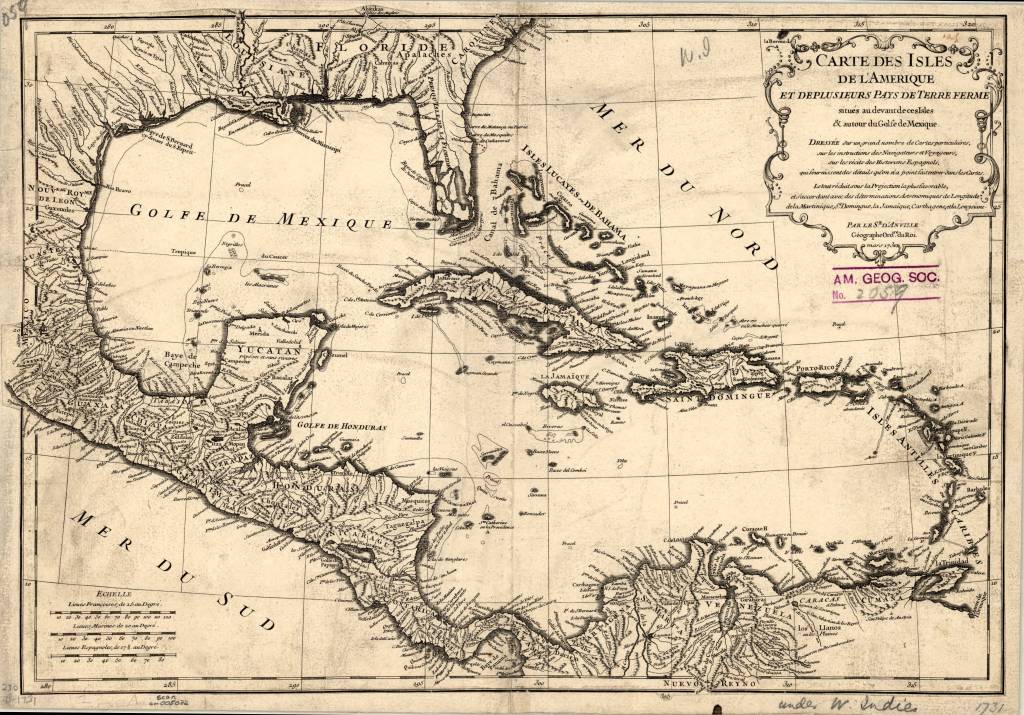
The maps shows the Florida Keys at the south emphasizing their archipelagic nature. River and waterway details are abundant with the entrances to major rivers shown such as the Mississippi, the Rio Bravo and the Orinoco. Terrain is show with illustrations of mountains.
Text in decorative cartouche in upper right translates to:
Map of the isles of America and several countries of the mainland located in front of these Isles & around the Gulf of Mexico.
Made based on a large number of particular maps, on the instructions of navigators and travelers, on the recitals of the Spanish historians, which furnish details which have not been entered into the maps. The whole diminishes under the most favorable projection, and agrees with astronomical determinations of longitude of Martinique, Santo Domingo, Jamaica, Cartagena, and Louysiana
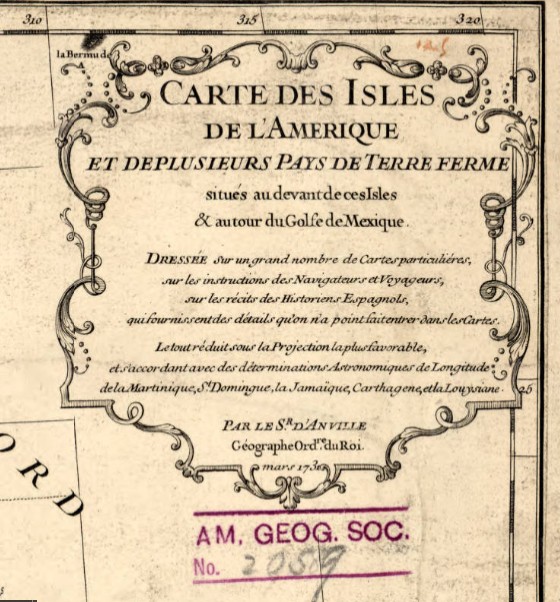
Title: Carte des isles de l’Amerique et de plusieurs pays de terre ferme situes au devant de ces isles & autour du Golfe de Mexique / dressee sur un grand nombre de cartes particulieres, sur les instructions des navigateurs et voyageurs, sur les recits des historiens espagnols, qui fournissent des details quon na point fait entrer dans les cartes ; le tout reduit sous la projection la plus favorable et s’accordant avec des determinations astronomiques de longitude de la Martinique, St. Domingue, la Jamaique, Carthagene et la Louysiane ; par le sr. d’Anville, geographe ordre. du roi, mars 1731 ; Delahaye sculpsit.
Call number: (AGS) (RARE) 230 B-1731
Scale: 1:10,000,000
Published by: Jean-Baptiste Bourgulgnon d’Anville in Paris
Dimensions: 1 map ; 31 x 44 cm
View map in the Digital Collection: https://collections.lib.uwm.edu/digital/collection/agdm/id/361/rec/1
Ocean liner routes between Germany and Africa, 1914
by Angie Cope
Afrika / Geograph. Anstalt von Wagner & Debes, ; L. Friederichsen & Co. ; Woermann-Linie A.G.
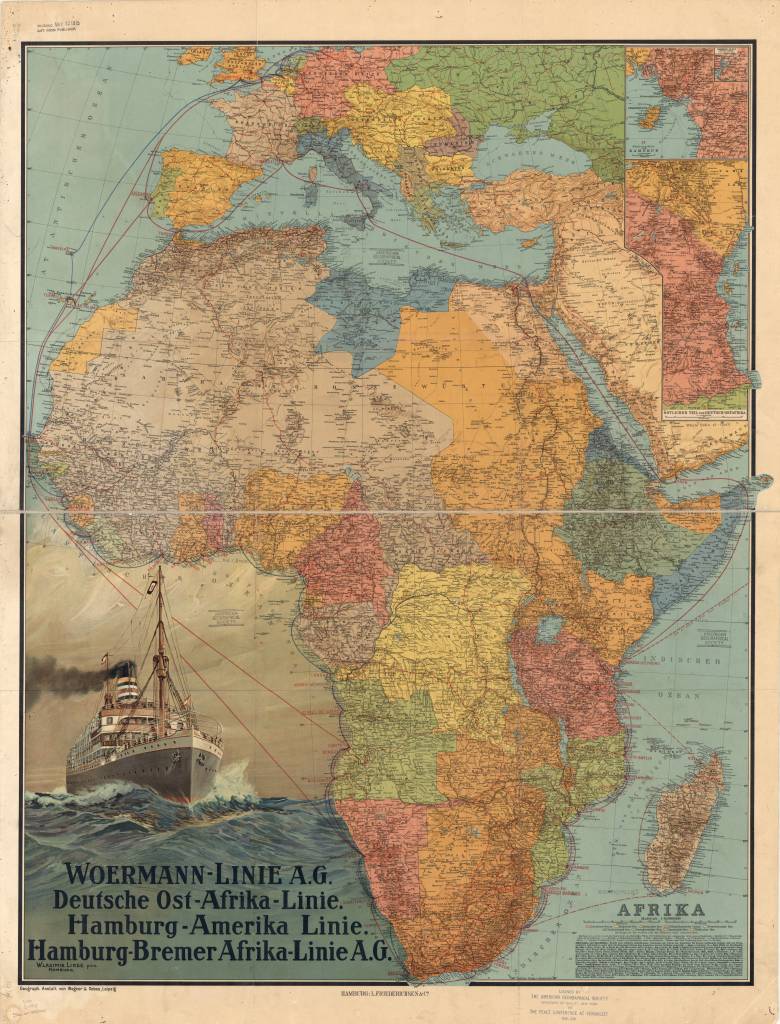
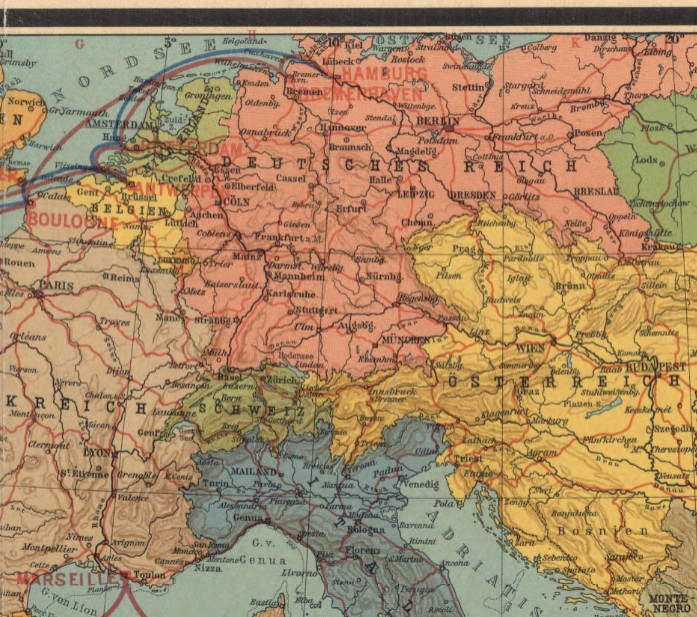
This map of Africa was published in Germany in 1914, shortly before the outbreak of World War I. It shows the ocean liner routes between Germany and Africa, as well as coastal and inland routes.
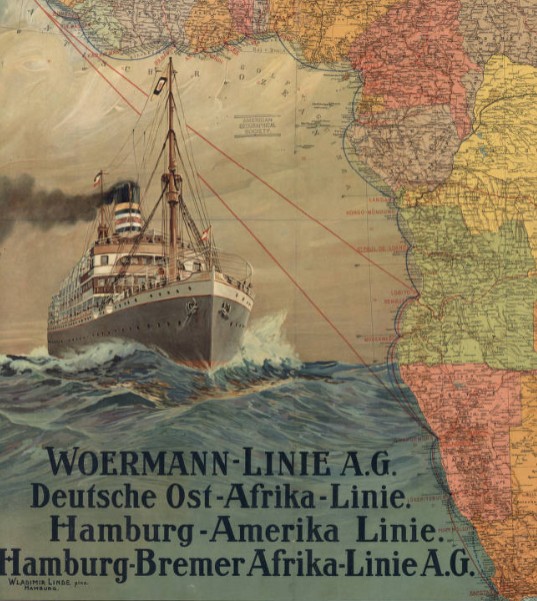
Relief is shown by hachures and spot elevations. In the lower left are an illustration of a steamship on the high seas and a listing of the major German steamship lines providing service to Africa, Woermann-Linie A.G., Deutsche Ost-Afrika Linie, Hamburg-Amerika Linie, and Hamburg-Bremer Afrika-Linie A.G.
In the upper right is an inset map of the coastal region of the German colony of Cameroon and an inset to the inset showing the inland course of the Cameroon River. Below these maps is another inset showing the eastern part of German East Africa. The key at the lower right indicates the wealth of information contained in the map.
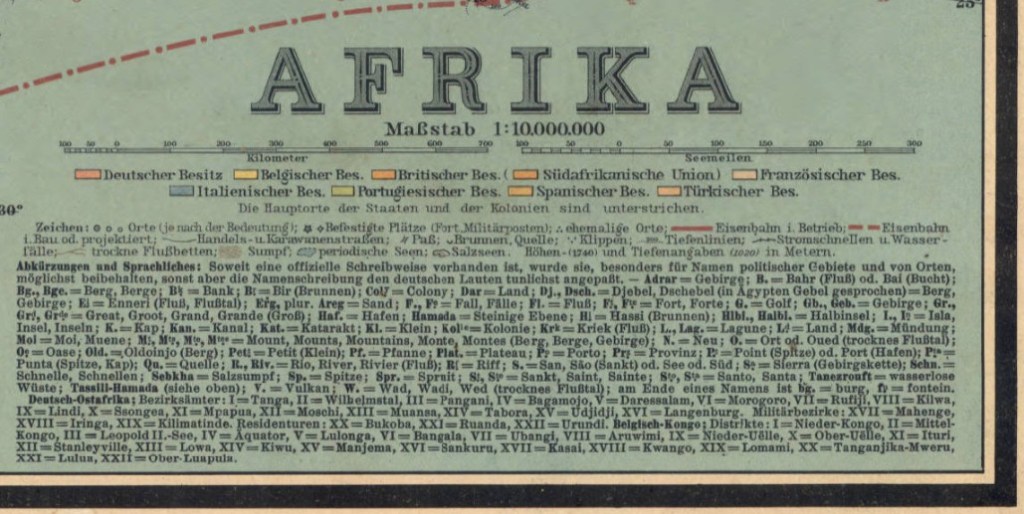
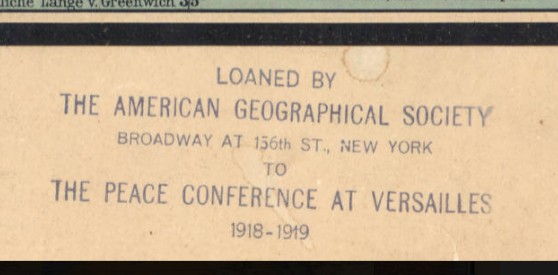
Two distance scales are provided, kilometers and nautical miles. Different colors are used to mark the colonial possessions of Germany, Great Britain, Belgium, France, Italy, Portugal, Spain, and Turkey. Symbols indicate cities and towns by population size, forts and military posts, ruins, railroads (operational and planned), caravan routes, mountain passes, wells and springs, and swamps and other geographic features. There is an alphabetical list of abbreviations for geographic terms in local languages and their German equivalents. Roman numerals are used to identify the districts and other administrative divisions in the Belgian Congo and German East Africa. The map was prepared by Wagner & Debes, a German firm that specialized in providing maps for inclusion in the famous guidebooks for travelers published by Karl Baedeker in the 19th and early 20th centuries. A stamp at the bottom indicates that the map was loaned by the American Geographical Society of New York to the Peace Conference at Versailles, 1919.
View map in the American Geographical Society Library Digital Map Collection
https://collections.lib.uwm.edu/digital/collection/agdm/id/364/rec/1
Mosquito Coast, Nicaragua 1845
By Angie Cope
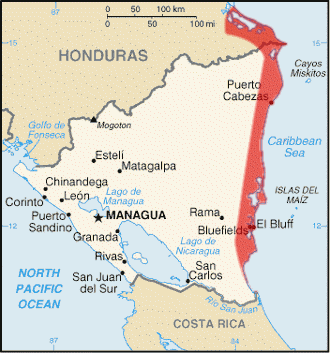
The Mosquito Coast is the region along Nicaragua’s eastern coast. It was claimed by Great Britain from 1655 until 1820s. The region became part of Nicaragua in 1860, with a northern portion granted to Honduras in 1960. In 1840s, when this map was created, Nicaragua was studied as a possible transoceanic canal connecting the Atlantic and Pacific Oceans. The region also provided a route for travelers from the eastern United States during the California Gold Rush, via the use of the San Juan River and Lake Nicaragua.
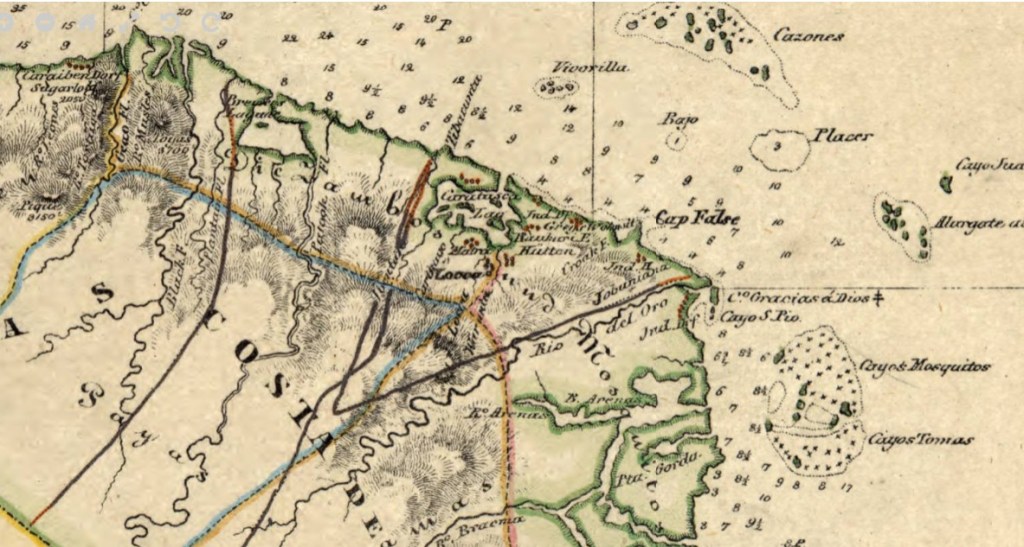
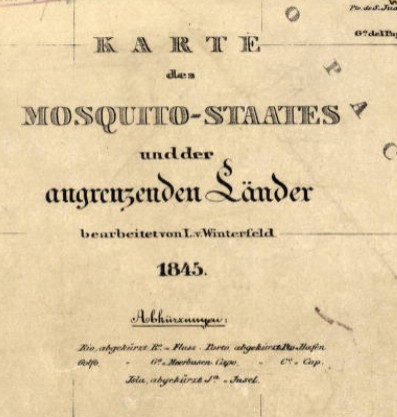
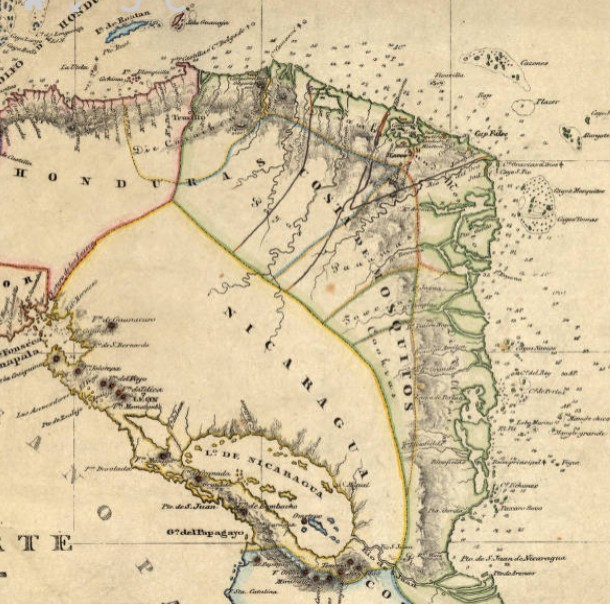
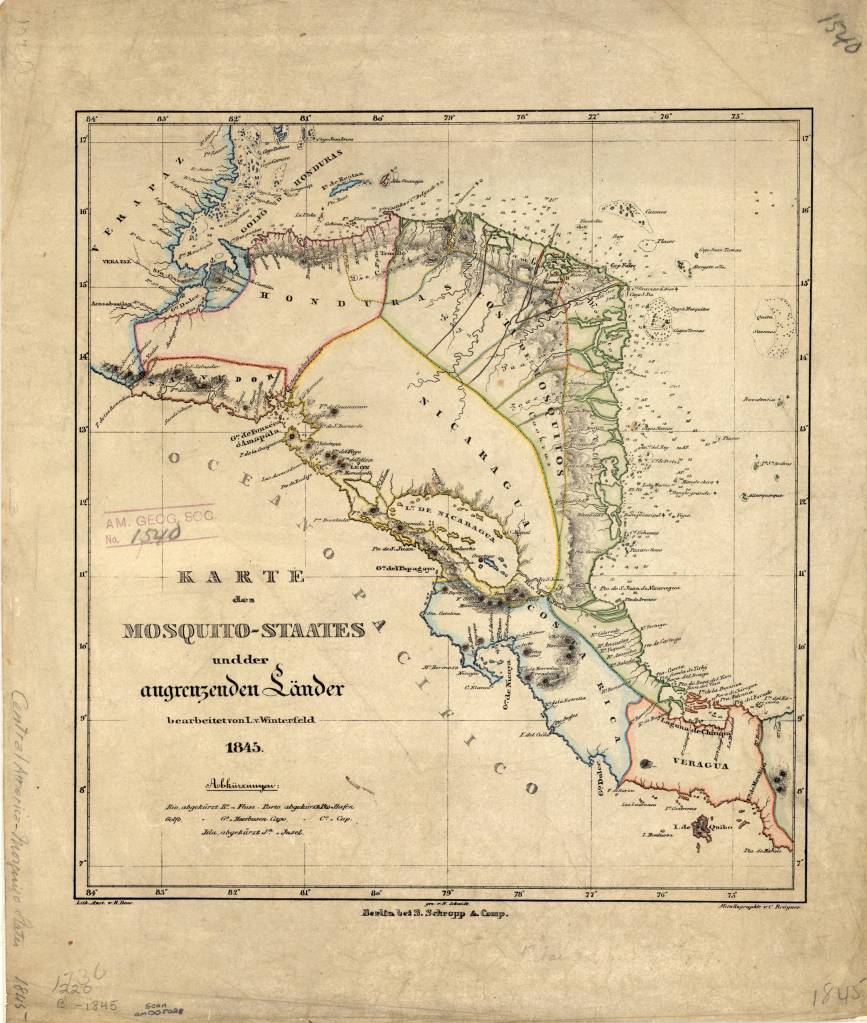
Karte des Mosquito-Staates undder angrenzenden Länder / bearbeitet von L. v. Winterfeld ; S. Schropp & Comp., 1845
Call number: (AGS) (RARE) 220 B-1845
1 map : color ; 33 x 30 cm.
Published in Berlin by Simon Schropp’sche Hof-Landkartenhandlung.
https://collections.lib.uwm.edu/digital/collection/agdm/id/360/rec/1
Humboldt Bay, California 1850s
by Angie Cope
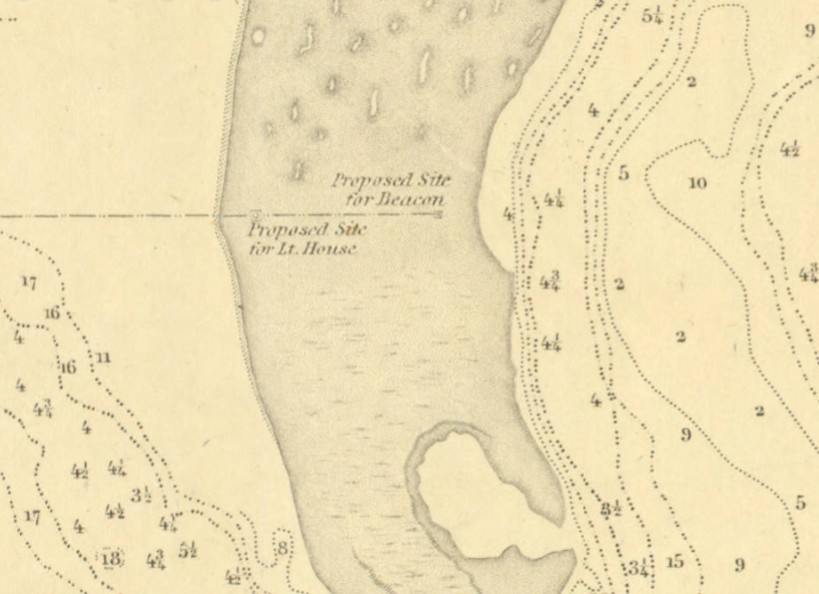
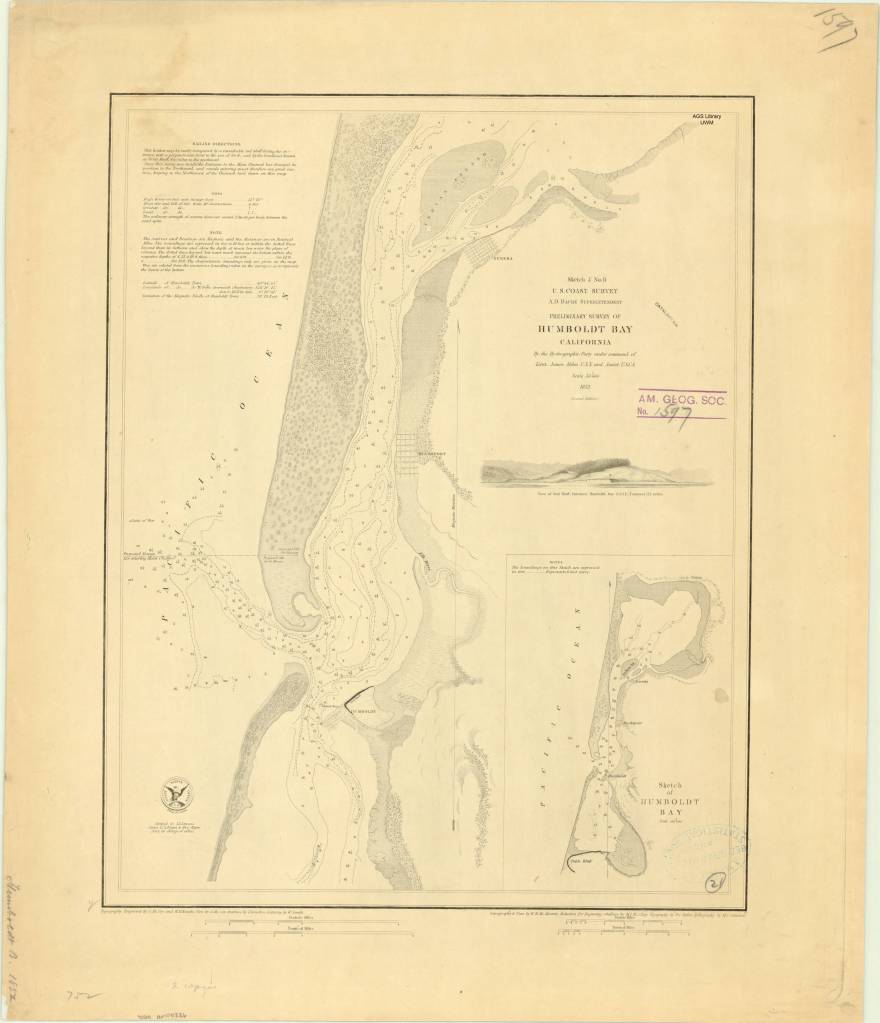
Preliminary survey of Humboldt Bay, California / U.S. Coast Survey, 1858.
Rare Map: Chart CS Pacific Humboldt Bay 1858
https://collections.lib.uwm.edu/…/collec…/agdm/id/6097/rec/1

Humboldt Bay is a natural bay located on the rugged North Coast of California between San Francisco Bay and Puget Sound. The Bay is home to more than 100 plant species, 300 invertebrate species, marine and land mammals, hundreds of fish species, and more than 200 species of birds.
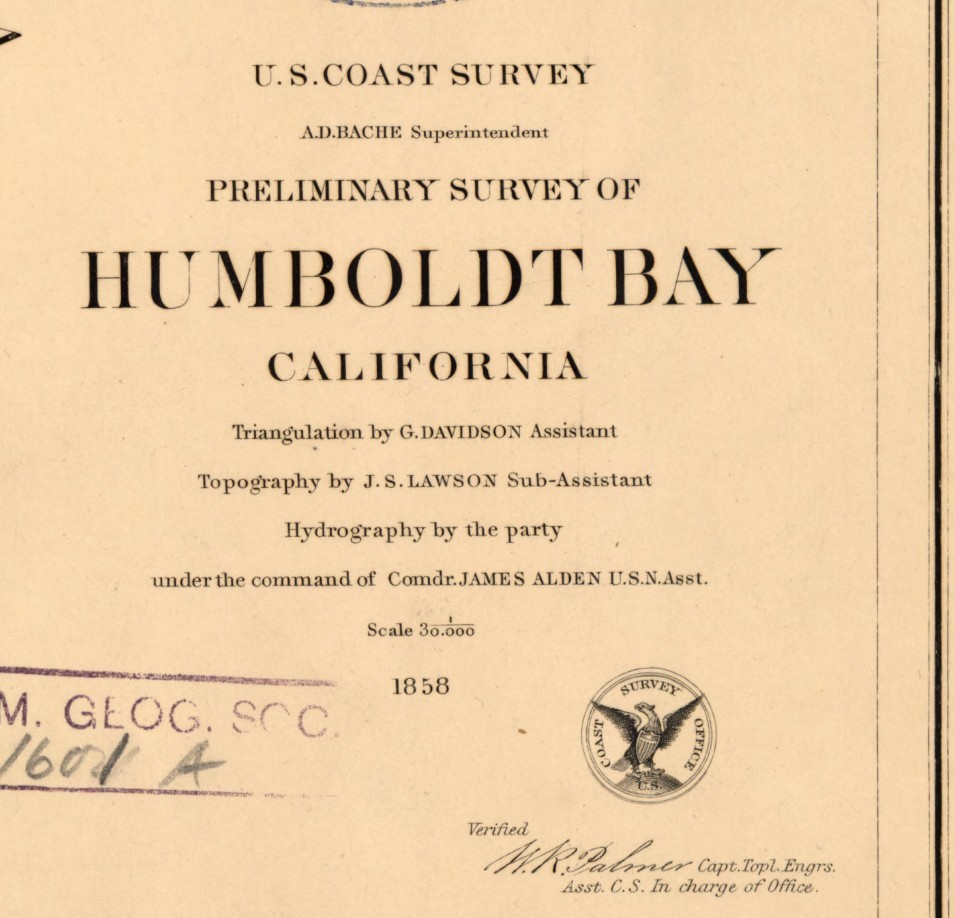
The Wiyot people were the first to inhabit the Humboldt Bay region, estimated to have arrived around 900 A.D. Their name for the bay is Wike or Wiki. Indian villages shown on this 1858 map are circled in pink.
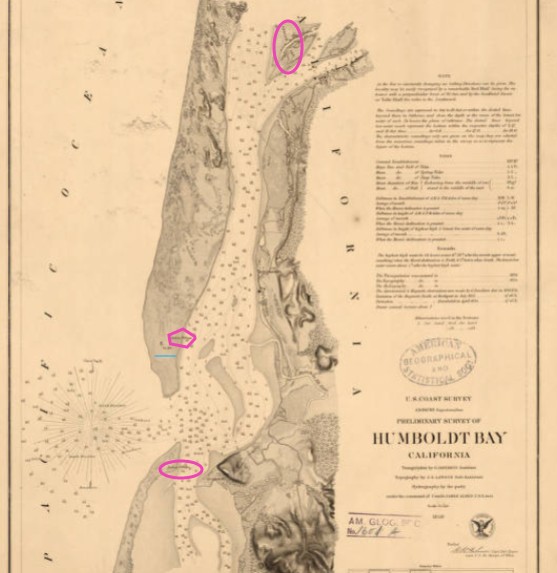
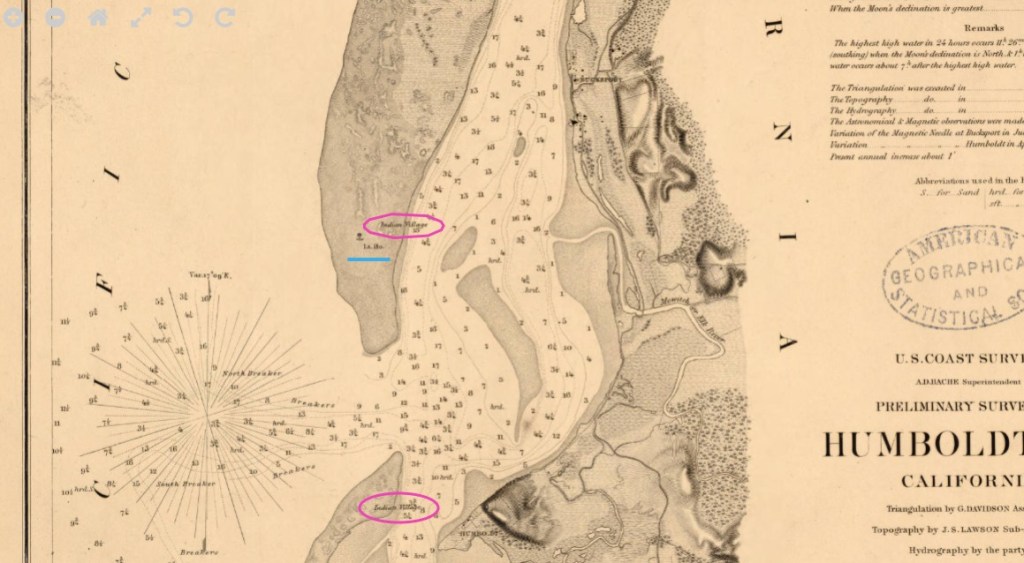
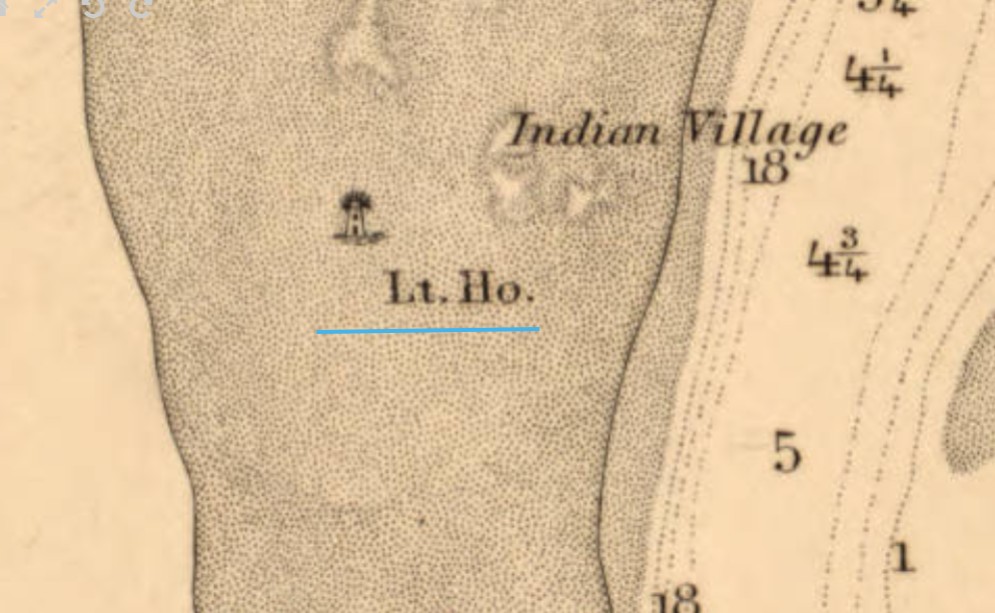
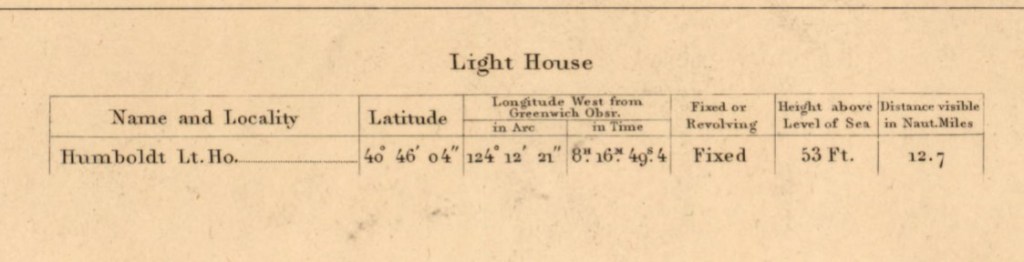
Beginning in the 1850s, settlers used the bay for shipbuilding and the export of lumber. In 1856 the Humboldt Harbor Light was built on the north spit (underlined in blue).
Interesting factoid: There is a memorial to the USS Milwaukee in Eureka, California on Humboldt Bay. In 1917, the USS Milwaukee ran aground while trying to tow a beached submarine. Remnants of the wreck are still visible today at low tide.
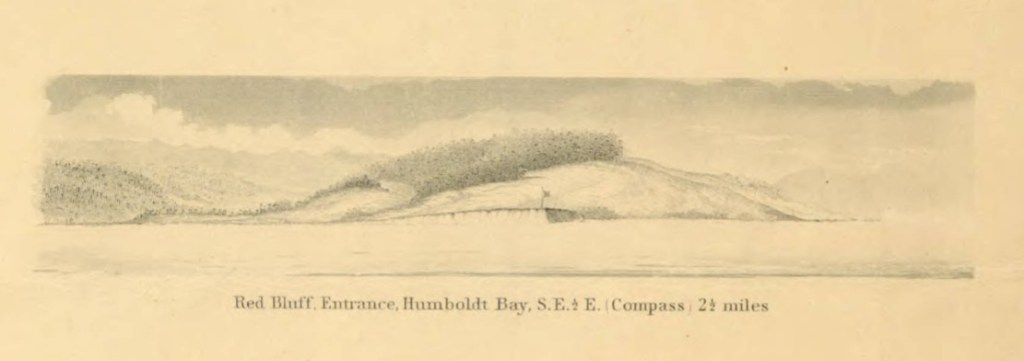
Illustrated view: Red Bluff entrance, Humboldt Bay, S.E. 1/2 E. (compass) 2 1/2 miles
From: Reconnaissance of the western coast of the United States : middle sheet : from San Francisco to Umpquah [sic.] River, 1854
https://collections.lib.uwm.edu/digital/collection/agdm/id/6717/rec/17
Preliminary survey of Humboldt Bay, California / U.S. Coast Survey, 1852
https://collections.lib.uwm.edu/digital/collection/agdm/id/4778/rec/1,
Shows the proposed site for the light house built in 1856.